Nasdaq QQQ Invesco ETF (QQQ) Pullback Meets a 100% Midterm-Year Win Record Starting Jul 30
Nasdaq QQQ Invesco ETF is days away from a 364-day midterm-year seasonal window that has never been negative in this dataset, just as tech leadership again anchors the broader market.

What is the seasonal pattern for Nasdaq QQQ Invesco ETF (QQQ)?
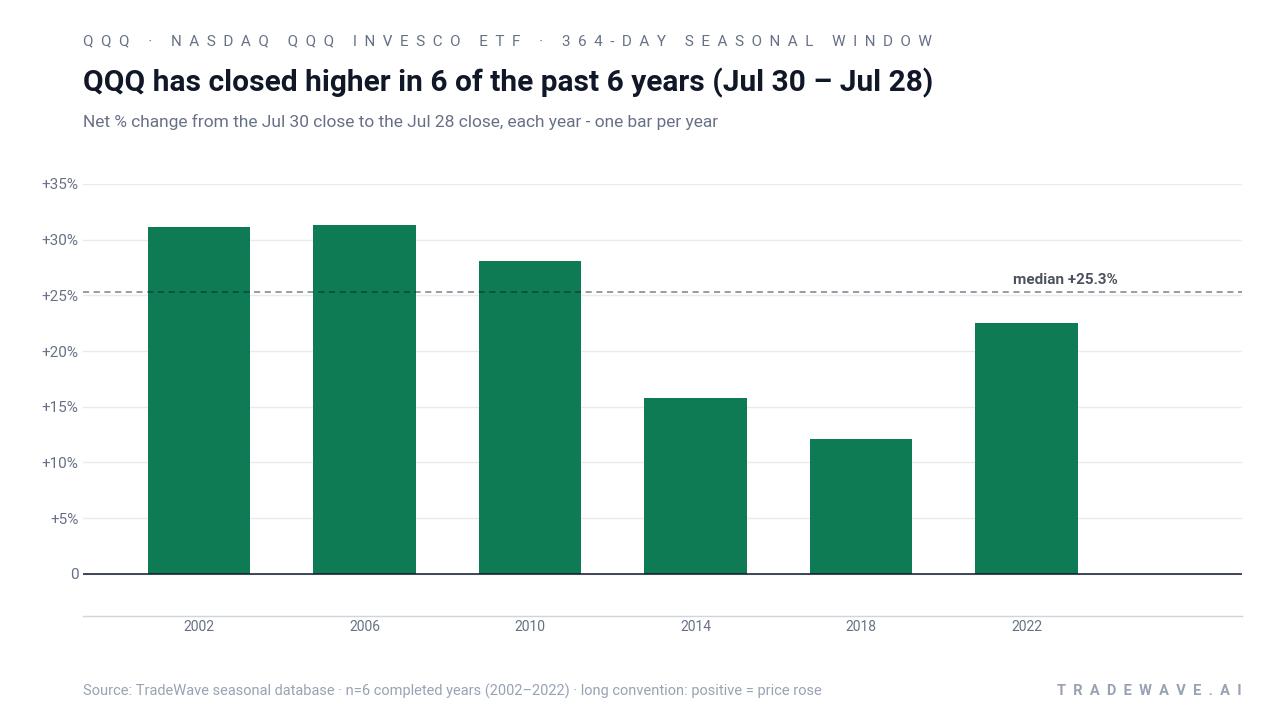
Nasdaq QQQ Invesco ETF has risen in 6 of 6 midterm election year windows starting Jul 30 and lasting 364 days, with an average gain of 23.49% in winning years.
- 6 for 6 in this window, with Nasdaq QQQ Invesco ETF averaging 23.49% gains in those winning years.
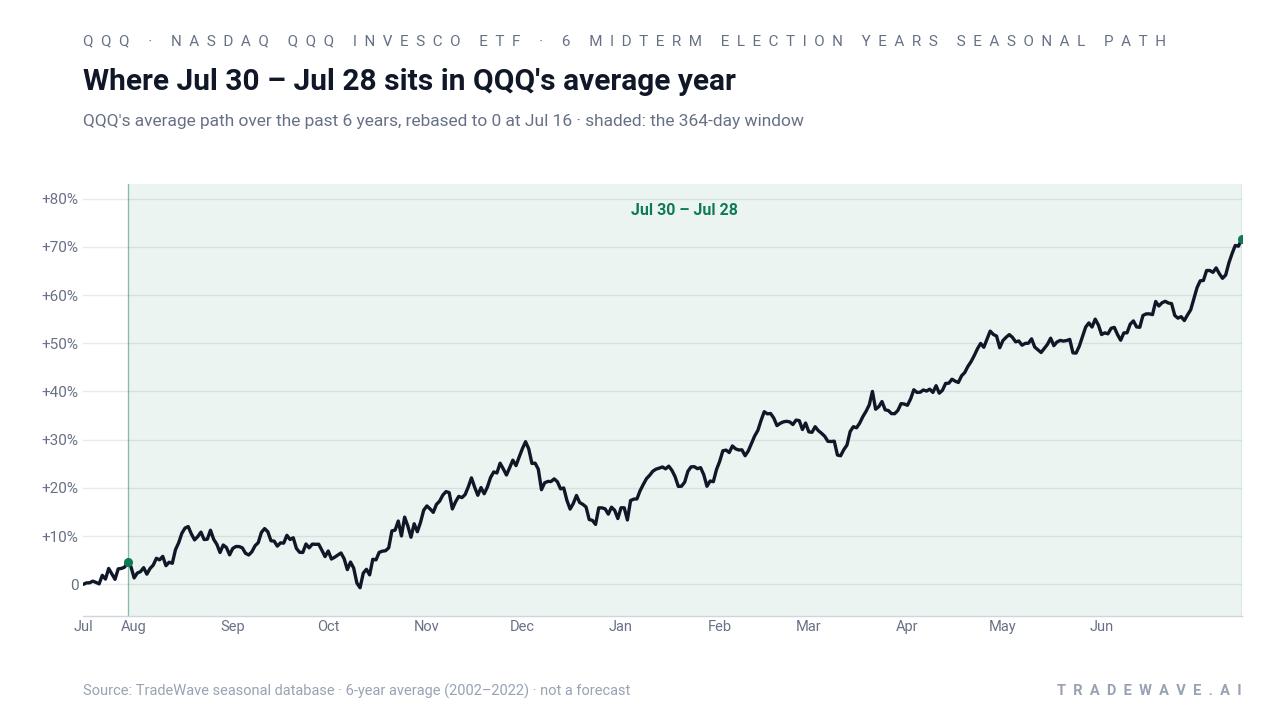
- The upcoming 364-day window runs from Jul 30, 2026 through Jul 28, 2027 and is drawn from the last 6 midterm election years.
- Percent Profitable is 100%, with 6 winners and 0 losers across the historical sample.
- Average winner gains range from 12.11% to 31.28% by year, stacking to a 250% cumulative return when compounded.
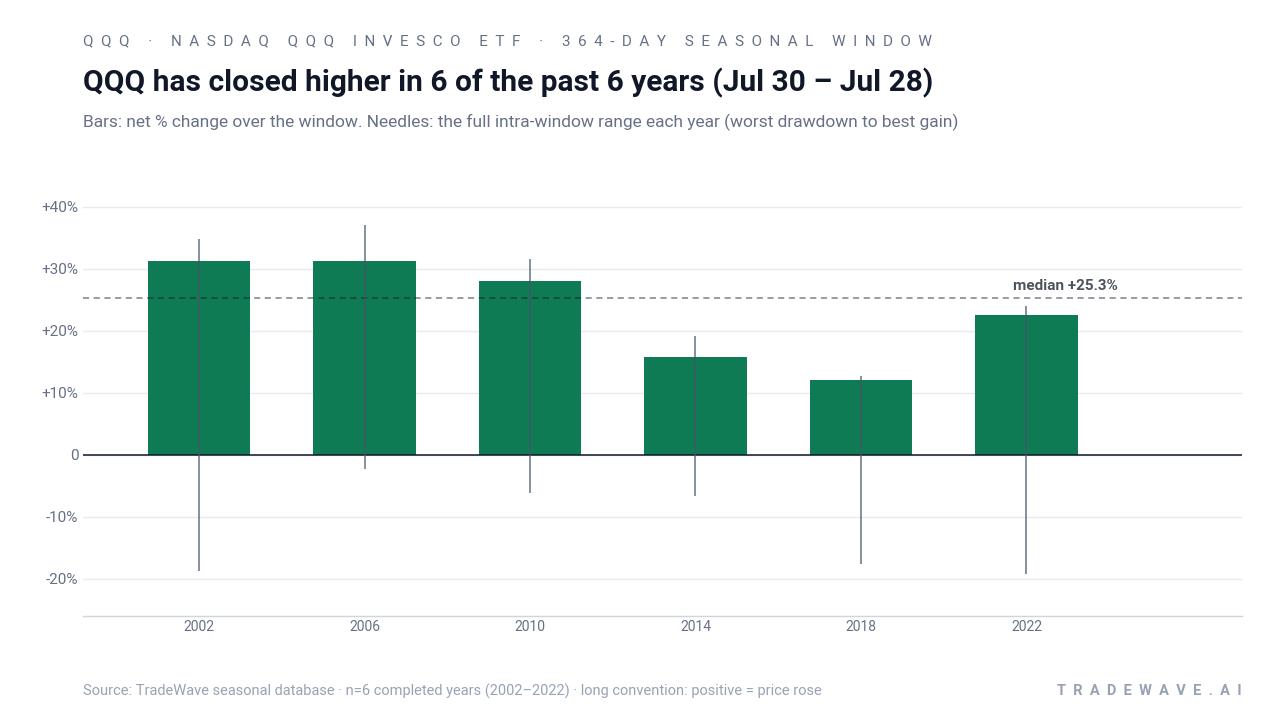
- Intraperiod swings have been meaningful, with worst drawdowns in individual years reaching between about 2% and nearly 19% below entry.
- The pattern is long-directional, with a TradeWave Ratio of 2.36 and a Sharpe ratio of 2.4, pointing to historically strong risk-adjusted returns in this specific window.
According to historical data from TradeWave.ai, this midterm-year stretch has behaved very differently from an average calendar year for QQQ, and the next iteration is about to start.
How strong is the upcoming seasonal window for Nasdaq QQQ Invesco ETF (QQQ)?
Nasdaq QQQ Invesco ETF has closed higher in every single one of the last 6 midterm election year windows that began around Jul 30, averaging 23.49% gains over each 364-day stretch. The new window opens on Jul 30, 2026, with QQQ recently trading below its 52-week high of 747.00 and above its 52-week low of 546.40, after a one-month pullback of 2.63% that cooled a powerful multi-year run. This combination of a flawless historical record and a modest near-term consolidation gives traders a clean lens on how tech-heavy risk has tended to behave as midterm years transition into the year before the presidential election.
Because this pattern is grouped by the presidential election cycle, it only looks at midterm election years, then follows QQQ through the full 364-day span that bridges into the year before the presidential election. That matters for a tech-heavy ETF like QQQ, since policy uncertainty, regulation debates and fiscal positioning often shift meaningfully between the midterm vote and the pre-election ramp, shaping how investors treat growth and mega-cap exposure.
Across the six completed midterm-year samples, the trade direction is firmly long. Percent Profitable is 100%, with 6 winners and 0 losers, and the average profit of 23.49% means that even the softer years still delivered double-digit gains over the window. The strongest individual year in this pattern was 2006, when QQQ gained 31.28% between the Jul 30 entry and the Jul 28 exit, while the weakest was 2018, which still finished up 12.11% despite a sharp fourth-quarter correction in that cycle.
The distribution of outcomes is tight for a risk asset. The median profit of 25.27% sits slightly above the average, which tells you that more than half of the historical windows clustered in the mid-20% range rather than relying on a single outlier year. The annualized return of 23.26% and a Sharpe ratio of 2.4 underline that, in this specific midterm-year slice, QQQ has historically delivered strong risk-adjusted performance compared with its own long-run volatility profile.
Intraperiod swings have still been real. Maximum favorable moves, or the best point-to-peak gains within each window, ranged from 12.65% in 2018 to 36.99% in 2006, showing that in strong years QQQ often pushed well beyond the final close before consolidating. On the downside, maximum adverse moves, or the worst drawdowns from entry, ranged from just 2.26% in 2006 to nearly 19.21% in 2022, when the ETF endured a deep mid-cycle selloff before recovering into the exit date.
Year-by-year bars that combine net results with intraperiod ranges show how upside and downside have coexisted inside this otherwise consistent pattern.
The cumulative chart for this pattern compounds each Jul 30 – Jul 28 window on top of the last and reaches a 250% total gain across the six midterm-year samples. Add it up and you get a picture of a window that has not just been positive more often than not, but has delivered a steady staircase of gains across two decades of very different macro backdrops.
History does not guarantee future results; adverse excursions can still be large even in winning windows, and QQQ has previously seen drawdowns approaching 20% inside this pattern before recovering.
Why does Nasdaq QQQ Invesco ETF (QQQ) follow this seasonal pattern?
One likely driver is the way the tech earnings calendar and guidance cycles bunch up around the midterm-to-pre-election transition, when management teams often reset expectations and investors reprice growth stories. Analysts have also pointed to institutional portfolio rebalancing and sector rotation, as large allocators lean back into risk assets once midterm political uncertainty clears. This pattern may also reflect the broader tendency for the year before the presidential election to be supportive for equities, with policy makers historically favoring stability and growth, which tends to benefit QQQ’s mega-cap tech heavy lineup.
What is driving Nasdaq QQQ Invesco ETF (QQQ) today?
QQQ has spent the past month consolidating, slipping 2.63% over that span after a strong run that carried it to a 52-week high of 747.00, well above its 52-week low of 546.40 and its recent 50-day moving average of 717.89. Trading volumes around 38.3 million shares a day over the last 20 sessions point to active positioning rather than a sleepy summer drift, as investors weigh stretched valuations in mega-cap tech against still-robust earnings and the prospect of a friendlier policy backdrop in the year before the presidential election.
The chart below situates the latest move in its recent multi-month context and overlays the median historical seasonal path for the next 60 days.
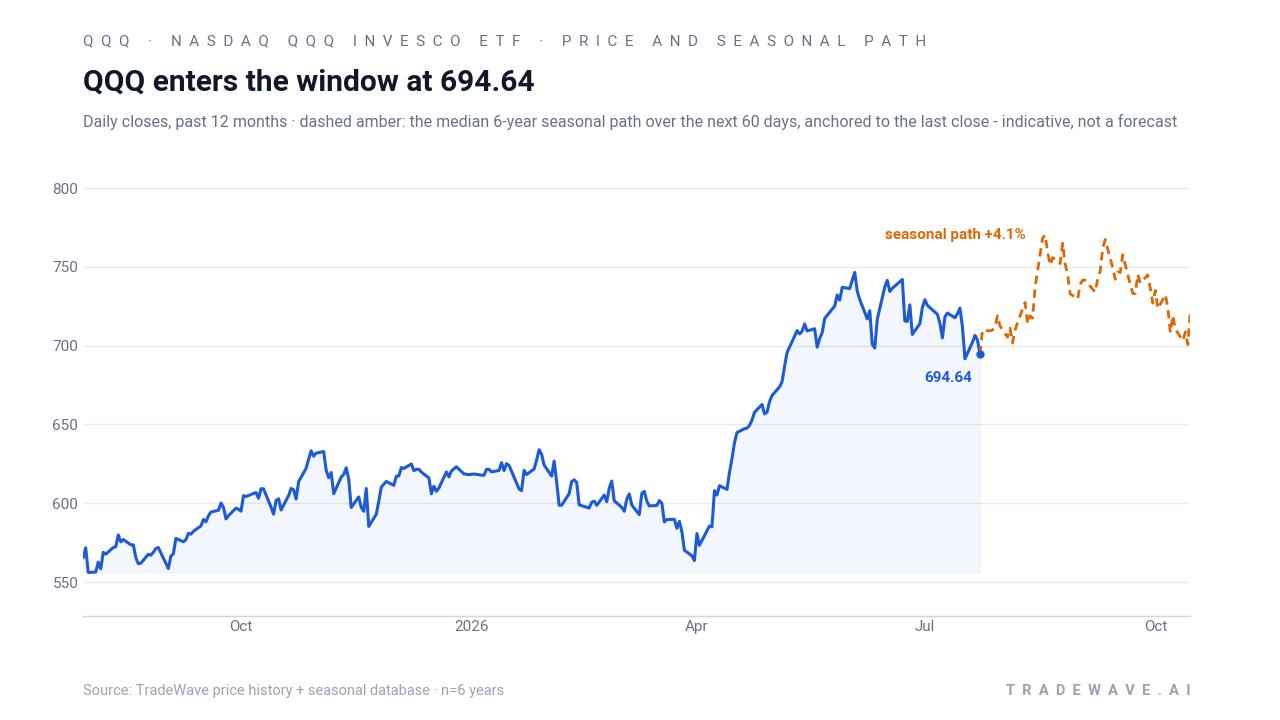
Macro headlines around QQQ in 2026 have largely been about its role as a shorthand for US growth and tech risk, with price snapshots on market pages showing sharp daily swings as investors react to shifting rate expectations and sector news.[1] Those snapshots capture how quickly sentiment can flip around this ETF, which is why a long, historically consistent seasonal window that begins in late July is notable for traders trying to separate noise from signal.
Sources
About this seasonal analysis
Seasonal pattern data is sourced from TradeWave.ai, which analyzes historical price behavior across annual calendar windows going back up to 30 years. Read the full data methodology or the book The 100-Year Pattern by Afshin Moshrefi (2026 edition). Past performance of seasonal patterns does not guarantee future results. This article is for informational purposes only and does not constitute investment advice.