6-for-6: S&P 500 Technology Sector SPDR (XLK) Has Never Lost in This 348-Day Midterm Run
S&P 500 Technology Sector SPDR is nearing a 348-day midterm-year seasonal window that has never been negative in the data, just as tech leadership and volatility remain in focus.

What is the seasonal pattern for S&P 500 Technology Sector SPDR (XLK)?
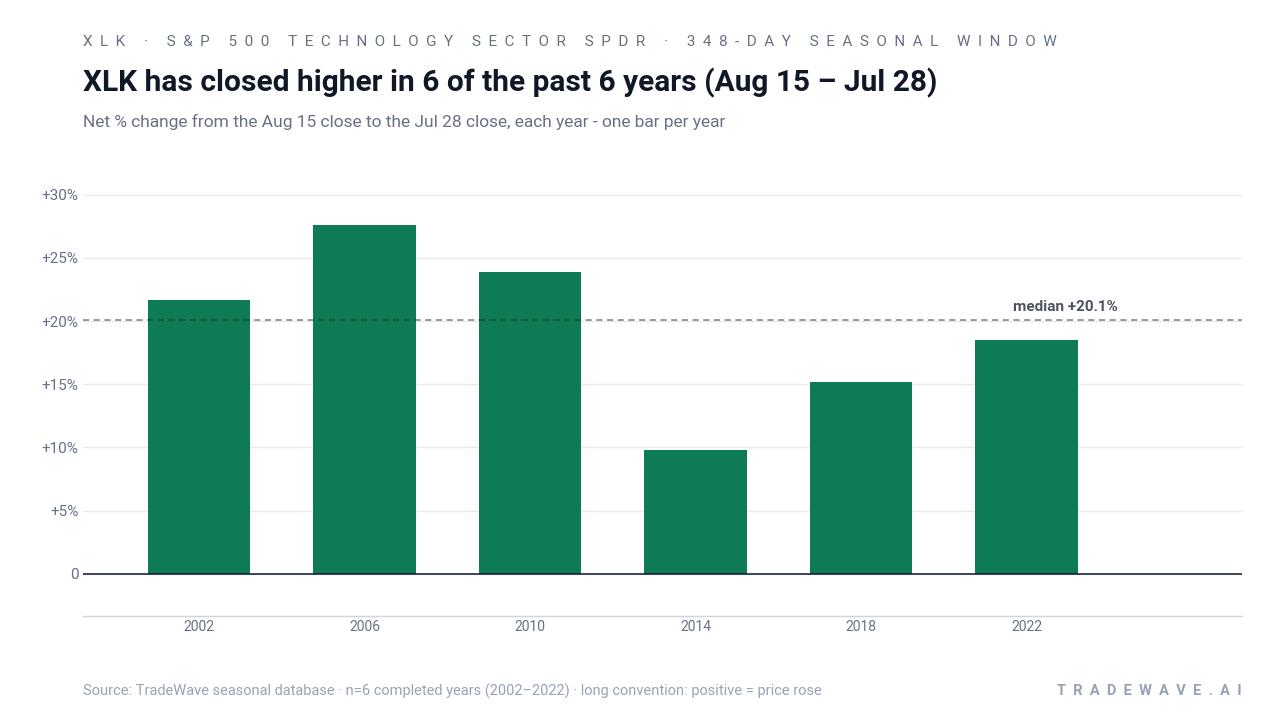
S&P 500 Technology Sector SPDR has risen in 6 of 6 midterm-year Aug 15–Jul 28 windows, with an average gain of 19.44% in winning years.
- 6 for 6 in this window, with XLK posting gains every time and averaging 19.44% in those winning years.
- The upcoming seasonal stretch runs from Aug 15, 2026 through Jul 28, 2027, spanning 348 calendar days in the midterm election year.
- Percent Profitable is 100%, with 6 winners and 0 losers across the last six midterm election-year cycles.
- Average profit of 19.29% annualized and a Sharpe ratio of 2.45 point to a historically strong long-side profile.
- A TradeWave Ratio of 2.46 suggests XLK has typically traveled meaningfully in the trade direction within this window, even before the final close.
- Individual years have still seen sizable drawdowns inside the window, underscoring that the path to those gains has not been smooth.
According to historical data from TradeWave.ai, this midterm-year stretch for XLK has behaved very differently from an average calendar year, with a distinct long-biased pattern that has repeated across multiple cycles.
How has S&P 500 Technology Sector SPDR (XLK) traded in this midterm-year window?
S&P 500 Technology Sector SPDR has finished higher in all six prior midterm election-year windows running from Aug 15 to Jul 28, averaging gains of 19.44% for long positions. The next iteration of this 348-day seasonal regime begins on Aug 15, 2026, with XLK coming off a modest 2.51% pullback over the past month and trading below its 50-day moving average of 183.06. For tech traders, that combination of a clean win streak and a short-term cooling phase sets up a high-stakes test of whether this historical seasonality still matters in a market dominated by mega-cap growth.
Because this pattern is grouped by the presidential election cycle, it only looks at midterm election years, not a run of consecutive calendar years. That matters for tech because policy, regulation and liquidity often shift in midterm years as Washington moves from early-term agenda setting toward the run-up to the next presidential race, a backdrop that has historically lined up with strong risk appetite for growth sectors.
The trade direction for this setup is explicitly long. Across the six completed midterm-year windows since 2002, XLK has never produced a losing outcome for this Aug 15–Jul 28 stretch, with net returns ranging from a softer 9.78% gain in 2014 to a 27.57% surge in 2006. Add it up and stacking those windows compounds to roughly 188% cumulative return, which is unusually strong for a single recurring slice of the calendar.
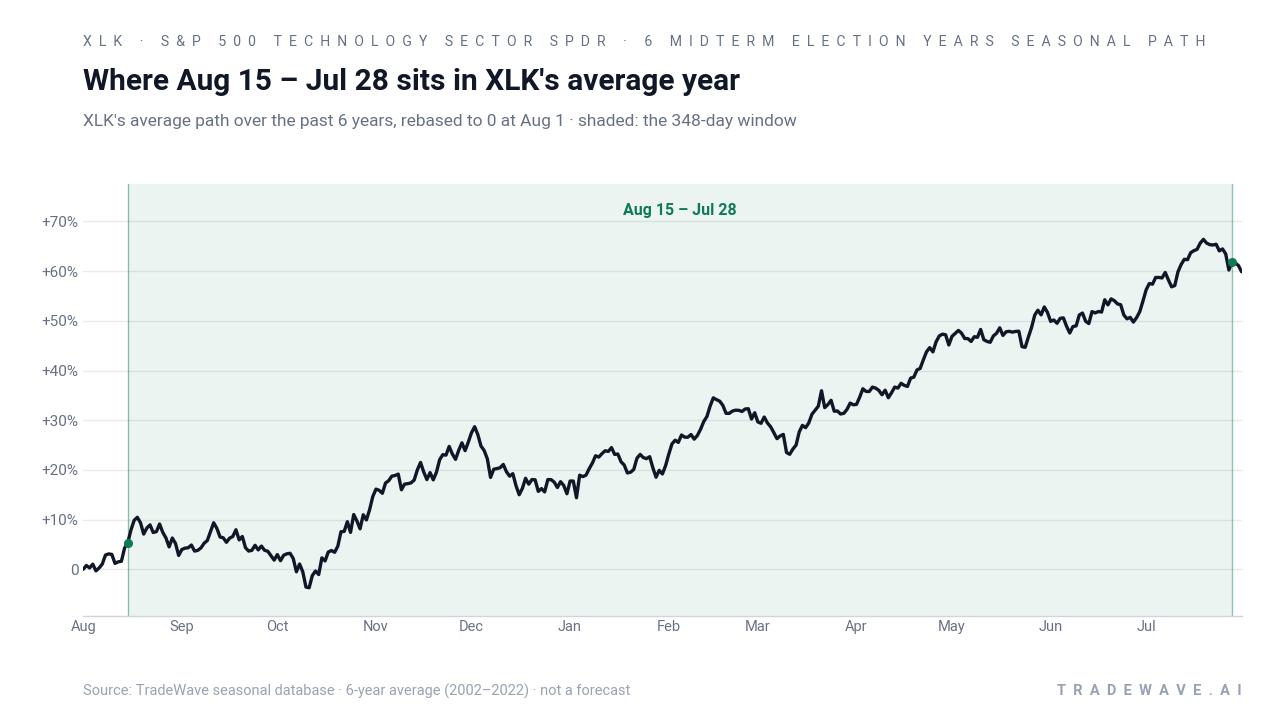
The historical seasonal trend chart suggests the typical XLK year in this window is not a straight line. The average path slopes higher across the full 348 days, with periods of consolidation and pullback along the way, which fits a pattern of tech leadership punctuated by policy scares, earnings resets and rotation into and out of growth.
The combined net, best-case and worst-case moves by year show how much air and risk have been present inside this otherwise consistent pattern.
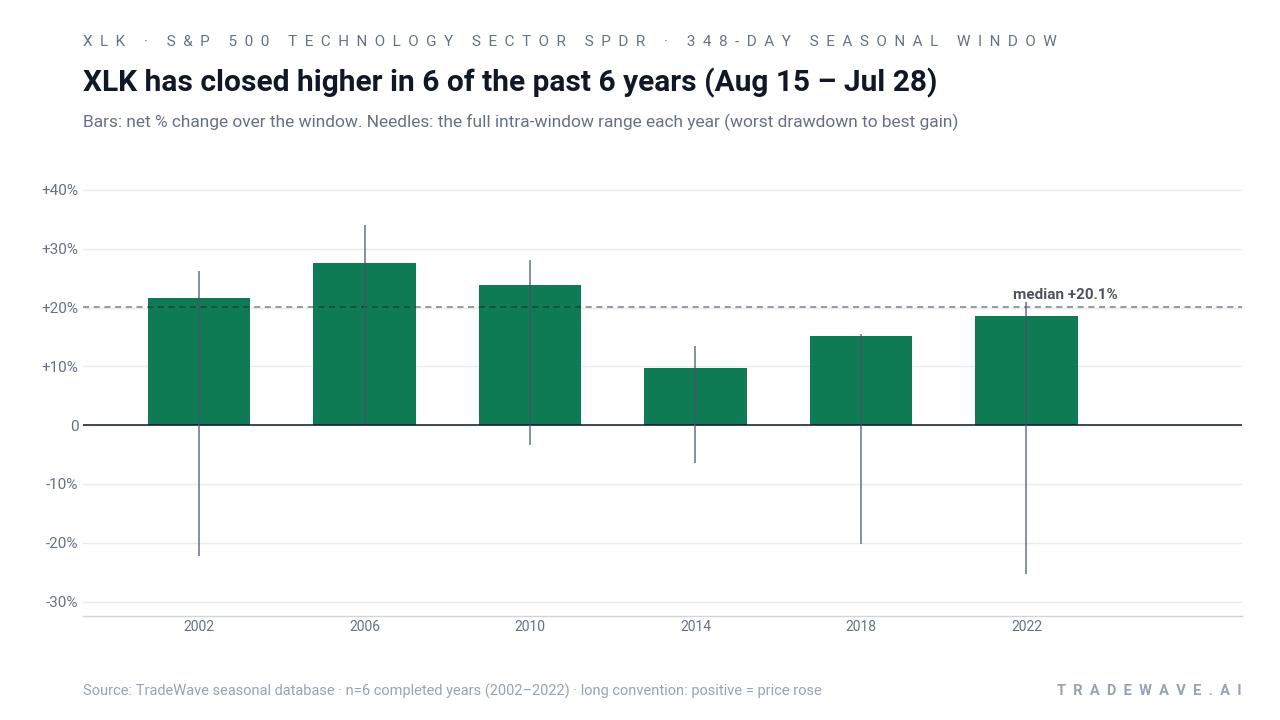
Looking at individual years, the maximum favorable move inside the window has often run ahead of the final net gain, which is what you would expect in a trending but volatile tech tape. In 2006, for example, XLK’s best intraperiod rally reached 33.97% before settling at a 27.57% gain by Jul 28, while in 2022 the ETF’s peak run-up of 20.89% finished as an 18.54% net advance. On the downside, the worst intraperiod drawdowns have been non-trivial: 2002 and 2022 both saw adverse moves of more than 20% from the entry point at some stage in the window, even though they ultimately closed higher.
That mix of strong average gains, a 100% win rate and sizable intraperiod swings is what drives the relatively high TradeWave Ratio of 2.46 and a Sharpe ratio of 2.45 for this pattern. It tells you that historically, when this midterm-year window has moved, it has tended to move a long way in the long direction, but not without testing conviction along the route.
History does not guarantee future results; adverse excursions can be large even in winning windows, and past midterm-year behavior may not repeat in the next cycle.
Why does S&P 500 Technology Sector SPDR (XLK) follow this seasonal pattern?
One likely driver is the way the presidential election cycle shapes policy risk and liquidity for growth stocks. Midterm years often bring a wave of legislative noise and regulatory proposals early on, followed by a clearer policy path and more supportive risk appetite as investors look ahead to the pre-election year, which has historically been strong for equities. For tech specifically, analysts have pointed to the clustering of major product cycles, capital spending plans and index rebalancing in the back half of midterm years as additional forces that can reinforce this XLK seasonal trend.
What is driving S&P 500 Technology Sector SPDR (XLK) today?
In the near term, XLK is digesting a 2.51% one-month pullback against a backdrop of elevated valuations and ongoing debate about how far the Federal Reserve will go in its next policy steps. The ETF is trading below its 50-day moving average of 183.06 and sits between a 52-week low of 63.28 and a 52-week high of 198.26, a range that reflects just how far large-cap tech has run in this cycle. With no single earnings date or macro headline dominating the tape, flows into and out of broad tech exposure have been driven more by positioning and rate expectations than by stock-specific news, leaving XLK in a consolidation phase ahead of the next catalyst.
The chart below situates the latest consolidation against XLK’s past year of trading and a historical seasonal projection for the coming weeks.
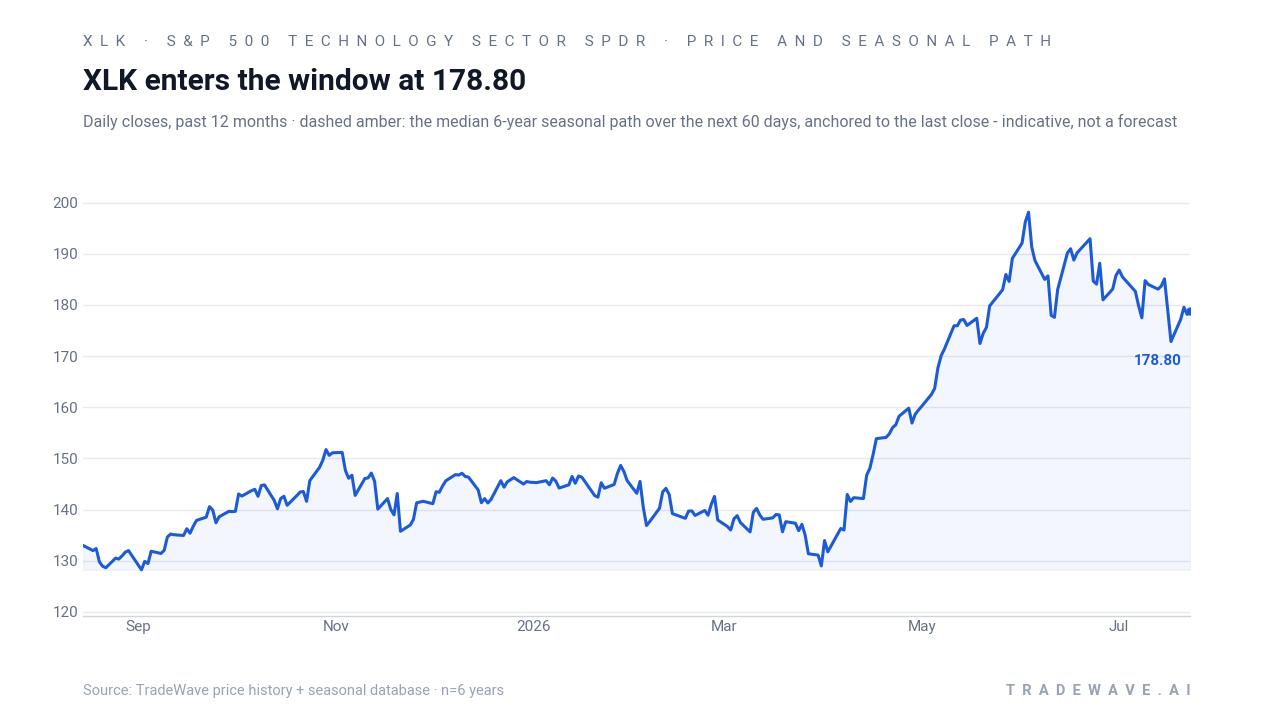
For traders, the key question is how this cooling phase into late summer will intersect with the historically strong Aug 15–Jul 28 midterm-year window. If XLK continues to base below its 50-day moving average into the start of the window, the historical pattern suggests there has often been ample room for both drawdowns and subsequent rallies over the following 11 months. Conversely, if tech re-accelerates ahead of the window, the same history shows that strong starting points have not prevented further gains, but they have sometimes amplified the size of intraperiod pullbacks along the way.
What should traders watch as this XLK seasonal window approaches?
First, watch how XLK behaves around the Aug 15 entry date relative to its 50-day moving average and the 180–190 price zone that has acted as a recent pivot. A decisive break higher into the window would align with the historical long bias, while a deeper pullback would echo prior midterm years where the ETF endured double-digit drawdowns before finishing higher. Second, monitor macro catalysts tied to the policy calendar, including any shifts in rate expectations or tech-focused regulation, since those have often been the sparks for volatility inside this window. Finally, track whether XLK’s leadership versus the broader S&P 500 strengthens or fades as the window unfolds; in past cycles, sustained outperformance by tech has been a hallmark of the stronger seasonal years, while lagging relative strength has tended to coincide with the lower end of the historical return range.
Sources
About this seasonal analysis
Seasonal pattern data is sourced from TradeWave.ai, which analyzes historical price behavior across annual calendar windows going back up to 30 years. Read the full data methodology or the book The 100-Year Pattern by Afshin Moshrefi (2026 edition). Past performance of seasonal patterns does not guarantee future results. This article is for informational purposes only and does not constitute investment advice.