100% Win Rate: S&P 500 SPDR (SPY) Nears Midterm Stretch Averaging 15.07% Gains
S&P 500 SPDR is nearing a 363-day midterm-election seasonal window that has never posted a loss in this dataset, giving traders a structured backdrop as they weigh inflation, Fed policy and earnings.

What is the seasonal pattern for S&P 500 SPDR (SPY)?
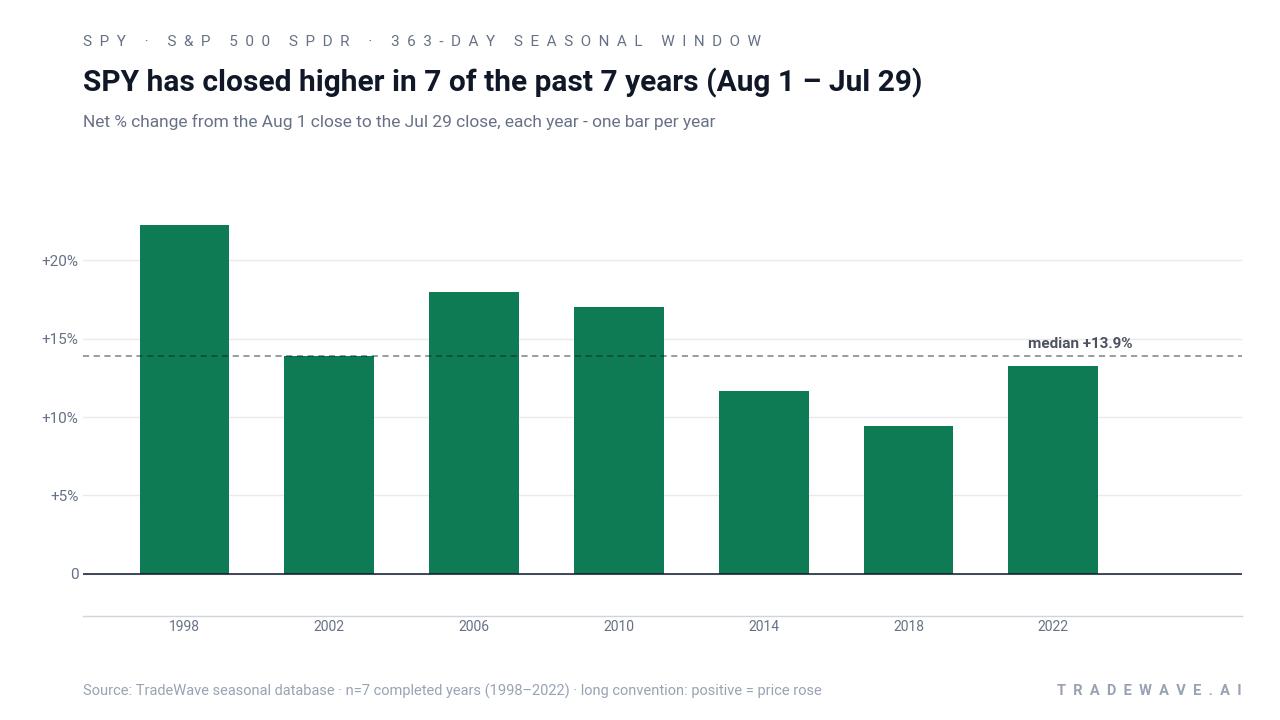
S&P 500 SPDR has risen in 7 of 7 midterm-election-year windows starting around Aug. 1, with an average gain of 15.07% in winning years.
- 7 for 7 in this window, with winning years averaging 15.07% gains across the last seven midterm election cycles.
- Seasonal window begins Aug. 1 and runs 363 trading days, spanning the late midterm year into the following pre-election year.
- Percent Profitable is 100%, with 7 winners and 0 losers in this S&P 500 SPDR trading window.
- Median profit of 13.88% and cumulative return of 165% show a consistently bullish SPY seasonal trend in this regime.
- Maximum favorable moves inside the window have reached roughly 9% to 29% in individual years, while adverse excursions have at times pushed near 17% drawdowns.
- Trade Direction is long, with a Sharpe ratio of 2.58 and a TradeWave Ratio of 2.03, pointing to strong risk-adjusted returns in prior cycles.
According to historical data from TradeWave.ai, this upcoming stretch for S&P 500 SPDR has behaved very differently from an average year on the calendar. The next section walks through how that pattern has played out across past midterm election cycles.
How has S&P 500 SPDR (SPY) traded in this midterm-to-pre-election window?
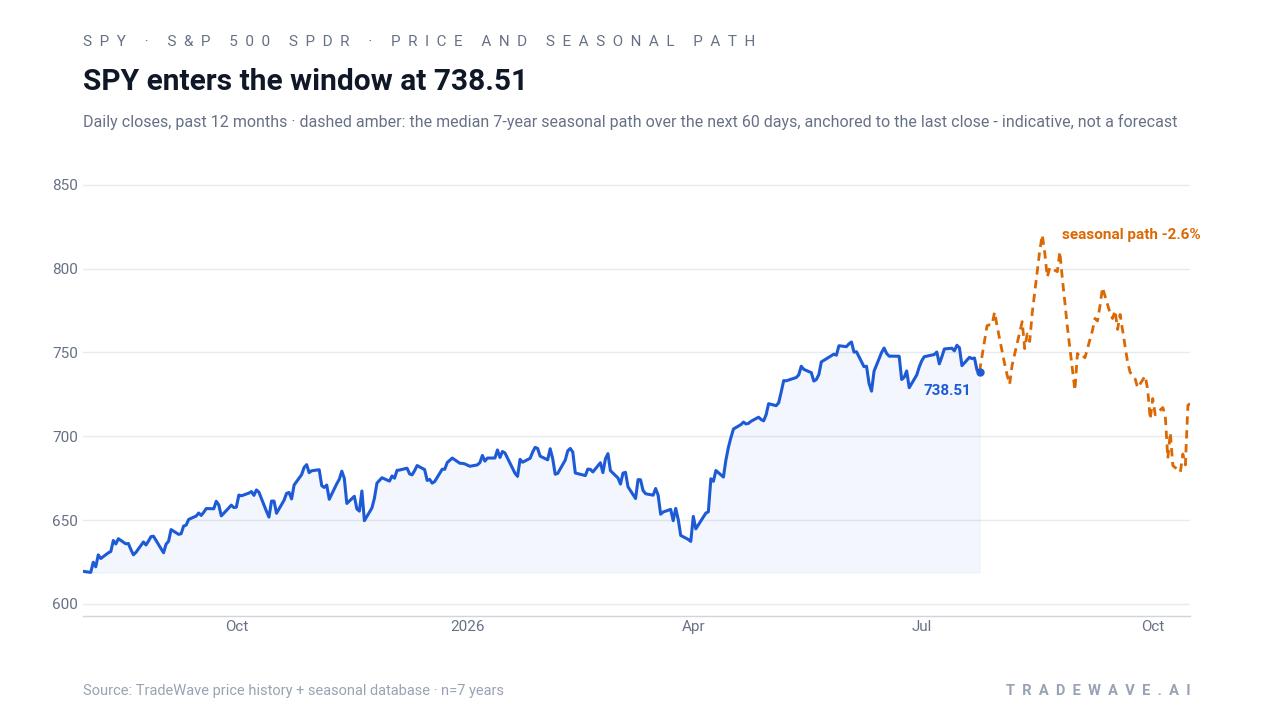
S&P 500 SPDR has posted gains in all seven midterm-election-year windows that start around Aug. 1 and run roughly a full year, averaging 15.07% in those winning stretches. The new 363-day window is set to begin on Aug. 1, 2026, with SPY trading between a 52-week low near 605.79 and a high around 756.50, a range that frames how much room the ETF has historically had to run or retrace in this regime.
The presidential election cycle matters here because this window sits in the heart of the midterm year and then runs deep into the year before the presidential election, a phase that has often coincided with policy clarity, steadier Fed signaling and improving risk appetite. Grouping only those midterm years together strips out noise from other parts of the four-year cycle and shows how SPY has behaved when Washington and Wall Street have been in this specific part of the policy calendar.
Across the seven midterm-election-year samples since the late 1990s, S&P 500 SPDR has delivered a cumulative 165% gain in this 363-day window, with an annualized return of 15.0%. Every single iteration has finished positive, from a 9.46% advance in 2018 to a 22.24% surge in the 1998–1999 window, which is why the Percent Profitable metric sits at 100% with 7 winners and 0 losers.
The average winner gain of 15.07% comes with a median outcome of 13.88%, so the typical year has not relied on one or two outliers. Even the softer years in this SPY seasonal trend, such as 2014’s 11.64% and 2022’s 13.27%, still cleared double digits, while stronger cycles like 2006 and 2010 posted returns near 18%.
Inside the window, the path has not been a straight line. Maximum favorable moves, which capture the best point-to-peak rally from the entry, have ranged from about 9.74% in 2018 to 29.37% in 1998, showing that SPY has often pushed well beyond its final gain before consolidating. Maximum adverse moves, the worst drawdowns from the starting point, have at times been deep, including intraperiod drops of roughly 16.86% in 1998, 15.9% in 2018 and 14.91% in 2022.
That mix of strong finishes and sizable swings is reflected in the TradeWave Ratio of 2.03, which measures how far price typically travels in the trade direction within the window, and a Sharpe ratio of 2.58 based on end-of-window outcomes. The combination points to a historically favorable long setup that has still demanded a tolerance for volatility along the way.
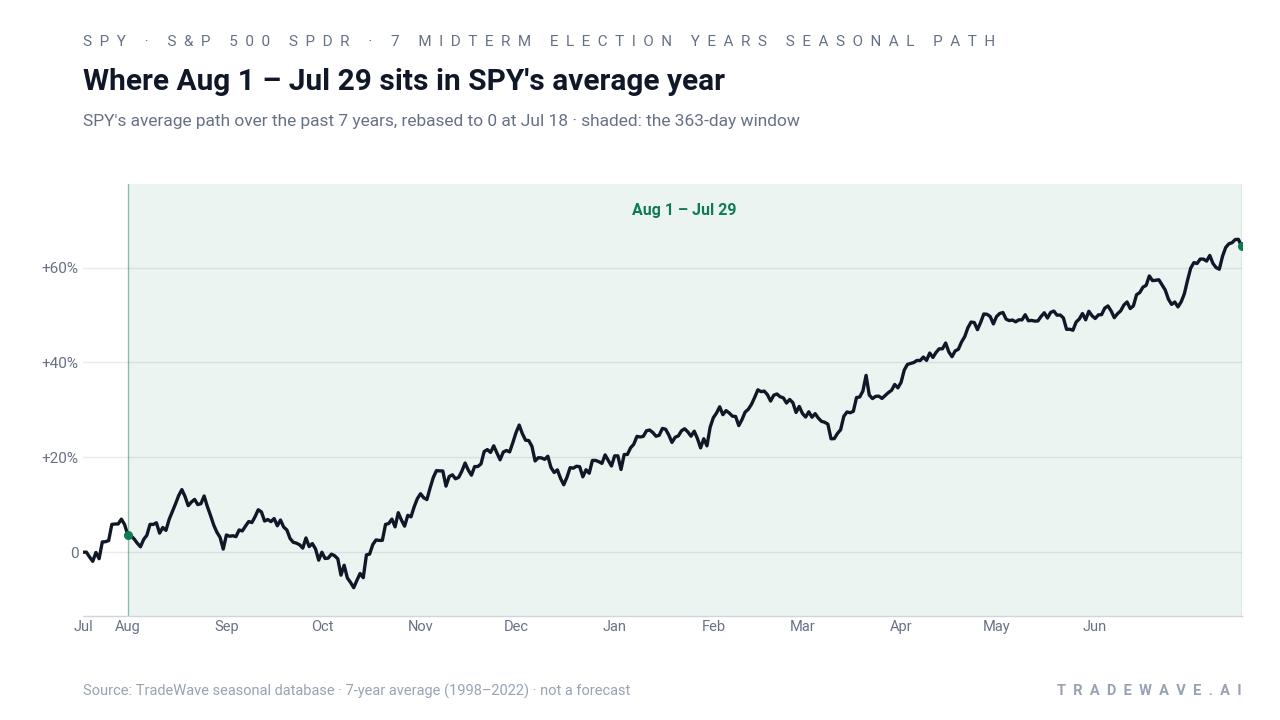
The historical seasonal average curve for this SPY trading window slopes higher in a relatively steady fashion, with gains accruing across much of the period rather than clustering in a single month. That profile is consistent with a regime that begins late in the midterm year and then overlaps the historically strong midterm-to-pre-election “100-Year Pattern” stretch, where the S&P 500 has often advanced as policy uncertainty fades and growth expectations stabilize.
Year-by-year net returns and intraperiod swings show how upside and downside have coexisted inside this bullish window.
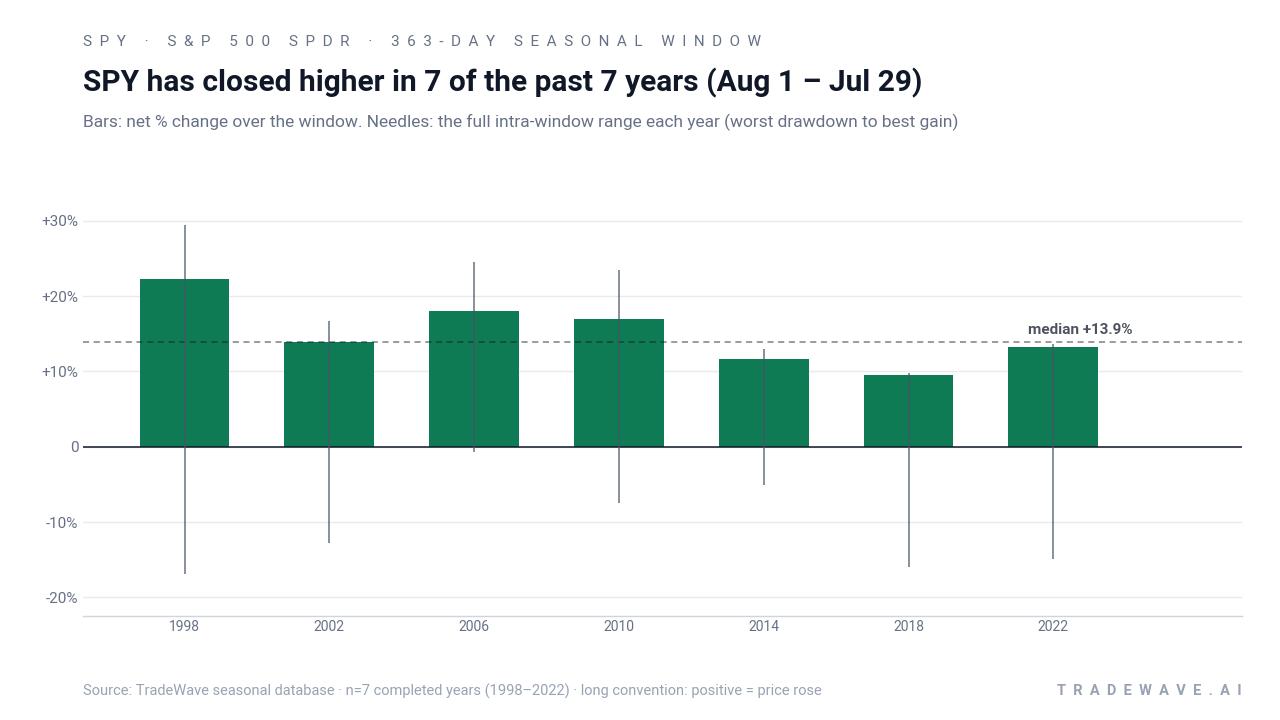
The stacked view of net returns, best rallies and worst drawdowns makes the trade-off clear: every year finished higher, but several saw double-digit pullbacks before the gains stuck. In 1998 and 2018, for example, SPY endured intraperiod drops of roughly 17% and 16% even as the window ultimately closed with strong profits, a reminder that this historically bullish stretch has not been low-volatility.
History does not guarantee future results; adverse excursions can be large even in winning windows, and traders should size risk with those past drawdowns in mind.
Why does S&P 500 SPDR (SPY) follow this seasonal pattern?
One likely driver is the way the policy and earnings calendar lines up in the midterm-to-pre-election phase. By late in the midterm year, mid-cycle fiscal and regulatory shifts are usually clearer, while the Federal Reserve often has more visibility on inflation and growth, which can support risk-taking. This pattern may also reflect institutional portfolio rebalancing and sector rotation as managers position for the historically strong year before the presidential election, when corporate earnings and consumer spending have often been on firmer footing.
What is driving S&P 500 SPDR (SPY) today?
With the next seasonal window still ahead, near-term trading in S&P 500 SPDR is being steered more by macro data and Fed expectations than by the calendar. Investors are watching the Core PCE Price Index for clues on inflation and the pace of any policy easing, a key input for equity valuations and broad ETFs like SPY.[1] A weaker-than-expected jobs report earlier in the year shifted market dynamics by pulling down rates and the dollar alongside stocks, underscoring how quickly macro surprises can ripple through the benchmark.[2]
Strategists at BMO have argued that anticipated Federal Reserve rate cuts could extend the U.S. bull market but with more muted gains, a backdrop that fits with a mature cycle where SPY’s returns may lean more on earnings growth than on multiple expansion.[3] Technical work on the S&P 500 has flagged mixed but at times bullish signals, with attention on whether recent ranges resolve into a fresh uptrend or a deeper consolidation, a decision point that will shape how traders treat any upcoming seasonal tailwind.[8]
The chart below situates the latest moves in SPY within its recent 12-month range and overlays a short-term seasonal projection.
What should traders watch as this SPY seasonal window approaches?
First, the macro calendar: Core PCE, jobs data and any shifts in Fed communication will set the tone for risk appetite as the Aug. 1 window opens, especially if they alter the path of expected rate cuts.[1][2][3] Second, price behavior around the current 52-week band between roughly 605.79 and 756.50 will matter; a breakout or breakdown into the window would either reinforce or fight the historical bullish pattern.
Third, watch how SPY trades around key technical levels highlighted in recent S&P 500 analysis, since a decisive move out of the current range could either amplify the seasonal tailwind or blunt it.[8] Finally, as the window progresses, behavior inside the regime will be telling: a market that shrugs off typical midterm-year volatility and grinds higher would echo the historical pattern, while a failure to hold rallies or an unusually deep drawdown would signal that this cycle is diverging from the last seven.
Sources
About this seasonal analysis
Seasonal pattern data is sourced from TradeWave.ai, which analyzes historical price behavior across annual calendar windows going back up to 30 years. Read the full data methodology or the book The 100-Year Pattern by Afshin Moshrefi (2026 edition). Past performance of seasonal patterns does not guarantee future results. This article is for informational purposes only and does not constitute investment advice.