Nasdaq QQQ Invesco ETF (QQQ) Trades 4.7% Off Highs as Motley Fool Flags Long-Term Upside
Nasdaq QQQ Invesco ETF is entering a historically powerful 355-day midterm-year window even as the tech-heavy ETF trades about 4.7% below its 52-week high after a modest Nasdaq-100 pullback.

What is the seasonal pattern for Nasdaq QQQ Invesco ETF (QQQ)?
Nasdaq QQQ Invesco ETF has risen in 6 of 6 midterm-year cycles during this Jul 28 to Jul 17 window, with an average gain of 24.39% in winning years.
- 6 for 6 in this window, with QQQ posting gains every time and averaging 24.39% in winning years.
- The seasonal window runs 355 days from Jul 28 to Jul 17 and is drawn from the last 6 midterm election years.
- Percent Profitable is 100%, with 6 winners and 0 losers across the historical sample.
- Median profit of 25.16% and annualized return of 24.12% point to a consistently strong long-side seasonal trend.
- The TradeWave Ratio of 2.25 indicates QQQ has typically traveled meaningfully in the trade direction within the window, even before final outcomes.
- A Sharpe ratio of 2.31 for this pattern signals unusually strong risk-adjusted returns compared with typical ETF behavior.
According to historical data from TradeWave.ai, this midterm-year stretch has behaved very differently from an average calendar year for QQQ, with a distinct long-side bias that shows up across multiple cycles.
How has Nasdaq QQQ Invesco ETF (QQQ) traded in this midterm-year window?
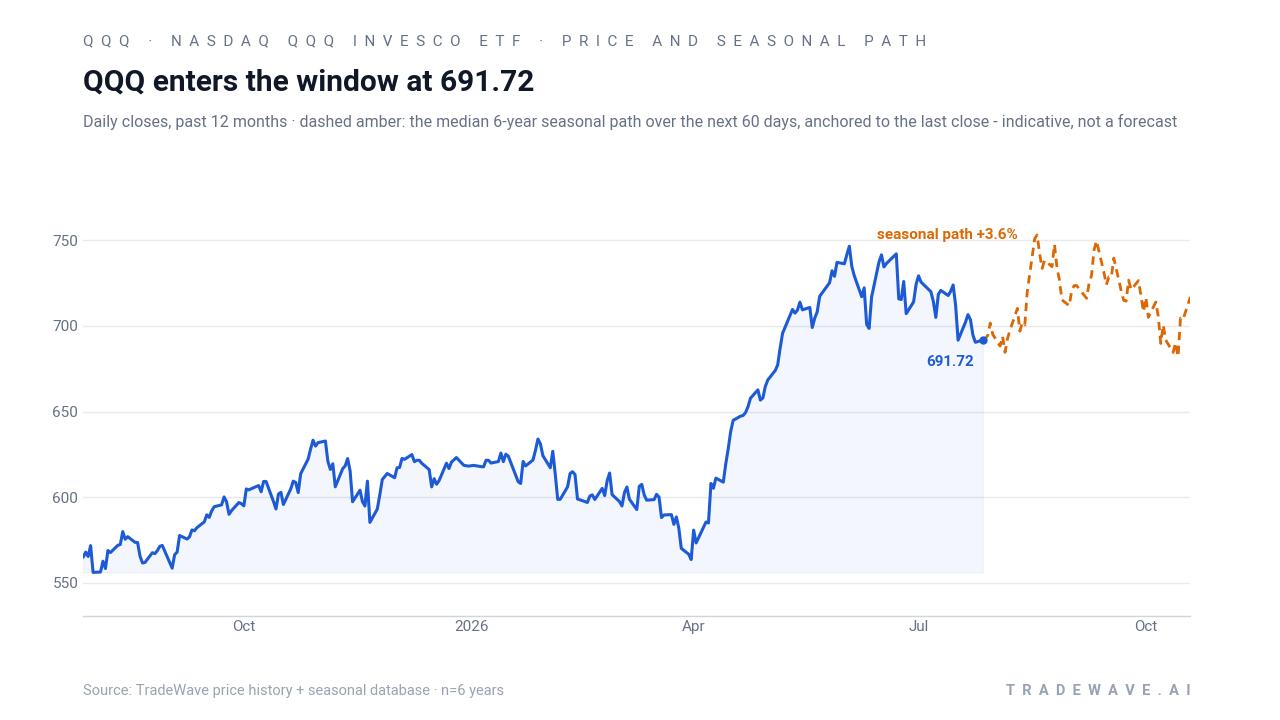
Nasdaq QQQ Invesco ETF has closed higher in every one of the last 6 midterm election years during the Jul 28 to Jul 17 window, averaging a 24.39% gain and compounding to a 265% cumulative return across those cycles. QQQ finished the prior session at 691.72 and trades around 713.43 on Jul 28, about 4.7% below its 52-week high of roughly 747 and well above its 52-week low near 546, leaving it closer to the top of its recent range as the new seasonal regime begins.
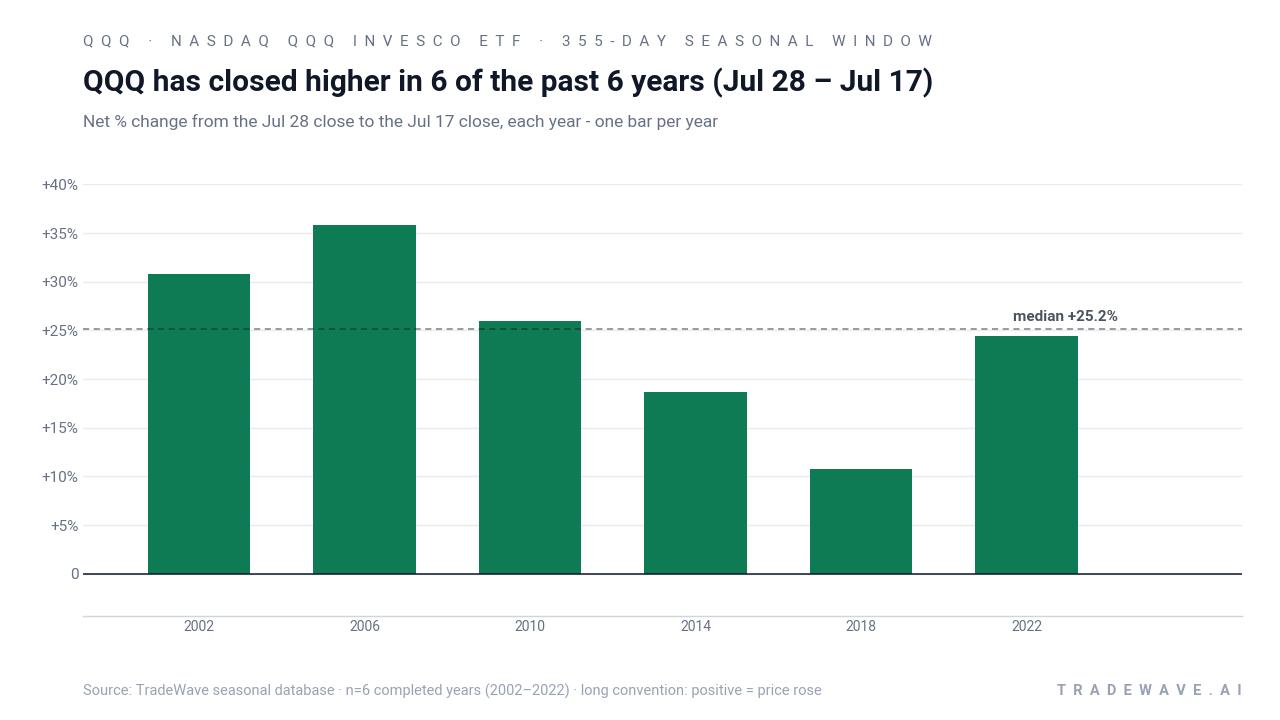
Grouping the data by the presidential election cycle matters here because this window captures the handoff from the midterm election year into the year before the presidential election, a phase that has often coincided with clearer policy visibility and a friendlier liquidity backdrop for growth stocks. In this pattern, the calendar phase is the midterm election year, and the lookback covers the last 6 midterm cycles, so the results reflect how QQQ has behaved in this specific political and macro context rather than in random years.
Across those 6 midterm-year windows, every single one produced a positive net return for a long position, with individual gains ranging from 10.72% in 2018 to 35.79% in 2006. The median profit of 25.16% sits close to the average, which suggests the wins have not been driven by a single outlier year but by a cluster of strong outcomes. Add it up: stacking this same 355-day slice across the six midterm cycles compounds to roughly 265% cumulative gains.
The intraperiod path has not been a straight line. In 2002, QQQ’s best point-to-peak move within the window, or maximum favorable excursion, reached 37.43%, but the worst drawdown from entry, or maximum adverse excursion, hit -17.08% before the ETF finished up 30.84%. In 2022, the pattern repeated with a 24.67% best run-up and a -17.78% worst drawdown, underscoring that even winning years have featured double-digit pullbacks inside the window.
Other years show a smoother ride. In 2006, QQQ’s best intraperiod gain of 35.98% came with only a -2.29% worst drawdown, and in 2014 the ETF never fell more than -6.53% below the entry while still finishing the window up 18.64%. That mix of high maximum favorable moves and sometimes deep maximum adverse moves is what drives the TradeWave Ratio of 2.25, which captures how far price typically travels in the trade direction within the window independent of the final close.
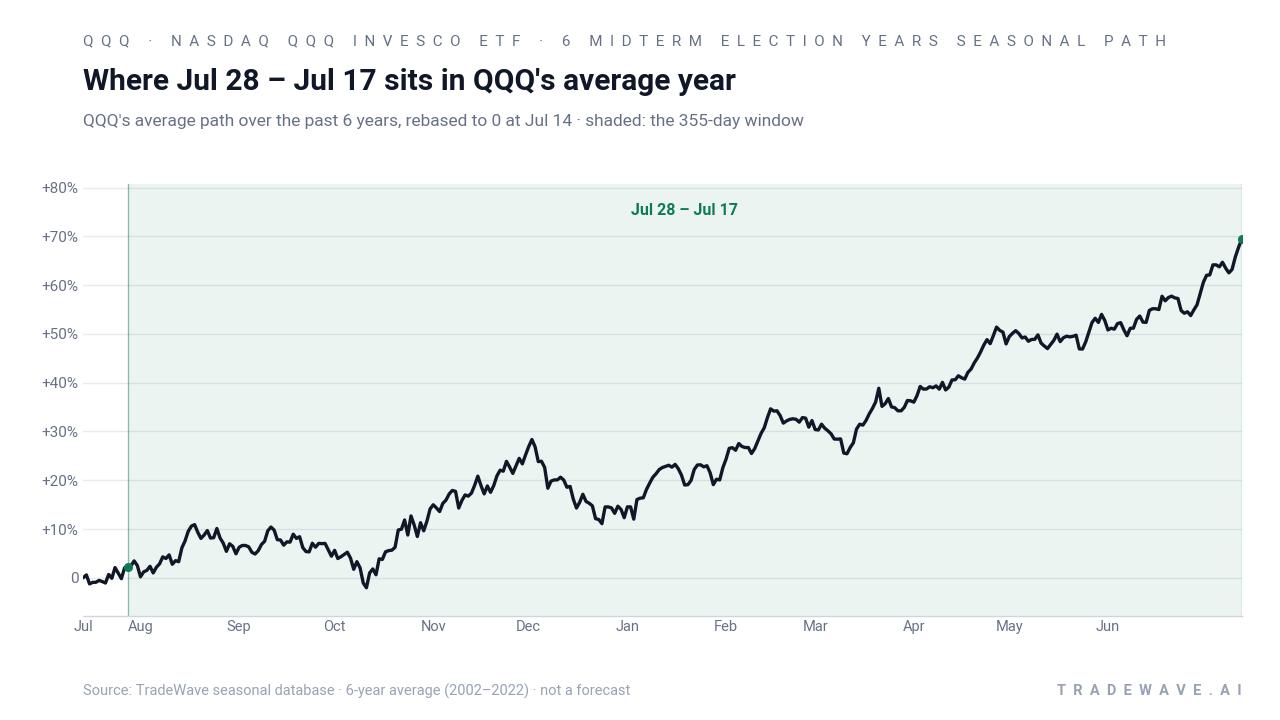
A second view shows how each year’s net result sits inside its full intraperiod range of rallies and pullbacks.
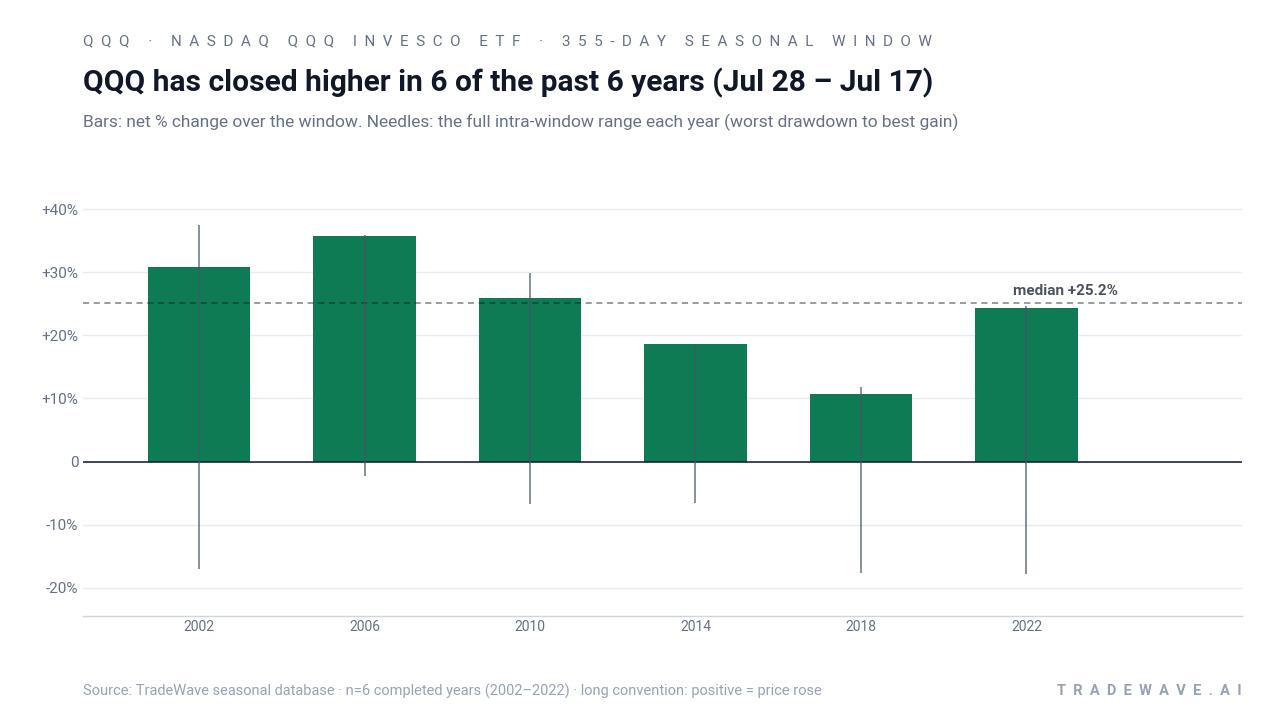
Across the sample, the bars-and-needles profile shows that QQQ has tended to spend much of the window above the entry level, with maximum favorable moves often in the high teens to mid-30s, while maximum adverse moves have usually stayed in the mid-single to mid-teens. The Sharpe ratio of 2.31 for this pattern reflects that the strong average gains have come with volatility that, while real, has been rewarded historically for long exposure in this specific midterm-year slice.
History does not guarantee future results; adverse excursions can still be large inside the window even when the final outcome has been positive in every past cycle.
Why does Nasdaq QQQ Invesco ETF (QQQ) follow this seasonal pattern?
One likely driver is the way the presidential election cycle shapes policy expectations and risk appetite for large U.S. technology stocks. Analysts often point to midterm-year volatility followed by a more supportive backdrop as fiscal and regulatory paths become clearer heading into the year before the presidential election, which has historically favored growth-heavy benchmarks like the Nasdaq-100. This pattern may also reflect institutional portfolio rebalancing and sector rotation into tech as earnings visibility improves and macro uncertainty tied to the election calendar begins to fade.
What is driving Nasdaq QQQ Invesco ETF (QQQ) today?
QQQ slipped 1.62% to around 713.43 on Jul 28, leaving it about 4.7% below its 52-week high near 747 and well above its 52-week low around 546, after a modest Nasdaq-100 pullback that some strategists have framed as a pause in a longer tech uptrend rather than a regime change.[1] A recent analysis highlighted that QQQ was roughly 3% below its all-time high earlier in July and argued that past Nasdaq-100 drawdowns of this size have often been followed by multi-year recoveries, especially given the ETF’s heavy exposure to mega-cap technology leaders.[1] The same piece noted trading volume around 4.2 million shares on the day of that discussion, a reminder that even shallow dips in QQQ tend to attract active positioning from both retail and institutional investors.[1]
The chart below situates the latest move against the past year of trading and a historical seasonal projection for the next two months.
What should traders watch in this QQQ seasonal window?
First, the calendar itself matters: this 355-day stretch bridges the back half of the midterm election year into the year before the presidential election, a phase that has historically lined up with stronger risk appetite for growth and tech. Traders will be watching whether QQQ respects that historical seasonality by grinding higher on dips, or whether any break below the recent 52-week low zone would mark a clear departure from the pattern.
Second, levels around the prior 52-week high near 747 and the recent entry area around 691.72 are likely to act as reference points. In past cycles, the strongest years in this window saw QQQ push to new highs relatively early and then build on those gains, while weaker but still positive years featured deeper drawdowns before recovering. How QQQ behaves on tests of those bands over the next few months will offer a real-time check on whether the historical midterm-year seasonal trend is reasserting itself.
Third, traders should keep an eye on participation and liquidity. Earlier in July, QQQ’s roughly 3% pullback from its all-time high came with active trading and commentary that framed the move as a potential buying opportunity rather than the start of a prolonged bear phase.[1] If similar dips during this window continue to draw in volume rather than trigger forced selling, that would be more consistent with the 6-for-6 historical pattern of eventual gains.
Finally, the macro and policy calendar will be key. The midterm election year often brings bouts of volatility around rate expectations, regulation and fiscal debates, but the historical record for this specific window suggests that once those shocks are absorbed, QQQ has tended to emerge higher by the time the year-before-election phase is in full swing. Traders will be watching whether upcoming data releases, central bank meetings and policy headlines reinforce that script or challenge it, and whether any deviation shows up first in the intraperiod drawdowns that have been a recurring feature of this otherwise bullish seasonal trend.
Sources
About this seasonal analysis
Seasonal pattern data is sourced from TradeWave.ai, which analyzes historical price behavior across annual calendar windows going back up to 30 years. Read the full data methodology or the book The 100-Year Pattern by Afshin Moshrefi (2026 edition). Past performance of seasonal patterns does not guarantee future results. This article is for informational purposes only and does not constitute investment advice.