S&P 500 Healthcare Sector SPDR (XLV) Has Never Finished Lower in This Jul 30-Nov 30 Window
S&P 500 Healthcare Sector SPDR is approaching a midterm-year Jul 30–Nov 30 window that has never finished lower in the past six cycles, just as the ETF trades near its 52-week high and bullish options flow builds.

What is the seasonal pattern for S&P 500 Healthcare Sector SPDR (XLV)?
S&P 500 Healthcare Sector SPDR has risen in 6 of 6 midterm-year Jul 30–Nov 30 windows, with an average gain of 7.35% in winning years.
- 6 for 6 in this window, with XLV posting gains every midterm-year Jul 30–Nov 30 period in the sample.
- Percent Profitable is 100%, with 6 winners and 0 losers across the last six midterm election years.
- Average profit in winning years is 7.35%, contributing to a 52% cumulative return when the window is stacked across cycles.
- The trade direction is long, and the TradeWave Ratio of 3.11 signals that price has typically traveled meaningfully in the trade direction within the window.
- A Sharpe ratio of 2.13 for this slice of the calendar points to unusually strong risk-adjusted returns compared with typical ETF behavior.
- Individual years have still seen notable intraperiod drawdowns, so the path has not been a straight line even in winning seasons.
According to historical data from TradeWave.ai, this midterm-year stretch has behaved very differently from an average autumn for healthcare stocks, with a clear directional bias that many investors overlook.
How has S&P 500 Healthcare Sector SPDR (XLV) traded in the Jul 30–Nov 30 midterm-year window?
S&P 500 Healthcare Sector SPDR has finished higher in every single midterm-year Jul 30–Nov 30 window in the dataset, averaging a 7.35% gain across six cycles. The ETF is entering this year’s window from a position of strength near its 52-week high of 165.61, after a roughly 1.91% advance over the past month. Options traders have also leaned hard into bullish call structures on XLV, with about 5,300 calls trading against roughly 1,000 puts and $11 million of $13 million in notional tied to calls, a sign that positioning is already skewed toward further upside.[1]
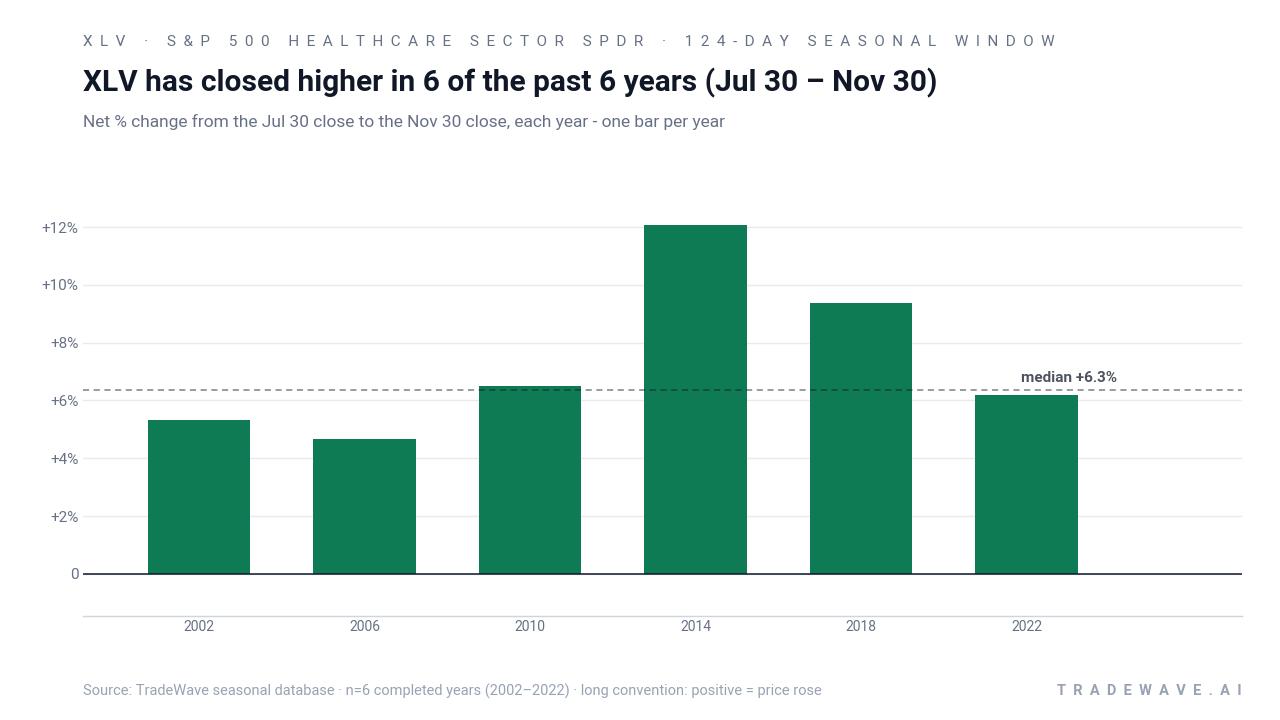
The pattern is built on the last six midterm election years, a phase of the presidential cycle that often features policy uncertainty early in the year and more constructive risk appetite as the calendar moves toward the pre-election year. In this specific 124-day slice from Jul 30 to Nov 30, XLV has historically behaved like a steady grind higher rather than a boom-or-bust trade, with annualized returns of 7.32% and a 52% cumulative gain when the window is compounded across cycles.
Looking at individual years, the weakest outcome in the sample was still a 4.65% gain in 2006, while the strongest was a 12.06% advance in 2014. Those results came with meaningful swings along the way. In 2002, for example, XLV rallied as much as 9.53% at its best point in the window but also saw a 5.05% drawdown from entry at the worst point before finishing up 5.34%. In 2022, the ETF’s net gain of 6.2% masked an 8.36% intraperiod drop from the starting level, underscoring that even “all green” years have required investors to sit through volatility.
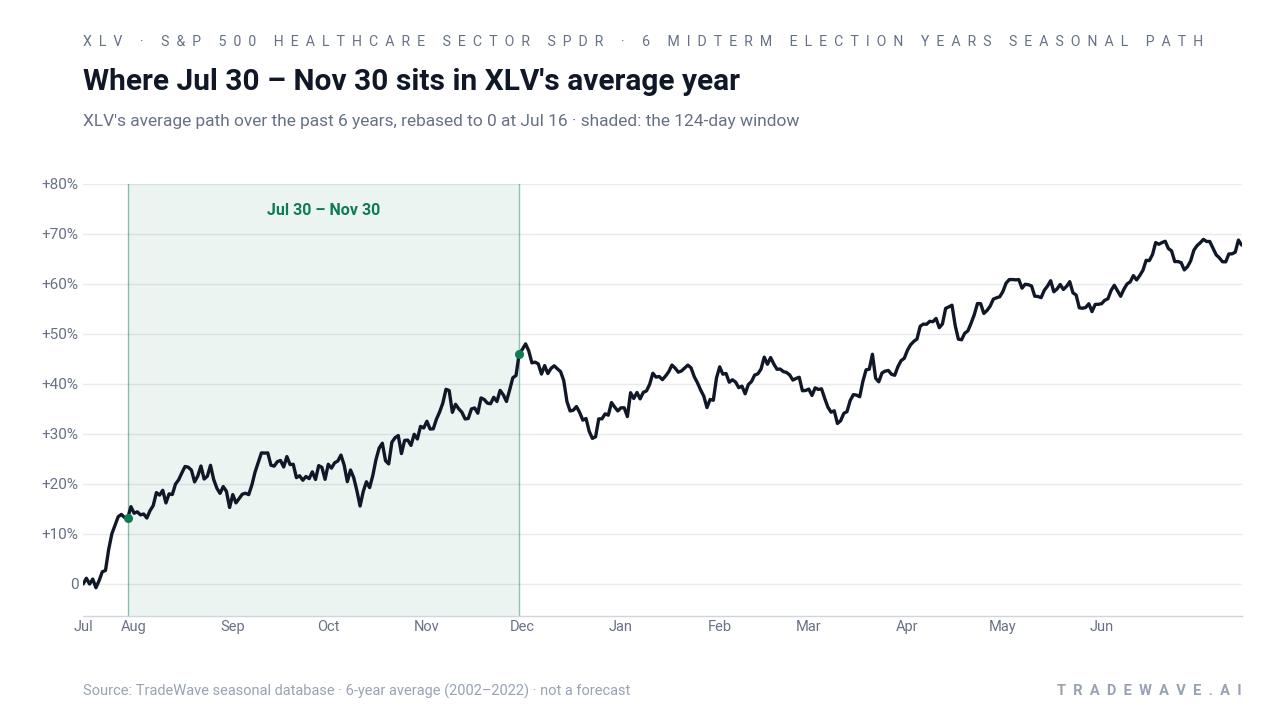
A second view shows how far XLV has typically swung both for and against longs inside this window.
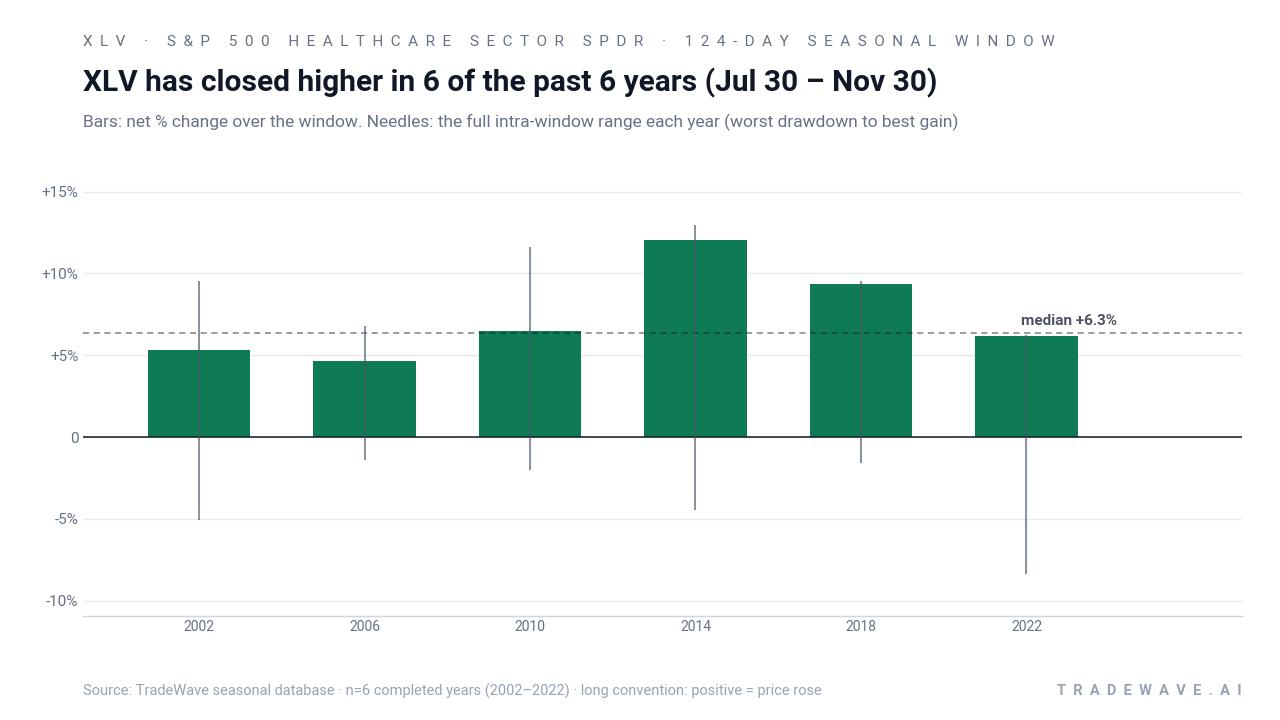
The combined net / range chart shows a consistent pattern: every bar ends above zero, but the needles stretch meaningfully in both directions. Maximum favorable moves have often reached the high single digits or low double digits, while maximum adverse moves have ranged from roughly 1.38% to 8.36%. That mix of solid end-of-window gains and nontrivial drawdowns is what drives the TradeWave Ratio of 3.11 and a Sharpe ratio above 2, signaling that the typical XLV seasonal trend has been upward but not without tests of conviction along the way.
Because this window runs from late July into the heart of the fourth quarter, it also overlaps the broader midterm-to-pre-election regime that has historically been one of the strongest stretches for U.S. equities in Afshin Moshrefi’s 100-year framework. Healthcare’s defensive profile and steady earnings cadence have often made XLV a beneficiary of that pattern, especially when investors rotate toward quality and cash-flow stability late in the cycle.
History does not guarantee future results; even in windows where XLV ultimately finished higher, intraperiod drawdowns have at times been large and fast.
Why does S&P 500 Healthcare Sector SPDR (XLV) follow this seasonal pattern?
One likely driver is the way healthcare earnings and policy news cluster in the back half of midterm election years, when Washington often clarifies regulatory priorities and reimbursement paths. Analysts have also pointed to institutional portfolio rebalancing into defensive growth sectors as the market transitions from the midterm election year into the historically stronger pre-election year. This pattern may reflect that combination of policy visibility and sector rotation, which has tended to favor large-cap healthcare exposure during the Jul 30–Nov 30 window.
What is driving S&P 500 Healthcare Sector SPDR (XLV) today?
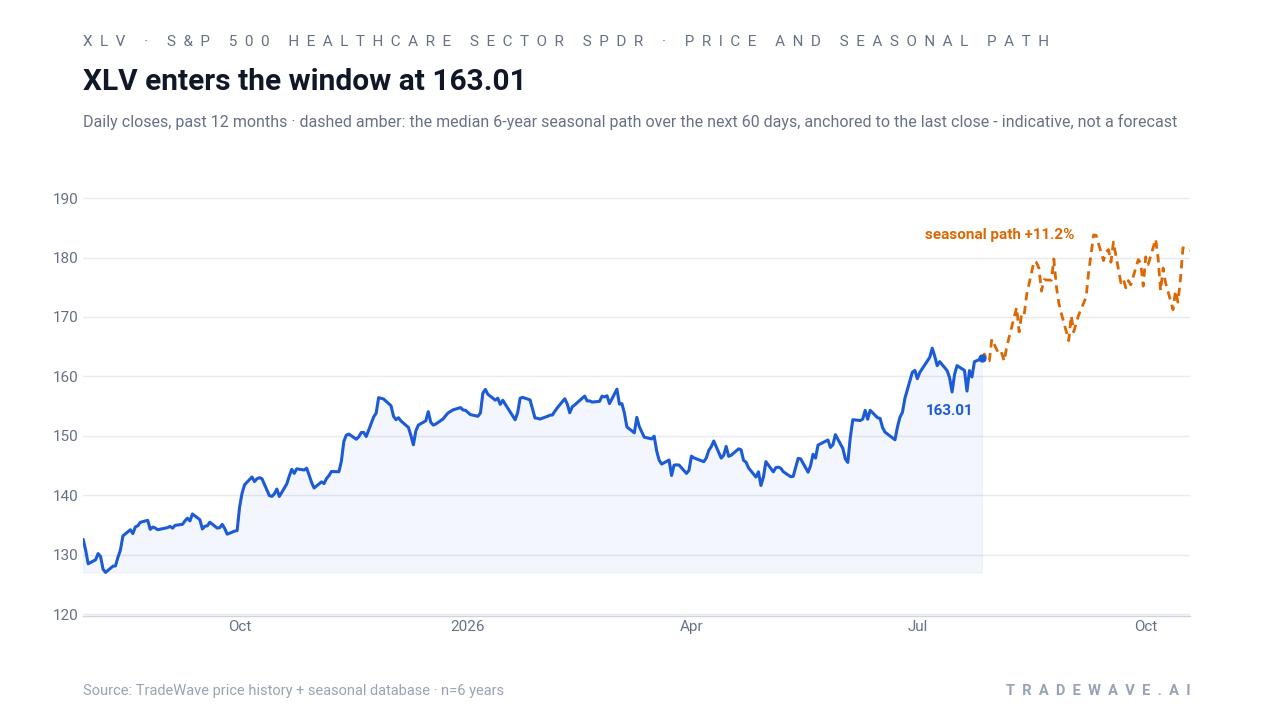
XLV comes into this seasonal window after a powerful run that has left the fund roughly 1.91% higher over the past month and close to its 52-week high of 165.61, with price also sitting comfortably above its 50-day moving average of 154.18 and supported by 20-day average volume near 9.85 million shares. Healthcare has led sector gains in recent periods, with XLV up about 25% from its August low and ranking as the leading S&P 500 sector over one- and three-month horizons, a sign that investors have already been rotating toward the group.[2] Options desks report that roughly $11 million of $13 million in XLV options turnover has been tied to calls, with about 5,300 calls trading versus around 1,000 puts, reinforcing the picture of bullish positioning into the heart of the year.[1]
The chart below shows XLV’s 12-month climb alongside a median 60-day seasonal projection for context.
How does the election cycle shape XLV’s sector outlook?
XLV’s pattern is drawn from the last six midterm election years, a phase that often features tighter financial conditions early on and a gradual easing of policy uncertainty as the calendar advances. In those prior cycles, healthcare leadership into year-end has frequently coincided with investors seeking earnings resilience while still participating in equity upside. With the market currently in a midterm election year and heading toward the year before the presidential election, this Jul 30–Nov 30 window sits at the handoff between two historically distinct playbooks, which may help explain why the XLV seasonal trend has been both consistent and relatively smooth.
What should traders watch in this XLV seasonal window?
For this year’s iteration of the Jul 30–Nov 30 window, the first thing to watch is whether XLV can hold above its 50-day moving average on any pullbacks, given that prior winning years often saw early drawdowns before the trend reasserted. Price behavior around the 52-week high near 165.61 will also matter; a sustained break above that level with volume in line or better than the 20-day average would be more consistent with the historical pattern of mid-window strength. On the positioning side, traders will be watching whether the heavy call skew in XLV options persists or fades; continued dominance of call buying over puts would signal that the bullish flow identified in recent data is still in force, while a reversal toward put demand could mark a shift in sentiment even inside a historically strong seasonal stretch.[1] Finally, any change in healthcare’s leadership role within the S&P 500, especially if the sector slips from its recent top spot over one- and three-month horizons, would be an early sign that this cycle may diverge from the prior six midterm-year playbooks.[2]
Sources
About this seasonal analysis
Seasonal pattern data is sourced from TradeWave.ai, which analyzes historical price behavior across annual calendar windows going back up to 30 years. Read the full data methodology or the book The 100-Year Pattern by Afshin Moshrefi (2026 edition). Past performance of seasonal patterns does not guarantee future results. This article is for informational purposes only and does not constitute investment advice.