Near Record Highs, S&P 500 SPDR (SPY) Enters an Aug 1 Midterm Window With a Perfect Win Record
S&P 500 SPDR is hovering near record territory as it approaches an Aug 1 seasonal window that has never posted a loss across the last seven midterm election years.
What is the seasonal pattern for S&P 500 SPDR (SPY)?
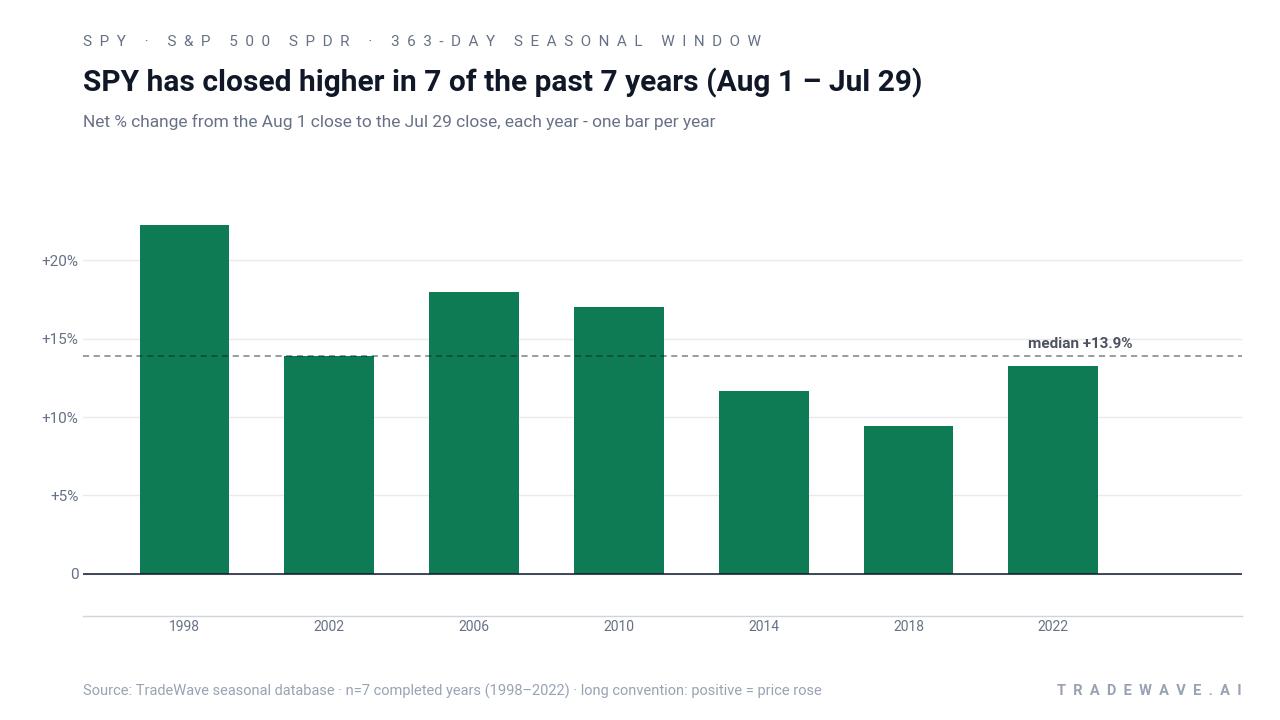
S&P 500 SPDR has risen in 7 of 7 midterm election years during the Aug 1 to Jul 29 window, with an average gain of 15.07% in winning years.
- 7 for 7 in this window, with SPY posting gains every time and averaging 15.07% in winning years.
- Seasonal window runs from Aug 1 through Jul 29, spanning 363 days across the last seven midterm election years.
- Percent Profitable is 100%, with 7 winners and 0 losers in the historical sample.
- Trade Direction is long, supported by a Sharpe ratio of 2.58 and a TradeWave Ratio of 2.03.
- Individual years have seen strong upside bursts, but maximum adverse moves inside the window have still reached double digits in several cycles.
- The pattern sits inside the classic midterm-to-pre-election regime that has historically favored sustained S&P 500 strength.
According to historical data from TradeWave.ai, this upcoming stretch for SPY behaves very differently from an average year, with a distinct midterm-to-pre-election profile that has repeated across multiple cycles.
How strong is the upcoming seasonal window for S&P 500 SPDR (SPY)?
S&P 500 SPDR has closed higher in every single Aug 1 to Jul 29 window across the last seven midterm election years, averaging a 15.07% gain for long positions. The ETF finished the prior session at 739.09, leaving it about 2.3% below its 52-week high of 756.50 and well above its 52-week low of 605.79. That combination of a clean seasonal track record and a market sitting near the top of its range gives this year’s window unusual weight for traders watching the S&P 500 SPDR trading window.
The presidential election cycle matters here because this pattern is built only from midterm election years, then carried forward into the following pre-election year. That aligns the seasonal sample with a specific policy backdrop, where fiscal and regulatory shifts in the midterm election year often give way to a more growth-friendly tone as the next presidential race approaches.
This seasonal window begins on Aug 1 and spans 363 days, covering the late stages of the current midterm election year and most of the year before the presidential election. Historically, during this period, S&P 500 SPDR has shown a strong bullish tendency for long exposure. The trade direction is explicitly long, and every completed window in the sample has finished with a positive net return.
Percent Profitable sits at 100%, with 7 winners and 0 losers across the last seven midterm election years. Average profit in those winning years is 15.07%, while the median outcome is a 13.88% gain, which suggests the SPY seasonal trend has been consistently positive rather than skewed by a single outlier year. Add it up: compounding those windows back to back would have produced a cumulative return of roughly 165% across the sample.
The per-year table shows how that strength has played out in individual cycles. The strongest year in this stock pattern analysis was 1998, when SPY gained 22.24% between the Aug 1 entry and the Jul 29 exit, with a best intraperiod run-up of 29.37% before giving back some ground. The softest outcome was 2018, which still delivered a 9.46% net gain but saw a maximum adverse move of -15.9% at one point inside the window.
Those intraperiod swings are captured in the MFE/MAE profile. Maximum favorable excursions have ranged from roughly 9.7% to 29.4%, showing that in strong years SPY has often pushed well beyond the final close at some point during the window. Maximum adverse excursions have been as shallow as -0.74% in 2006 and as deep as around -16.9% in 1998, which means even winning years have included meaningful drawdowns before the pattern played out.
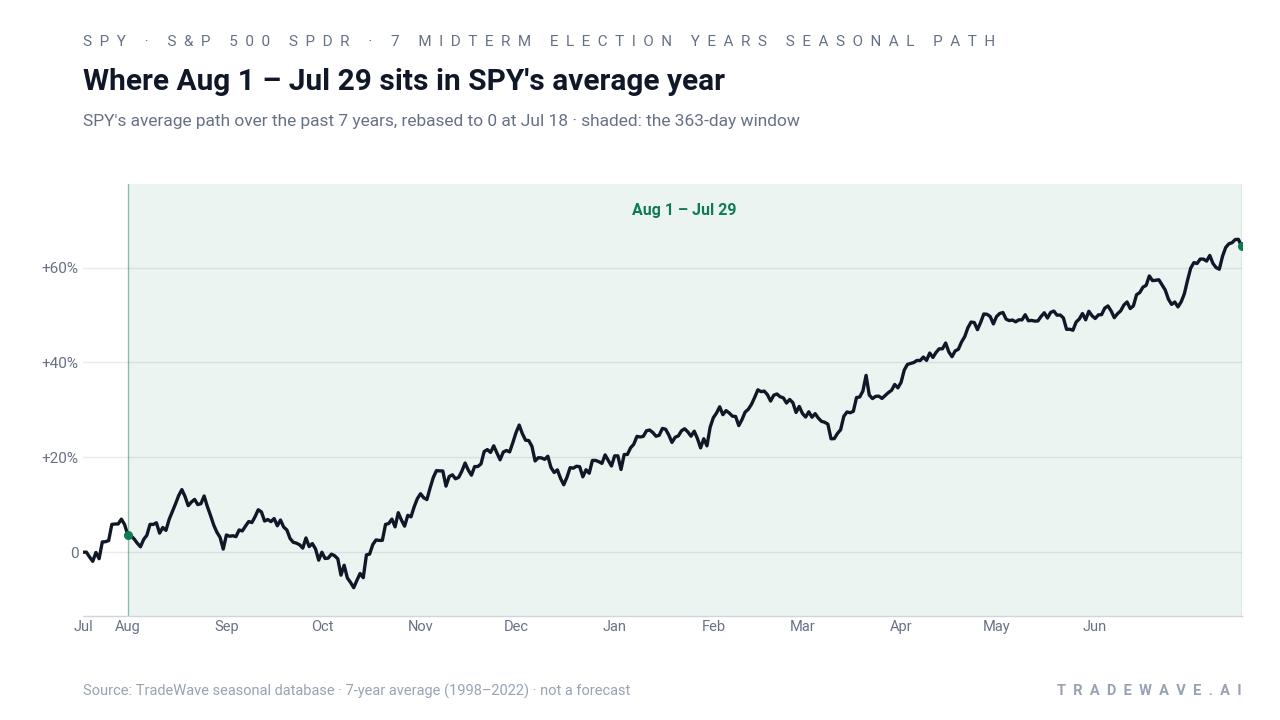
The historical seasonal average suggests that gains tend to build gradually rather than in a single burst. Trend metrics labeled “Trend Long” and “Trend Short” indicate that upside days have outnumbered downside stretches over the full window, but there are pockets where the path has been choppy, especially around macro or policy inflection points late in the midterm election year.
Year-by-year bars with intraperiod ranges show how upside and drawdowns have coexisted inside this bullish window.
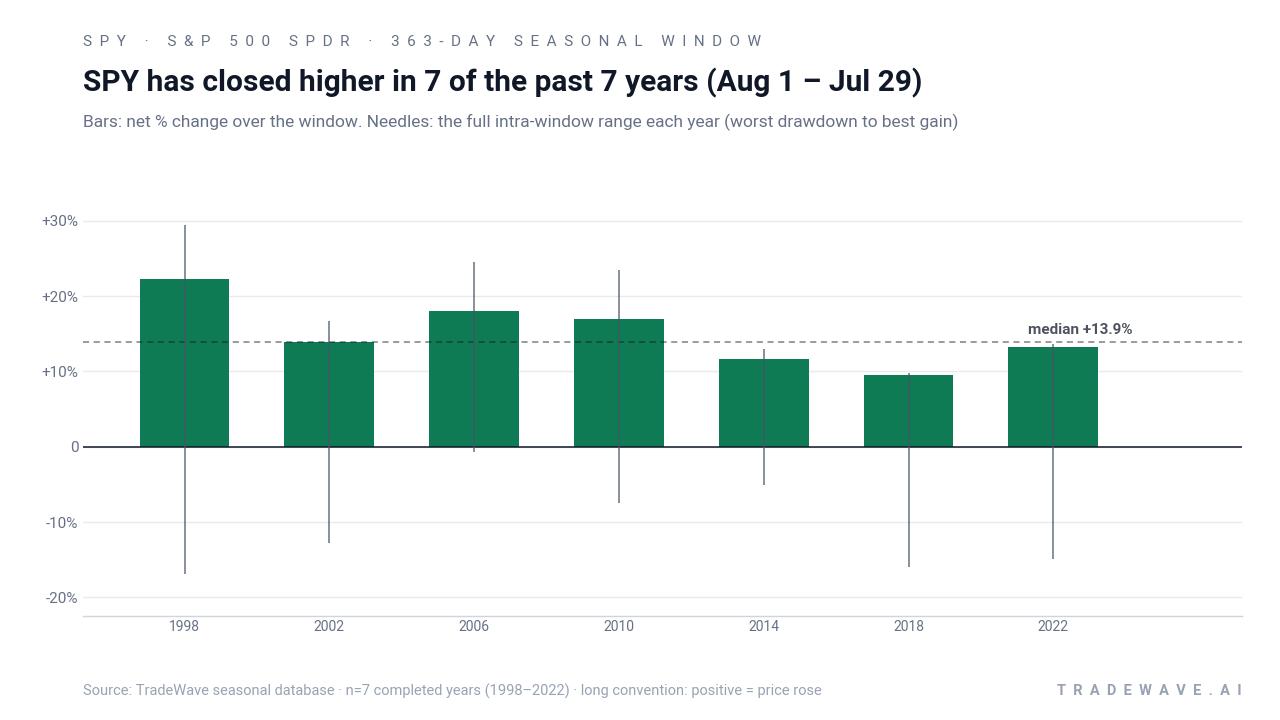
The stacked net, best-case and worst-case moves underline the key message: this has been a powerful long-biased window for SPY, but one that still includes double-digit downside swings along the way. History does not guarantee future results; adverse excursions can be large even in winning windows.
Why does S&P 500 SPDR (SPY) follow this seasonal pattern?
One likely driver is the way the presidential election cycle shapes fiscal policy, regulation and risk appetite, with midterm election years often marking a reset before a more growth-focused pre-election year. Analysts have also pointed to institutional portfolio rebalancing and earnings calendar clustering, which can funnel flows into equities from late summer through the following summer. This SPY seasonal pattern may reflect that combination of policy clarity, improving earnings visibility and steady risk-on positioning as the next presidential race comes into view.
What is driving S&P 500 SPDR (SPY) today?
S&P 500 SPDR ended the prior session at 739.09, up 0.02% on the day and about 22.0% above its 52-week low of 605.79, with a one-month return of 1.39% and 20-day average volume near 46.5 million shares. Recent commentary highlights that investors are leaning on strong second-quarter earnings expectations, with one analysis citing roughly 23% year-on-year growth for S&P 500 profits, helped by AI and data center spending that has powered the technology sector and, by extension, SPY itself.[1] Markets are also weighing the possibility of a 25 basis point Federal Reserve rate hike at the late July FOMC meeting, a backdrop that has kept index-level volatility contained but left traders sensitive to any surprise on policy or guidance.[1]
The chart below situates the latest move in its recent multi-month context alongside the median seasonal path.
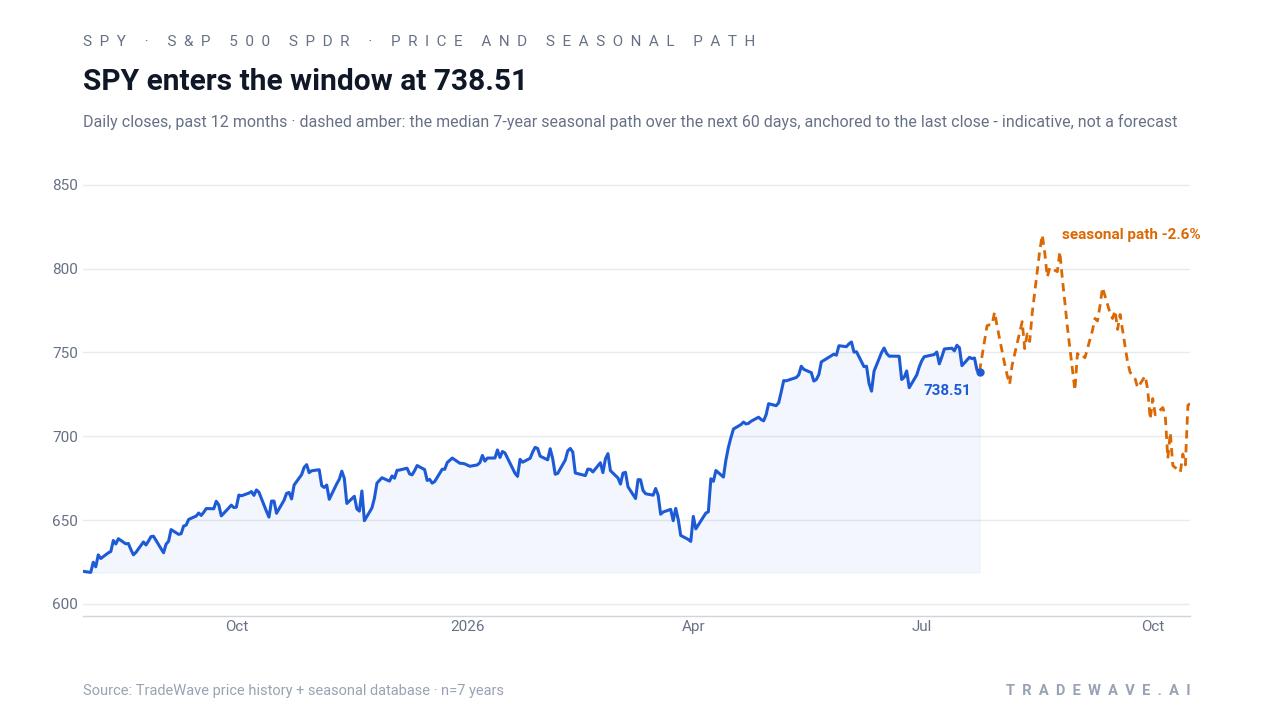
SPY’s role as the flagship S&P 500 ETF means this seasonal setup is systemically important. The ETF is already in a firm uptrend, supported by earnings momentum and AI-driven growth narratives, yet the historical window that opens on Aug 1 has delivered even stronger gains in prior cycles. For traders, the tension between a market that is already elevated and a calendar stretch that has historically rewarded long exposure is the key dynamic to monitor as the midterm election year transitions toward the year before the presidential election.
What should traders watch as this SPY seasonal window opens?
First, the policy calendar: the late July FOMC decision and any guidance on the path of rates will set the tone for how the early part of the window trades, especially if the Fed leans more hawkish or dovish than markets currently expect.[1] Second, earnings breadth: if the projected earnings strength broadens beyond mega-cap technology and AI beneficiaries, it would rhyme with prior midterm-to-pre-election windows where gains were supported by wider participation rather than a narrow leadership group.[1]
Third, price levels: on the upside, traders will be watching how SPY behaves as it approaches and potentially tests the 52-week high near 756.50, while on the downside, any pullback that starts to resemble the double-digit intraperiod drawdowns seen in years like 1998 and 2018 would still be consistent with the historical pattern, even if the window ultimately finishes higher. Finally, behavior inside the window will be the real tell: if SPY grinds higher with contained drawdowns, it would echo the smoother years in the sample, whereas a sharp early selloff followed by a recovery would mirror the more volatile cycles. Either way, the Aug 1 to Jul 29 stretch has been one of the most consistently positive slices of the calendar for SPY, and how the ETF trades through it will offer a live test of this long-running seasonal trend.
Sources
About this seasonal analysis
Seasonal pattern data is sourced from TradeWave.ai, which analyzes historical price behavior across annual calendar windows going back up to 30 years. Read the full data methodology or the book The 100-Year Pattern by Afshin Moshrefi (2026 edition). Past performance of seasonal patterns does not guarantee future results. This article is for informational purposes only and does not constitute investment advice.