S&P 500 Technology Sector SPDR (XLK) Has Gained in Every Midterm Jul 31-Jul 28 Run, Averaging 21.17%
S&P 500 Technology Sector SPDR is approaching a 363-day midterm-year seasonal window with a perfect win record, just as AI-driven tech leadership and volatility keep the sector in the spotlight.

What is the seasonal pattern for S&P 500 Technology Sector SPDR (XLK)?
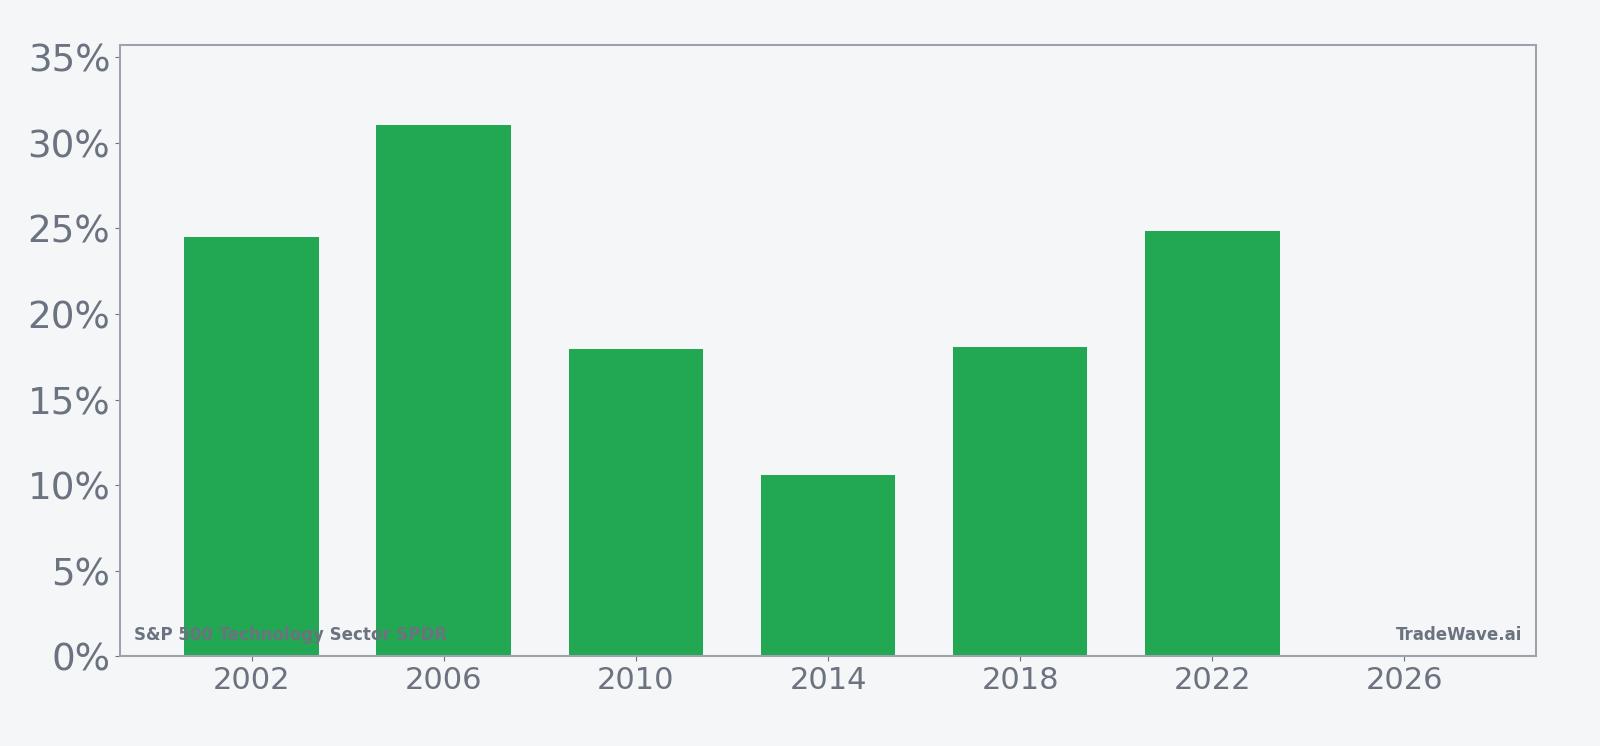
S&P 500 Technology Sector SPDR has risen in 6 of 6 midterm-year Jul 31–Jul 28 windows, with an average gain of 21.17% in winning years.
- 6 for 6 in this window, averaging 21.17% gains in winning years across the last 6 midterm election cycles.
- Percent Profitable is 100%, with 6 winners and 0 losers in the Jul 31–Jul 28 XLK seasonal trend.
- Avg Profit of 21.17% reflects all years in the sample, since every window finished higher.
- The TradeWave Ratio (TWR) of 2.5 indicates price has typically traveled meaningfully in the long direction within the window, independent of the final close.
- A Sharpe ratio of 2.41 points to a historically strong risk-adjusted profile for this S&P 500 Technology Sector SPDR trading window.
- Individual years still saw sizable drawdowns inside the window, with some midterm cycles experiencing double-digit pullbacks before finishing higher.
According to historical data from TradeWave.ai, this midterm-year stretch for XLK has behaved very differently from an average calendar year, and the next iteration is about to begin.
How has S&P 500 Technology Sector SPDR (XLK) traded in this midterm-year window?
S&P 500 Technology Sector SPDR has finished higher in every single Jul 31–Jul 28 midterm-year window across the last six cycles, averaging gains of 21.17% with no losing years. The upcoming 363-day window begins on Jul 31, 2026, with XLK last quoted at 175.88 after a 1.44% pullback and sitting well below a 52-week high near 198.26, leaving room on the chart for either catch-up or further consolidation.[1]
Because this pattern is grouped by the presidential election cycle, it focuses only on midterm election years, when policy uncertainty, rate debates and regulatory noise often peak before easing into the year before the presidential election. For a concentrated tech-sector ETF like XLK, which is dominated by mega-cap names such as Nvidia, Apple and Microsoft, that mid-cycle backdrop has historically lined up with powerful rallies once the policy fog begins to clear.[6]
The trade direction for this XLK seasonal pattern is long, and the track record is unusually clean. Percent Profitable sits at 100%, with 6 winners and 0 losers, and the average gain of 21.17% lines up closely with the 21.29% median, suggesting the window has not been skewed by a single outlier year. The annualized return of 21.0% and Sharpe ratio of 2.41 point to a historically strong risk-adjusted profile for this specific S&P 500 Technology Sector SPDR trading window.
Looking at individual years, the strongest midterm window in the sample came in 2006, when XLK gained 31.05% between the Jul 31 entry and the following Jul 28 exit. The softest outcome was 2014, which still delivered a 10.59% net return over the same dates. Add it up: stacking this 363-day window across the six midterm cycles compounds to a cumulative gain of 213%, which is why this particular slice of the calendar stands out.
Intraperiod swings have been meaningful, even in winning years. In 2002, XLK’s best move within the window reached a 29.19% maximum favorable excursion, but the ETF also suffered a 20.39% maximum adverse excursion from the entry before finishing higher. In 2022, the pattern repeated in a different macro regime, with a 27.32% best run-up and a 21.31% worst drawdown inside the same Jul 31–Jul 28 span. That mix of strong rallies and deep pullbacks is typical of a high-beta tech sector that can overshoot in both directions.
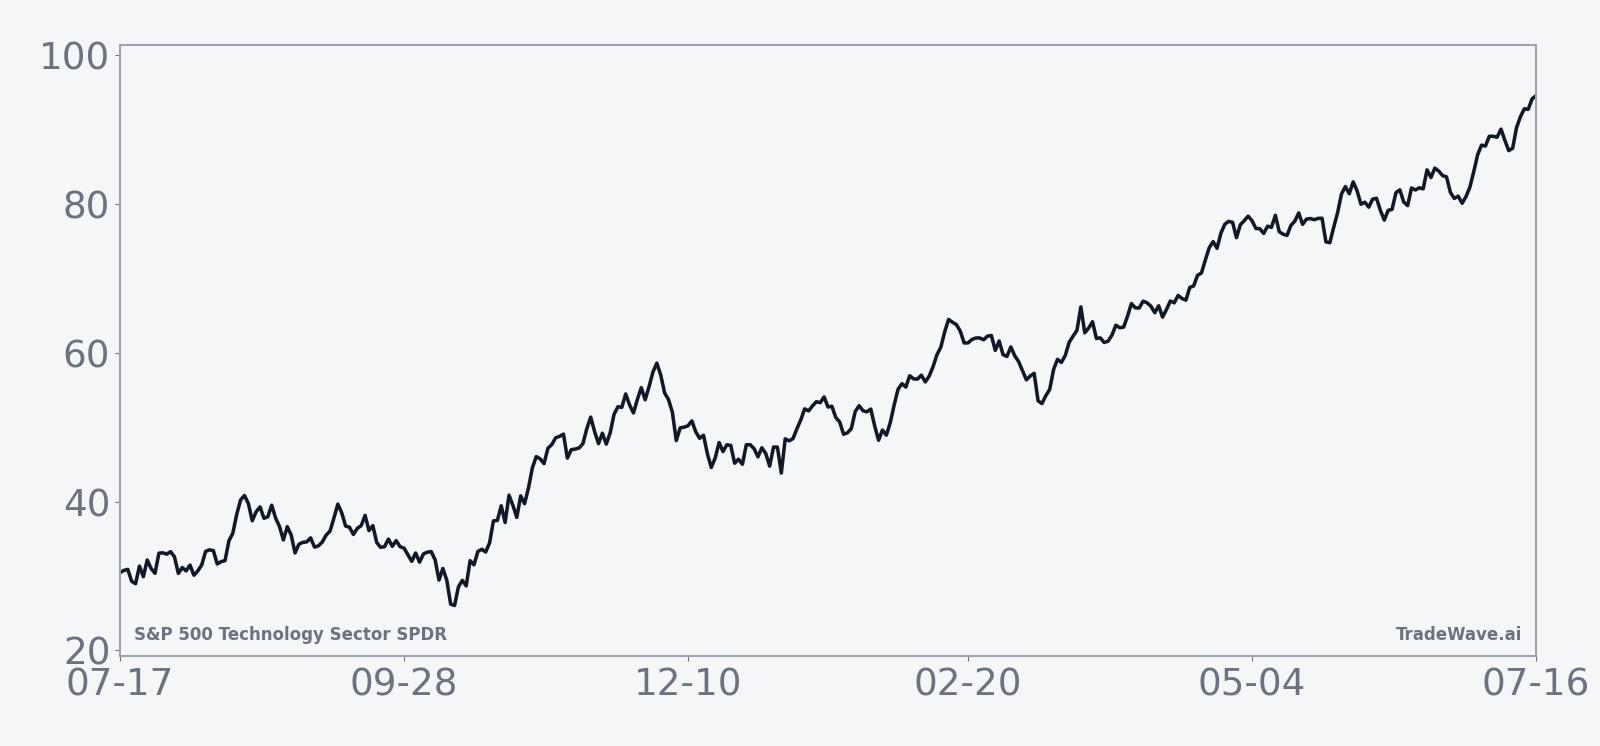
The trend profile across the six midterm-year samples shows that gains have tended to build over the full 363-day stretch rather than arriving in a single burst. Some years, like 2010 and 2018, saw more front-loaded strength, while others, such as 2002 and 2022, endured early or mid-window drawdowns before recovering into the exit date. For long-only investors, the message is that patience inside the window has historically been rewarded, but the ride has rarely been smooth.
Year-by-year ranges show how far XLK has swung inside the window before settling at its final gain.
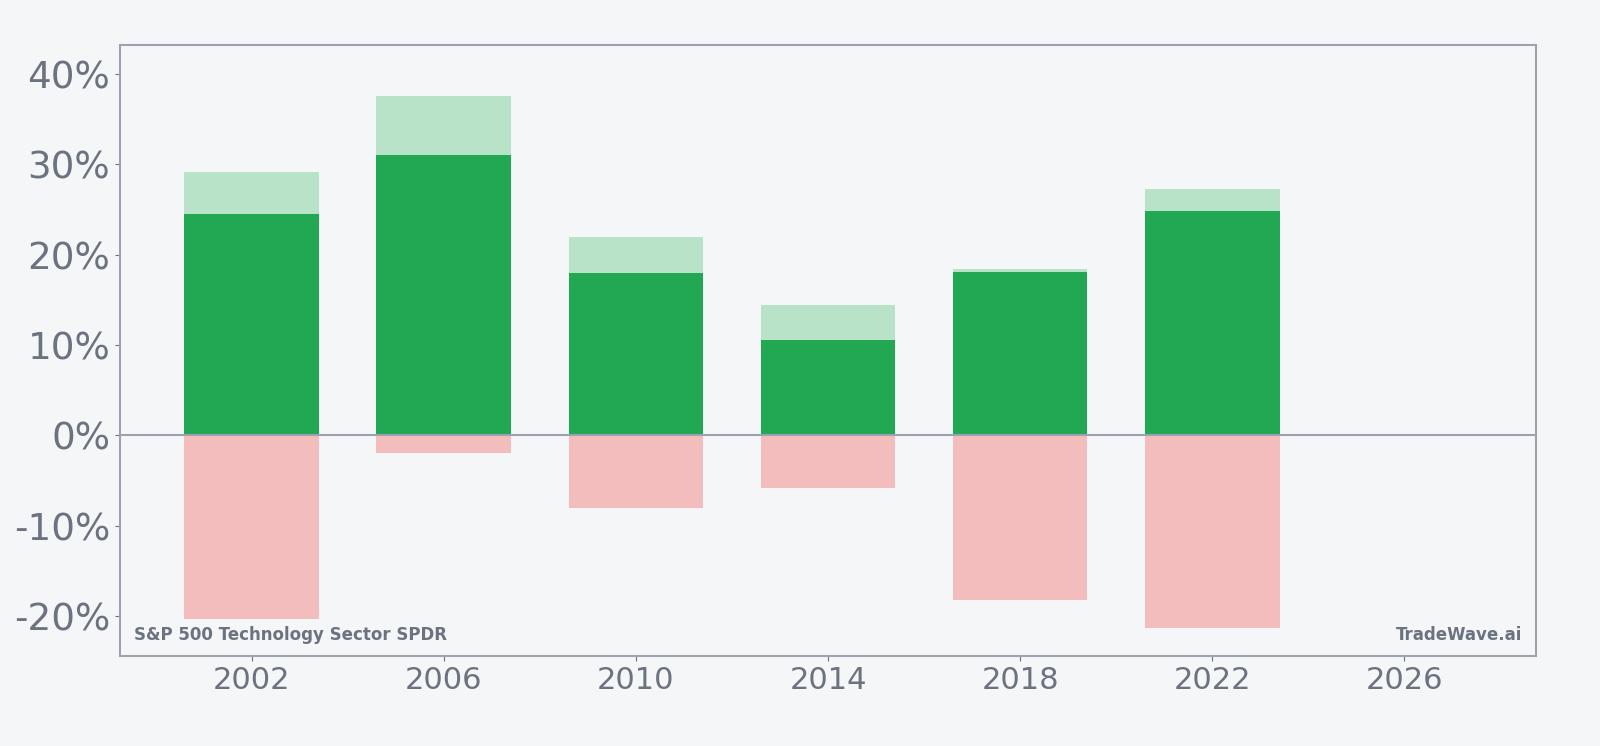
History does not guarantee future results; even in a 100% winning window, adverse excursions have reached more than 20% in some years.
Why does S&P 500 Technology Sector SPDR (XLK) follow this seasonal pattern?
One likely driver is the way the tech sector’s earnings calendar and capital spending plans cluster around the midterm-to-pre-election transition, when corporate visibility often improves and risk appetite returns. Analysts have also pointed to institutional portfolio repositioning and sector rotation, as investors move back into growth and AI-linked names once midterm policy uncertainty fades and the next presidential race comes into view.[4][6] For XLK, which concentrates the largest S&P 500 technology stocks, those flows can translate into a year-long tailwind that shows up clearly in this historical seasonality.
What is driving S&P 500 Technology Sector SPDR (XLK) today?
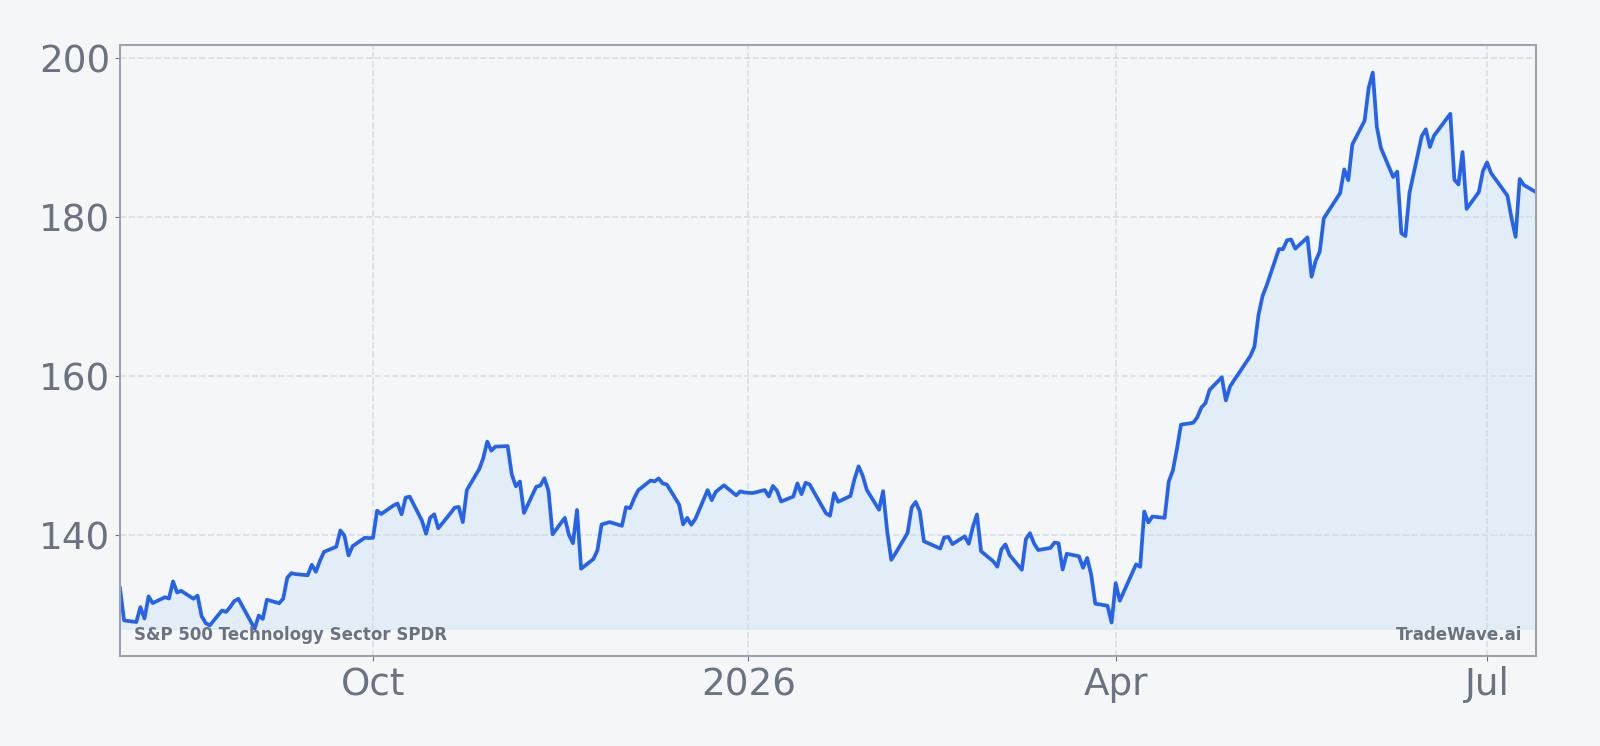
S&P 500 Technology Sector SPDR last traded at 175.88, down 1.44% on the day and roughly 11.3% below its 52-week high near 198.26, with the ETF also sitting under its 50-day moving average around 183.04 and trailing a one-month return of -3.76%.[1] That pullback comes after a powerful multi-quarter run driven by AI-related demand and capital flows into mega-cap tech, which have boosted both XLK and its largest holdings while also increasing day-to-day volatility.[4][9] Recent sector commentary still frames XLK as a primary lens on S&P 500 technology leadership, with investors using it to express broad views on chips, software and cloud rather than picking individual winners and losers.[6][11]
The chart below shows how that consolidation fits into XLK’s past year of trading, alongside a historical seasonal projection for the next 60 days.
What should traders watch as this XLK seasonal window approaches?
First, the calendar: the new Jul 31–Jul 28 midterm-year window opens in a matter of days, so any shift in XLK’s tone around that date will be watched closely against the 6-for-6 historical record. Second, levels: the 50-day moving average near 183 and the prior 52-week high around 198.26 are the obvious resistance zones that would test whether this cycle can echo past midterm-year strength or instead mark a break from the pattern.[1] Third, macro and policy catalysts: tech earnings revisions tied to AI spending, plus any change in the rate or regulatory outlook, will shape whether institutional flows continue to favor concentrated tech exposure through XLK or rotate elsewhere.[2][4][9] Finally, behavior inside the window will matter as much as the end result; if XLK again posts double-digit intraperiod drawdowns before recovering, it would fit the historical script of a bullish but volatile seasonal regime, while a shallow, low-volatility climb would mark a new twist on a very consistent pattern.
Sources
- Seeking Alpha, “State Street Technology Select Sector SPDR ETF (XLK) Price, Quote, News & Analysis” (Jul 25, 2026)
- The Motley Fool, “Is XLK the Best Tech ETF You Can Buy?” (Jun 4, 2026)
- Barchart, “XLK Put/Call Ratio for S&P 500 Technology Sector SPDR ETF” (Jul 21, 2026)
- Barchart, “70% of S&P 500 Tech Stocks Are Down 20% or More from Their All-Time Highs” (Jul 11, 2026)
- Barchart, “This ETF Provides a Lens For Analyzing S&P 500 Tech Winners and Losers in 2026” (Feb 5, 2026)
About this seasonal analysis
Seasonal pattern data is sourced from TradeWave.ai, which analyzes historical price behavior across annual calendar windows going back up to 30 years. Read the full data methodology or the book The 100-Year Pattern by Afshin Moshrefi (2026 edition). Past performance of seasonal patterns does not guarantee future results. This article is for informational purposes only and does not constitute investment advice.