With GDP at 1.5%, Tech Earnings Still Lift Nasdaq QQQ Invesco ETF (QQQ) Into a Historic Midterm Rally Stretch
Nasdaq QQQ Invesco ETF is up about 11% this year and is heading toward a 346-day midterm-election seasonal window that has never posted a loss in the last six cycles.
What is the seasonal pattern for Nasdaq QQQ Invesco ETF (QQQ)?
Nasdaq QQQ Invesco ETF has risen in 6 of 6 midterm-election-year windows starting around Aug 18, with an average gain of 20.08% in winning years.
- 6 for 6 in this window, with Nasdaq QQQ Invesco ETF averaging 20.08% gains across all six midterm-election-year runs.
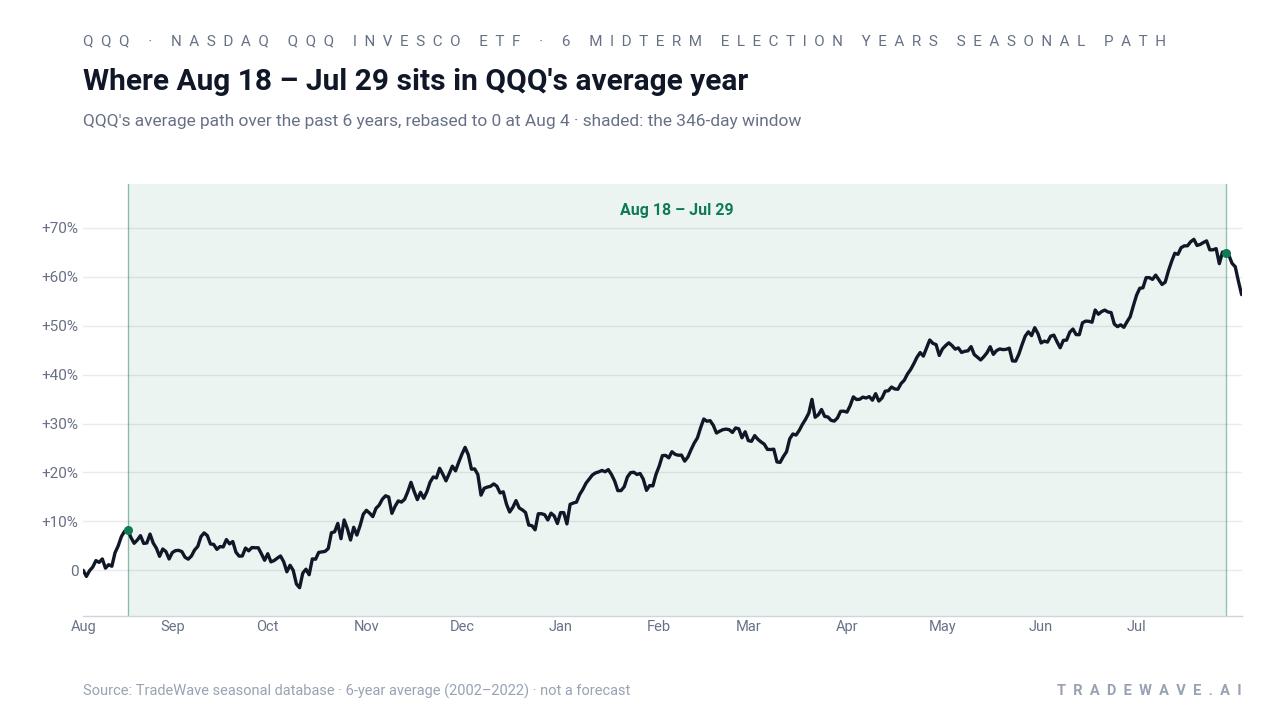
- Seasonal window begins Aug 18 and spans 346 days, covering the late midterm year through most of the following pre-election year.
- Percent Profitable is 100%, with 6 winners and 0 losers across the historical sample.
- Average profit in winning years is 20.08%, with a cumulative return of 196% when stacking the window across all six cycles.
- Intraperiod swings have been meaningful, with individual years seeing worst drawdowns of up to about 22% before finishing higher.
- Trade Direction is long, and the TradeWave Ratio of 2.13 points to strong travel in the upside direction within the window relative to typical noise.
According to historical data from TradeWave.ai, this upcoming stretch for QQQ behaves very differently from an average year, with a distinct midterm-to-pre-election profile that many investors overlook.
How has Nasdaq QQQ Invesco ETF (QQQ) traded in this midterm-year window?
Nasdaq QQQ Invesco ETF has closed higher in every one of the last six midterm-election-year windows that begin around Aug 18, posting a cumulative 196% gain across those cycles. Today QQQ trades around $687.99, up roughly 11% year to date and sitting between its 52-week low near $546 and high near $747, a zone where past midterm-year windows have often marked the start of a longer grind higher.[3] In November 2025, options analysts flagged unusual activity in QQQ’s September 2026 $800 calls, a sign that some traders were already leaning into the idea of higher levels into next year’s pre-election phase.[8]
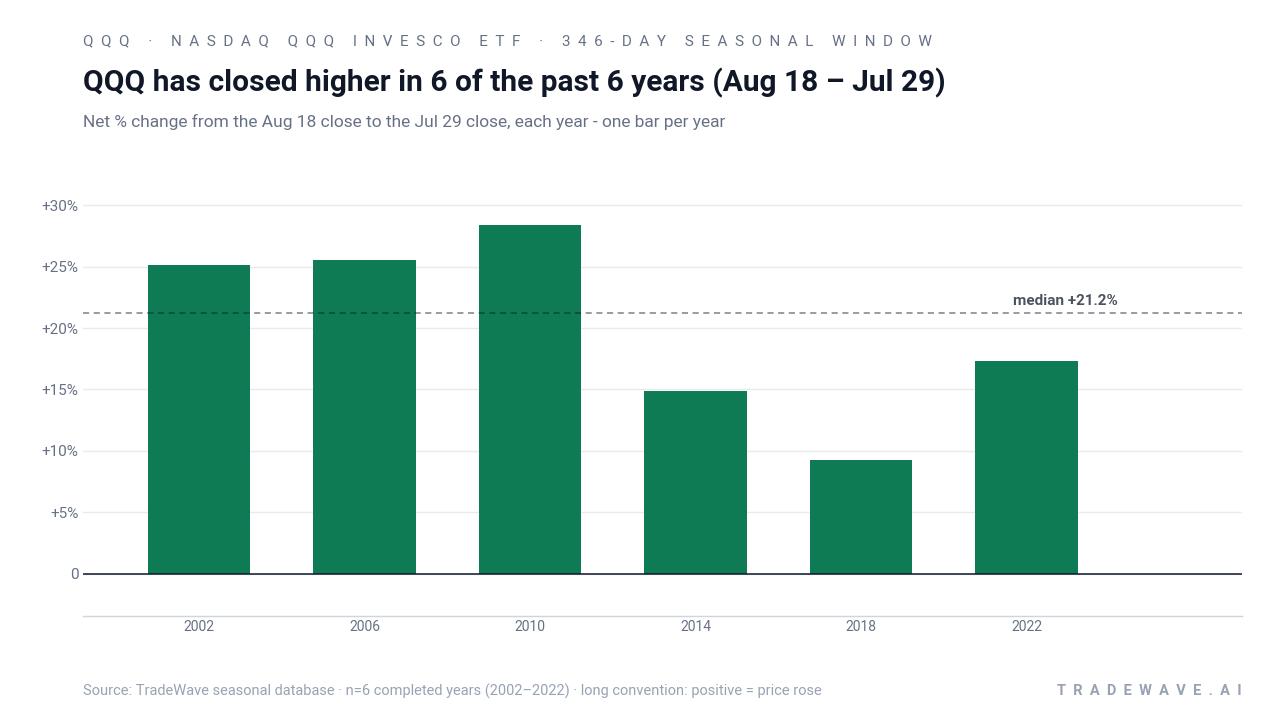
The presidential election cycle matters here because this 346-day stretch links the back half of the midterm election year with most of the year before the presidential election, a phase that has often coincided with friendlier policy tone and improving risk appetite for growth stocks. In this pattern, the Trade Direction is long, and every completed midterm-year sample has delivered a positive net return for QQQ by the end of the window.
Across the six historical runs, Percent Profitable is 100%, with 6 winners and 0 losers, and the average profit across all years is 20.08%. The median profit of 21.22% shows that the typical outcome has been a double-digit gain, not just a few outlier years pulling up the average. Add it up and stacking this window across the six midterm-election years compounds to a 196% cumulative return.
The per-year table shows how that plays out in individual cycles. The strongest year in this sample was 2010, when QQQ gained 28.35% between the Aug 18 entry and the Jul 29 exit, after reaching a best intraperiod run-up of 32.4%. The softest outcome was 2018, which still finished higher by 9.25% but saw a more modest maximum favorable move of 9.77% before consolidating.
Intraperiod risk has been real even in winning years. In 2002, QQQ suffered a worst drawdown of 21.9% at one point in the window before recovering to finish up 25.1%. The 2022 run showed a similar pattern, with a maximum adverse move of 22.64% inside the window before closing 17.35% higher. That MAE profile means the path has not been a straight line, even though the final outcomes have all been positive.
The maximum favorable excursions, or MFE, have tended to be larger than the final net gains, which is what you would expect in a long window where rallies and pullbacks both show up. In 2006, for example, QQQ’s best intraperiod gain reached 31.02% before the trade closed with a 25.56% profit. That gap between MFE and final return is where timing and risk management have mattered most for traders trying to ride the seasonal trend.
A second view shows how each year’s best rally and worst drawdown have lined up around those net results.
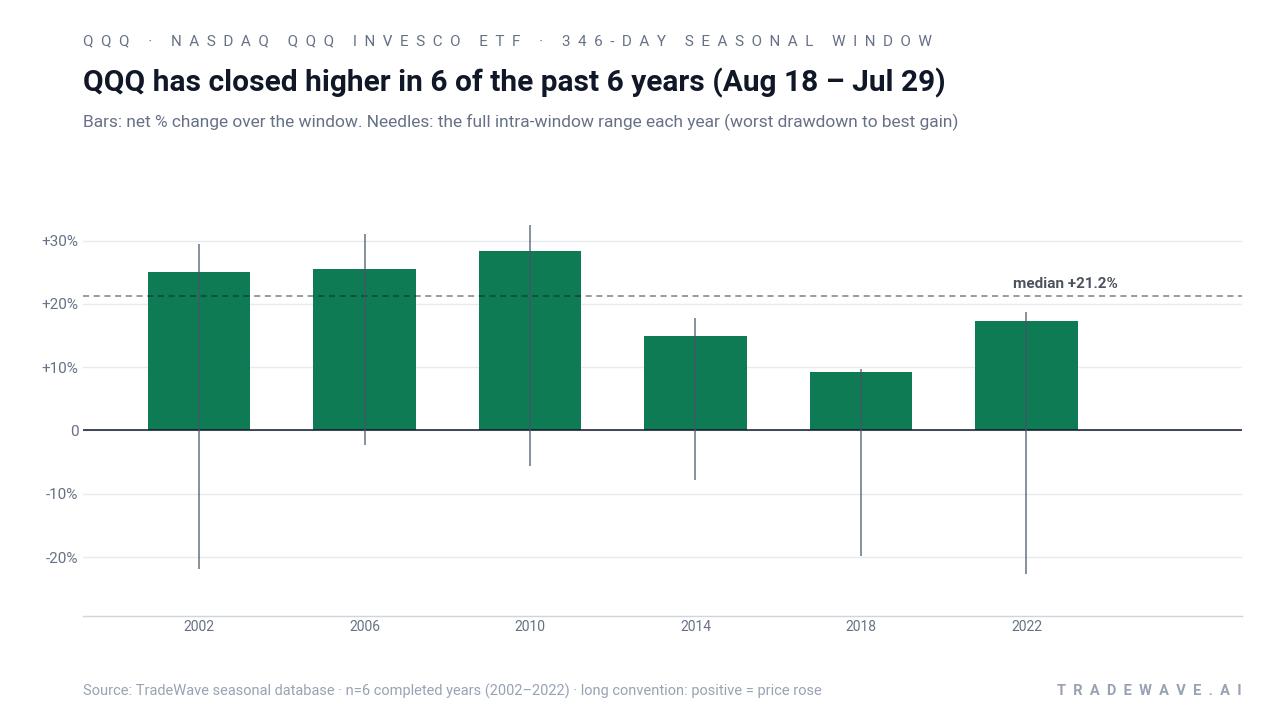
The bars-and-needles view makes the trade-off clear. Net gains have been clustered between roughly 9% and 28%, while the intraperiod ranges stretch much wider, with some years swinging more than 40 percentage points from trough to peak. That combination of a 2.13 TradeWave Ratio and a Sharpe ratio of 2.2 signals a historically strong long bias, but one that has come with sizable swings along the way.
History does not guarantee future results; adverse excursions can be large even in winning windows, and MAE in past cycles has reached more than 20% before the pattern finished higher.
Why does Nasdaq QQQ Invesco ETF (QQQ) follow this seasonal pattern?
This midterm-to-pre-election pattern for QQQ likely reflects a mix of earnings season clustering, policy clarity and institutional positioning. One likely driver is that by late in the midterm year, much of the policy uncertainty that weighed on risk assets earlier in the cycle has been priced, while the following year before the presidential election has historically seen friendlier fiscal and regulatory tone that supports growth and technology spending. Large asset managers also tend to rebalance into secular winners ahead of the pre-election year, and with QQQ dominated by mega-cap tech and AI leaders, that rotation can amplify the historical seasonal trend.
What is driving Nasdaq QQQ Invesco ETF (QQQ) today?
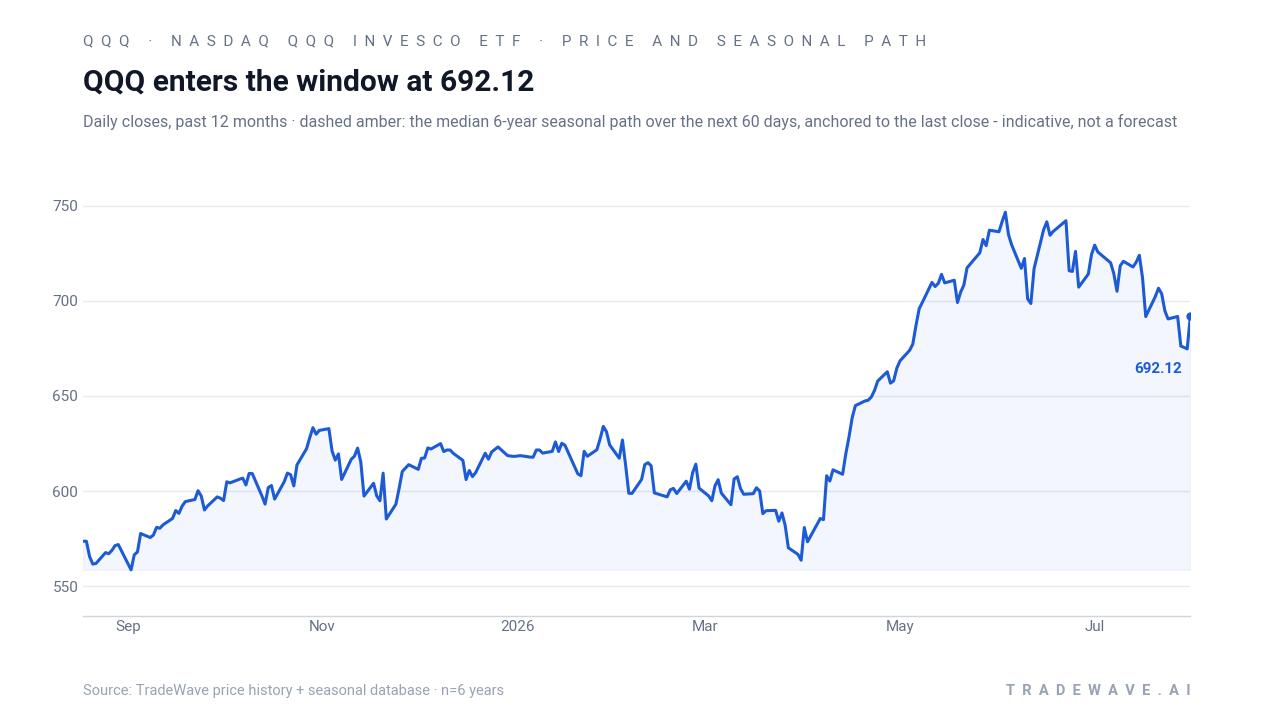
QQQ finished the prior session around $687.99, up about 0.65% on the day and roughly 11% year to date, leaving it about 7.9% below its 52-week high and about 25.9% above its 52-week low.[3] The ETF has been pulled higher by strong results from Microsoft and Amazon, which helped offset softer guidance from Apple and pockets of chip-sector weakness in late July.[1][2][7] At the macro level, a cooler 1.5% annualized reading for second-quarter U.S. GDP has tempered growth optimism, but so far has not derailed demand for large-cap tech exposure inside the Nasdaq-100.[6]
Because QQQ tracks the Nasdaq-100 and is heavily concentrated in mega-cap technology and AI beneficiaries, single-stock moves in names like Apple, Amazon and NVIDIA continue to dominate its tape.[3][7] AI infrastructure spending and robust cloud demand have supported the broader tech complex, even as higher memory costs and selective hardware headwinds have created a more uneven backdrop beneath the surface.[1] In November 2025, options strategists highlighted unusual activity in QQQ’s September 2026 $800 calls, with elevated volume and open-interest dynamics that pointed to traders using upside structures to express medium-term bullish views into the next election phase.[8]
The chart below situates the latest move in its recent multi-month context alongside the historical 60-day seasonal path.
What should traders watch as this QQQ seasonal window approaches?
The first marker is the calendar itself. The new 346-day window opens on Aug 18, placing QQQ squarely in the late midterm election year and then into the year before the presidential election, a phase that has historically been friendlier for growth-heavy benchmarks. Traders will be watching whether price action around that date respects the historical pattern of using late-summer consolidation as a springboard into the following year.
Second, the earnings calendar for QQQ’s top holdings remains critical. Any shift in guidance from mega-cap cloud and AI leaders could either reinforce the historical seasonal strength or blunt it, especially if slower GDP growth feeds into softer enterprise spending.[1][2][6] The 20-day average volume near 39.6 million shares and the 50-day moving average around $714 will be key reference points for whether pullbacks into the window look like routine digestion or something more serious.[3]
Third, options and positioning deserve a closer look. The earlier unusual upside call activity in QQQ for September 2026 suggests some traders have already mapped their risk around this midterm-to-pre-election stretch.[8] Follow-through in that flow, or a pivot toward downside hedges, will tell you whether the options market is leaning into the historical seasonal trend or fading it.
Finally, the behavior of intraperiod swings will be a real-time test of the pattern. Historically, even winning years have seen drawdowns of 15% to 20% inside the window before finishing higher. If QQQ sells off sharply but holds above key support zones while mega-cap earnings and policy headlines remain constructive, that would be consistent with the past playbook. A break of those levels on heavy volume, paired with a shift in options sentiment, would be a sign that this cycle may be diverging from the 6-for-6 record.
Sources
- MarketWatch, "Invesco QQQ Trust Series I Overview" (Aug 2, 2026).
- Yahoo Finance, "US Indices End Week Higher As Amazon Earnings Lift Sentiment, But Nasdaq Logs Worst Month In Over A Year — PSKY, BABA, RDDT, RIVN, AMZN In Focus" (Aug 1, 2026).
- MarketWatch, "Invesco QQQ Trust Series I Overview" (Aug 2, 2026).
- Yahoo Finance, "US Indices End Week Higher As Amazon Earnings Lift Sentiment, But Nasdaq Logs Worst Month In Over A Year — PSKY, BABA, RDDT, RIVN, AMZN In Focus" (Aug 1, 2026).
- MarketWatch, "Invesco QQQ Trust Series I Overview" (Aug 2, 2026).
- Yahoo Finance, "US Indices End Week Higher As Amazon Earnings Lift Sentiment, But Nasdaq Logs Worst Month In Over A Year — PSKY, BABA, RDDT, RIVN, AMZN In Focus" (Aug 1, 2026).
- Yahoo Finance, "US Indices End Week Higher As Amazon Earnings Lift Sentiment, But Nasdaq Logs Worst Month In Over A Year — PSKY, BABA, RDDT, RIVN, AMZN In Focus" (Aug 1, 2026).
- Barchart, "Unusual QQQ Options Activity Prompts Covered Strangle ..." (Nov 7, 2025).
About this seasonal analysis
Seasonal pattern data is sourced from TradeWave.ai, which analyzes historical price behavior across annual calendar windows going back up to 30 years. Read the full data methodology or the book The 100-Year Pattern by Afshin Moshrefi (2026 edition). Past performance of seasonal patterns does not guarantee future results. This article is for informational purposes only and does not constitute investment advice.