S&P 500 Technology Sector SPDR (XLK) Has Rallied in 6 of 6 Midterm-Year Windows Since 2002
S&P 500 Technology Sector SPDR is approaching a historically powerful 348-day midterm-year seasonal window even as the ETF trades below its 52-week high and contends with rotation out of mega-cap tech.

What is the seasonal pattern for S&P 500 Technology Sector SPDR (XLK)?
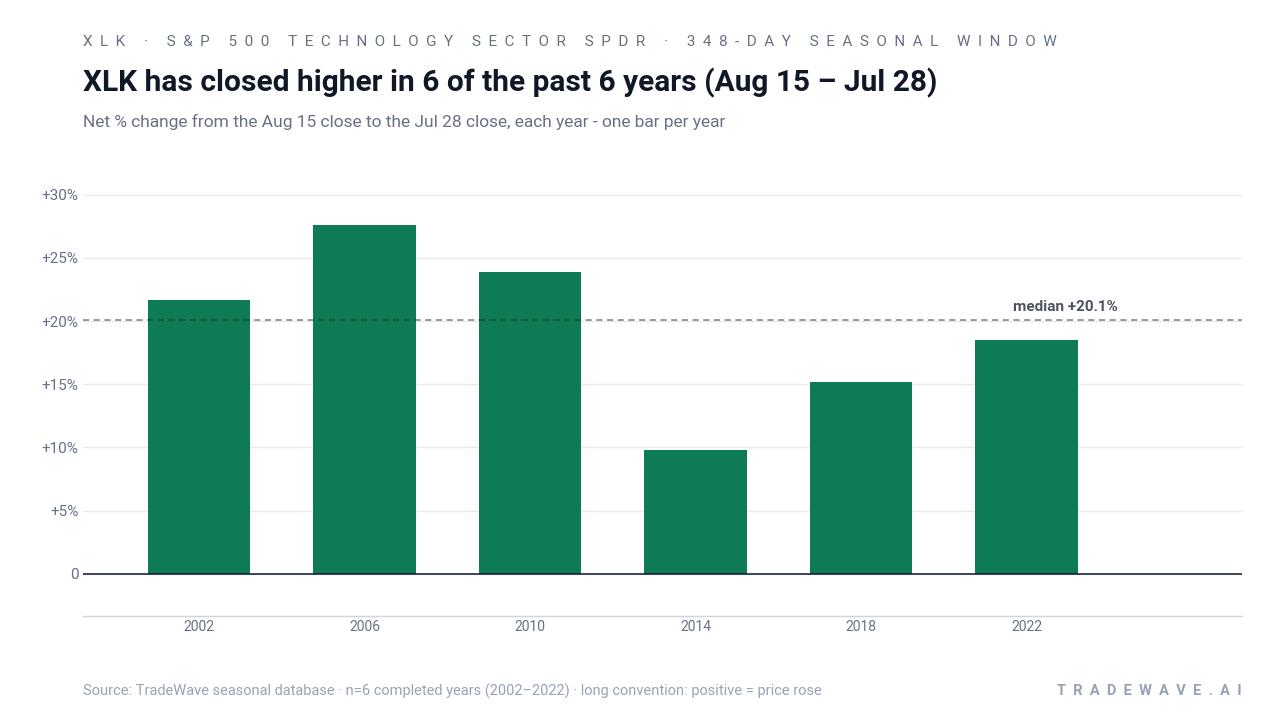
S&P 500 Technology Sector SPDR has risen in 6 of 6 midterm-year windows starting Aug 15, with an average gain of 19.44% in winning years.
- 6 for 6 in this window, with XLK posting gains every time and averaging 19.44% in those winning years.
- The upcoming seasonal window begins Aug 15 and runs for 348 days, spanning late midterm year into the following pre-election year.
- Percent Profitable is 100%, with 6 winners and 0 losers across the last six midterm election years.
- Annualized return over these windows is 19.29%, compounding to a cumulative 188% across the sample.
- The TradeWave Ratio is 2.46, indicating that price has typically traveled meaningfully in the long direction within the window.
- A Sharpe ratio of 2.45 points to historically strong risk-adjusted returns for this specific XLK seasonal stretch.
According to historical data from TradeWave.ai, this midterm-year stretch for XLK has behaved very differently from an average calendar year, and the next iteration is about to open.
How strong is the upcoming seasonal window for S&P 500 Technology Sector SPDR (XLK)?
XLK has closed higher in every single Aug 15 to Jul 28 midterm-year window across the last six cycles, averaging gains of 19.44%. The ETF finished the prior session at 175.35, about 11.6% below its 52-week high of 198.26 and down 1.58% year to date.
The pattern is grouped by the presidential election cycle, focusing on the last six midterm election years rather than consecutive calendar years. That matters because policy uncertainty, rate paths and regulation often follow a four-year rhythm, and tech leadership has tended to respond differently in midterm years than in election or pre-election years.
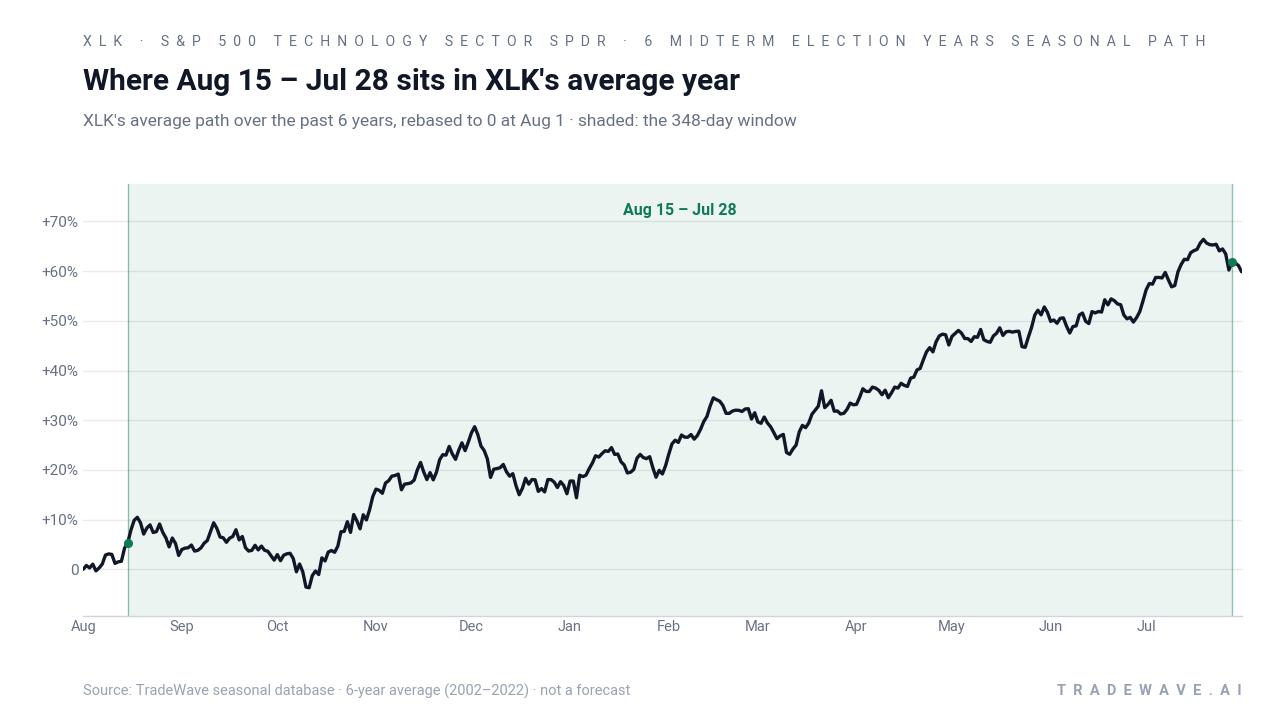
This upcoming window begins on Aug 15 and runs 348 days, carrying XLK from the late stages of the current midterm election year into most of the following pre-election year. Historically, that combination has been friendly to long exposure in the S&P 500 Technology Sector SPDR, with an annualized return of 19.29% and a cumulative gain of 188% if the window were repeated back-to-back across the six midterm cycles in the sample.
All six historical windows were profitable for a long trade, so the Percent Profitable metric sits at 100% with 6 winners and 0 losers. Average gains of 19.44% in winning years line up closely with the 19% average across all years, since there were no losing outcomes to drag the figure down. The median profit of 20.12% shows that the typical midterm-year outcome has been a high-teens to low-20s percentage gain over the 348-day stretch.
Looking at individual years, 2006 stands out as the strongest, with a net return of 27.57% and a maximum favorable move of 33.97% from the entry price. At the softer end of the sample, 2014 still delivered a 9.78% gain, with a best intraperiod rally of 13.54% but a drawdown of 6.5% along the way. Even the more volatile years such as 2002 and 2022 finished with gains of 21.69% and 18.54% respectively, despite intraperiod swings.
The combined bars and intraperiod range chart shows how far XLK has tended to run in both directions before the window closes.
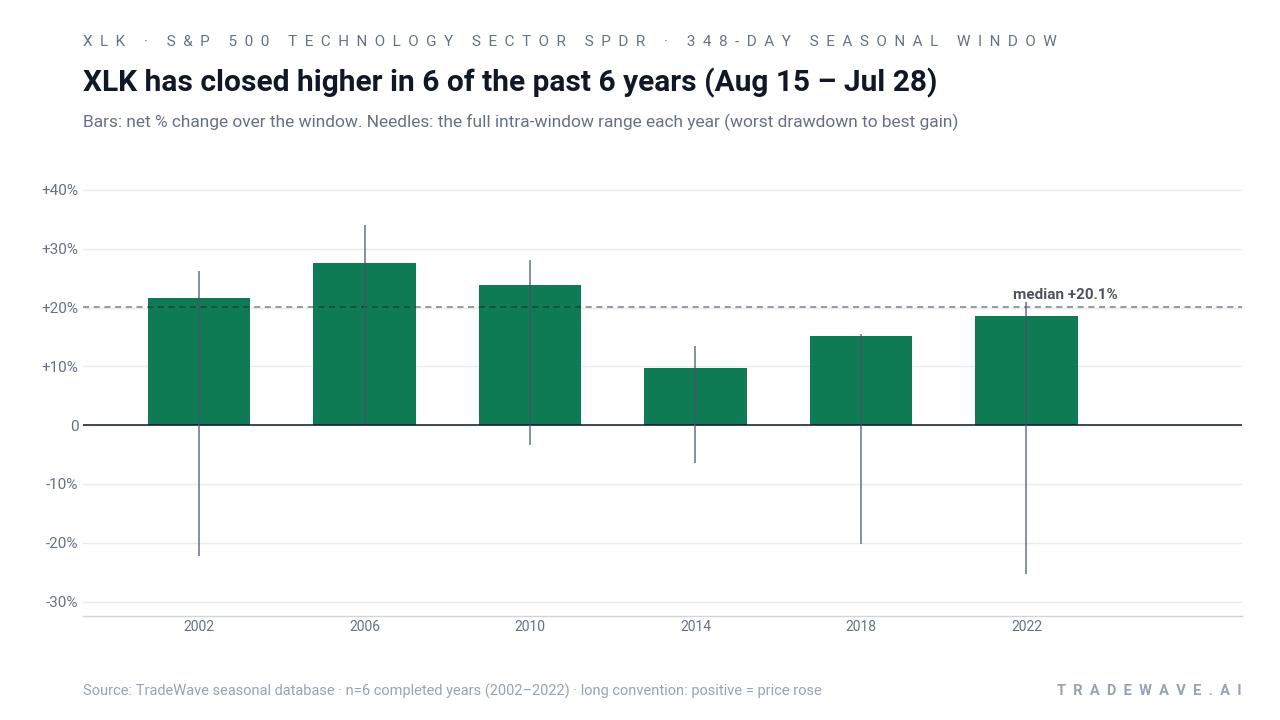
The intraperiod profile shows that maximum favorable moves have often pushed into the mid-20% to low-30% range, while maximum adverse moves have at times reached into double-digit drawdowns. In 2022, for example, XLK’s best run-up within the window was 20.89%, but the worst drawdown from entry was 25.28% before the ETF recovered to finish higher. That mix of strong upside and meaningful downside is what drives the TradeWave Ratio of 2.46 and the Sharpe ratio of 2.45 for this pattern.
Put together, the record is clean: six for six, with high-teens average gains and a consistent upward seasonal trend across midterm election years. The catch is that the path has not been smooth, and the worst drawdowns have tended to arrive early in the window in several cycles before the longer grind higher took over.
History does not guarantee future results; adverse excursions (MAE) can be large even in winning windows.
Why does S&P 500 Technology Sector SPDR (XLK) follow this seasonal pattern?
One likely driver is the way the presidential election cycle shapes policy expectations, which in turn influence risk appetite for growth and technology stocks. Analysts often point to midterm-year volatility followed by a more supportive pre-election year backdrop, when fiscal and regulatory risk tends to ease and earnings visibility improves. This XLK seasonal pattern may also reflect institutional portfolio rebalancing and sector rotation that favor large-cap tech as the cycle transitions from midterm uncertainty into a more pro-growth stance.
What is driving S&P 500 Technology Sector SPDR (XLK) today?
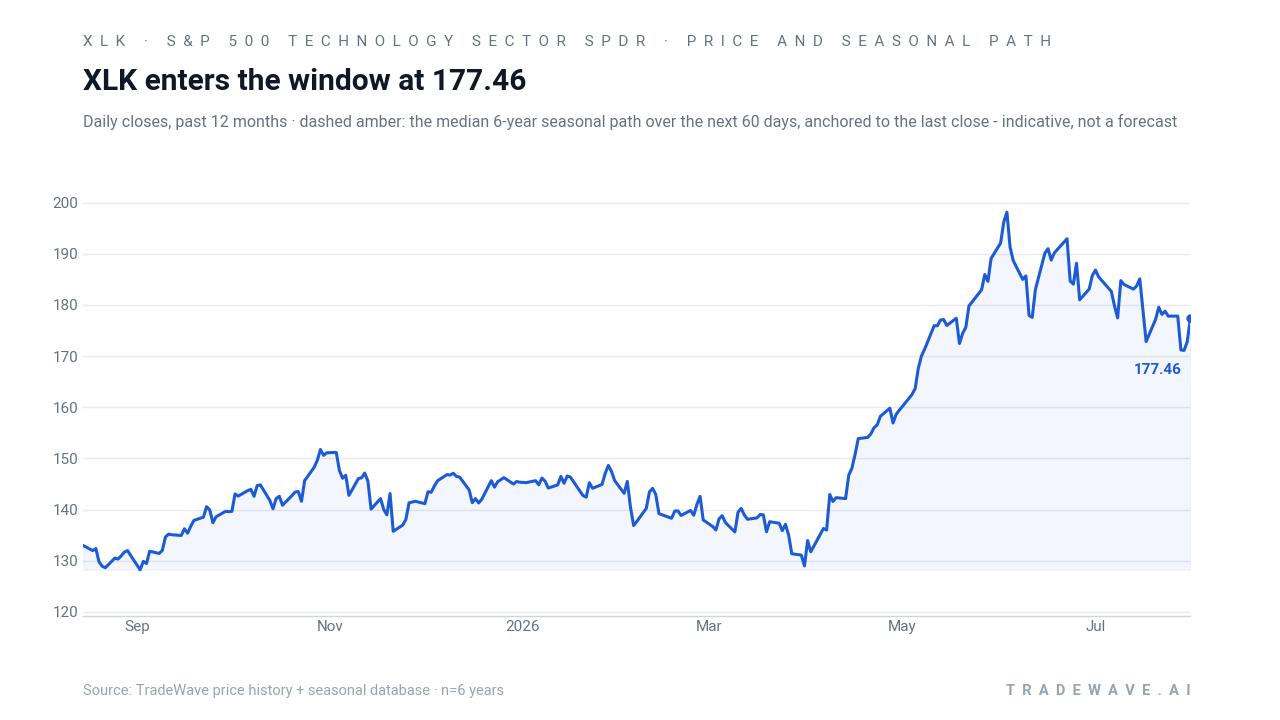
XLK ended the prior session at 175.35, down 0.22% on the day, leaving the ETF about 11.6% below its 52-week high of 198.26 and modestly negative for 2026 with a year-to-date decline of 1.58%. The S&P 500 Technology sleeve has been under pressure as cash rotates out of large-cap tech and into other parts of the market, a shift that weighed on XLK through July 2026 and left the sector lagging areas with more cyclical or value exposure.[1]
At the same time, there are signs of renewed conviction inside the sector. Over the past six months, 28 executives at companies held within XLK have bought their own stock on the open market, the highest such tally on record in data tracked by SentimenTrader and reported by Yahoo Finance.[2] Insider buying at that scale is often interpreted as a vote of confidence in future fundamentals, especially when it clusters after a period of underperformance.
Trading activity has also been robust. Recent commentary cited weekly XLK volume of about 9.37 million shares and a last-session tally of 14.37 million shares, alongside comparisons with peer tech ETFs.[3] That sits above the ETF’s 20-day average volume of roughly 9.12 million shares, suggesting that investors are actively repositioning rather than drifting away from the sector.
Structurally, XLK remains one of the market’s key technology benchmarks, with assets under management reported between about $90 billion and $112 billion across recent articles and a fee of 0.08% or 8 basis points.[3] In late July 2026, one report noted that XLK had rallied 26.8% over the prior year, underscoring how quickly performance can swing when mega-cap tech leadership returns.[4]
The chart below shows XLK’s past year of trading alongside a 60-day median seasonal path for context.
What should traders watch as this XLK seasonal window approaches?
First, the calendar. The 348-day window opens on Aug 15, so any pickup in volatility or trend change around that date will be watched against the backdrop of a six-for-six winning record. Because the window runs deep into the following pre-election year, it also overlaps the part of the presidential cycle that has historically been friendlier to risk assets.
Second, price levels. With XLK trading below its 50-day moving average of about 182.78 and well under its 52-week high, traders will be watching whether the ETF can reclaim that moving average as the window begins or whether it continues to lag while the seasonal clock turns. A decisive move back toward the 190–200 area during the early part of the window would rhyme with prior years that saw strong maximum favorable moves.
Third, insider and volume signals. The record insider buying across XLK constituents is already on the tape; the next tell will be whether that activity persists or fades as the seasonal window opens.[2] On the tape, sustained volume above the roughly 9.12 million share 20-day average, especially on up days, would suggest that institutions are leaning into the historical XLK seasonal trend rather than fading it.[3]
Finally, the macro and policy calendar. As the midterm election year progresses toward its back half, investors will parse central bank commentary, fiscal headlines and regulatory signals that could either reinforce or undercut the historical tech-friendly pattern. If XLK can weather ongoing rotation out of mega-cap tech while the seasonal window opens, and if insider conviction and volume strength hold up, that would line up with how prior midterm-year windows have ultimately resolved.
Sources
- Yahoo Finance – Tech sector rotation and XLK underperformance vs other areas of the market (Jul 2026)
- Yahoo Finance – SentimenTrader data on record insider buying across XLK constituents (2026)
- Barchart – XLK profile, assets under management, fees and trading volumes (Apr 9, 2026)
- Yahoo Finance – XLK 26.8% one-year gain and sector performance context (Jul 31, 2026)
About this seasonal analysis
Seasonal pattern data is sourced from TradeWave.ai, which analyzes historical price behavior across annual calendar windows going back up to 30 years. Read the full data methodology or the book The 100-Year Pattern by Afshin Moshrefi (2026 edition). Past performance of seasonal patterns does not guarantee future results. This article is for informational purposes only and does not constitute investment advice.