Nasdaq QQQ Invesco ETF (QQQ) Is 6-for-6 in Midterm Runs, Averaging 20.08% Gains
Nasdaq QQQ Invesco ETF is trading near record territory as it approaches a historically powerful midterm-year seasonal window that has never produced a loss in this sample, with options activity and tech momentum already running hot.

What is the seasonal pattern for Nasdaq QQQ Invesco ETF (QQQ)?
Nasdaq QQQ Invesco ETF has risen in 6 of 6 midterm-year Aug 18–Jul 29 windows, with an average gain of 20.08% in winning years.
- 6 for 6 in this window, averaging 20.08% gains in winning years across the last six midterm election cycles.
- Seasonal window runs from Aug 18 and spans 346 days, covering the late midterm year into the heart of the year before the presidential election.
- Percent Profitable is 100%, with 6 winners and 0 losers in the TradeWave sample.
- Annualized return of 19.89% and a Sharpe ratio of 2.2 point to unusually strong risk‑adjusted performance.
- TradeWave Ratio of 2.13 suggests price has typically traveled meaningfully in the long direction within the window, not just drifted higher.
- Individual years have still seen sizable drawdowns inside the window, with adverse moves reaching more than 20% in some cycles before recovering.
According to historical data from TradeWave.ai, this upcoming midterm-year stretch for QQQ has behaved very differently from an average year on the calendar, and the next iteration is less than two weeks away.
How strong is the upcoming seasonal window for Nasdaq QQQ Invesco ETF (QQQ)?
Nasdaq QQQ Invesco ETF has posted gains in every one of the last six midterm-year Aug 18–Jul 29 windows, averaging 20.08% per cycle. Today QQQ sits at 687.99, about 7.9% below its 52-week high of roughly 747.00 and well above its 52-week low near 553.49, leaving it elevated but not stretched. Unusually heavy options volume and short-dated options flow around QQQ in recent sessions signal that traders are already leaning into tech exposure and using the ETF as a high-octane vehicle for bullish bets.[2][3] That mix of a clean historical seasonal trend, a price level just off the highs, and aggressive derivatives positioning sets up a high-stakes test of whether this pattern can extend into the next election phase.
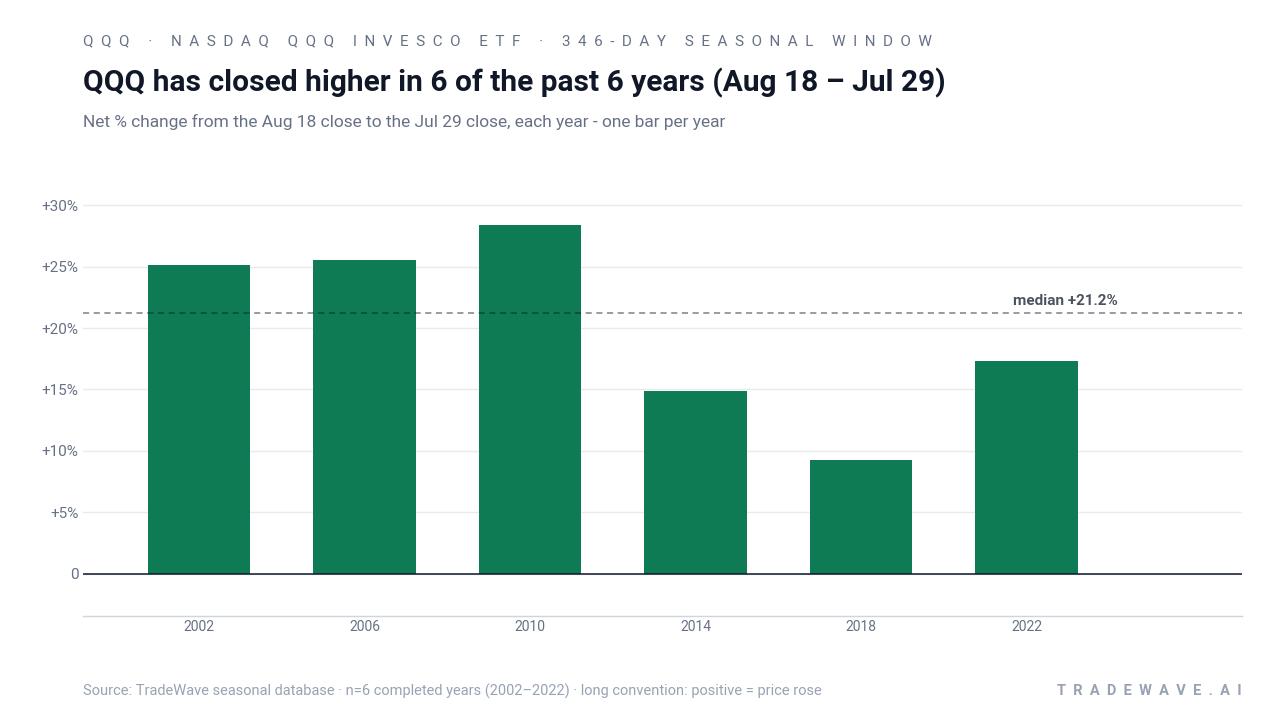
Because this pattern is grouped by the presidential election cycle, it only looks at midterm election years, then follows QQQ from late in that year into the year before the presidential election. That matters for a tech-heavy ETF like QQQ because policy, regulation and liquidity often shift meaningfully between the midterm and the pre-election year, changing how investors treat large-cap growth and AI leaders that dominate the Nasdaq-100.[1][4]
This seasonal window begins on Aug 18 and spans 346 days. Historically, during this period, Nasdaq QQQ Invesco ETF has shown a strong upside tendency when traded long, with 6 winners and 0 losers across the last six midterm election cycles. Average gains of 20.08% mask a wide range of outcomes, from a 9.25% advance in 2018 to a 28.35% surge in 2010, but every cycle in the sample finished higher than it started.
The average winner gain of 20.08% means that in a typical midterm-year window, QQQ has added roughly one-fifth of its value from the Aug 18 entry to the Jul 29 exit. Because there are no losing years in this sample, the all-years average is the same as the average winner, and the 19.89% annualized return and 2.2 Sharpe ratio underline how unusually consistent this stretch has been for long exposure. Add it up: compounding this window across the six cycles in the database would have produced a cumulative gain of 196%.
Intraperiod swings have still been meaningful. Maximum favorable moves, or the best point-to-peak rallies within each window, have ranged from about 9.77% in 2018 to more than 32% in 2010, showing that strong years often saw additional upside beyond the final close. On the downside, maximum adverse moves, or the worst drawdowns from entry, have reached as deep as roughly 22.64% in 2022 and 21.9% in 2002, while the mildest drawdown was only about 2.24% in 2006. That mix of large positive excursions and sometimes sharp setbacks is what drives the TradeWave Ratio of 2.13, indicating that QQQ has typically traveled a substantial distance in the long direction inside the window.
The per-year table shows that the weakest net outcome in this sample was 2018, when QQQ still gained 9.25% but endured an intraperiod drawdown of about 19.79% before recovering. The strongest year was 2010, with a 28.35% net gain and a 32.4% best run-up, while 2002 and 2022 both combined mid-teens to mid-20s gains with drawdowns in the low 20% range. In other words, the pattern has been “right” on direction every time, but not without testing long holders along the way.
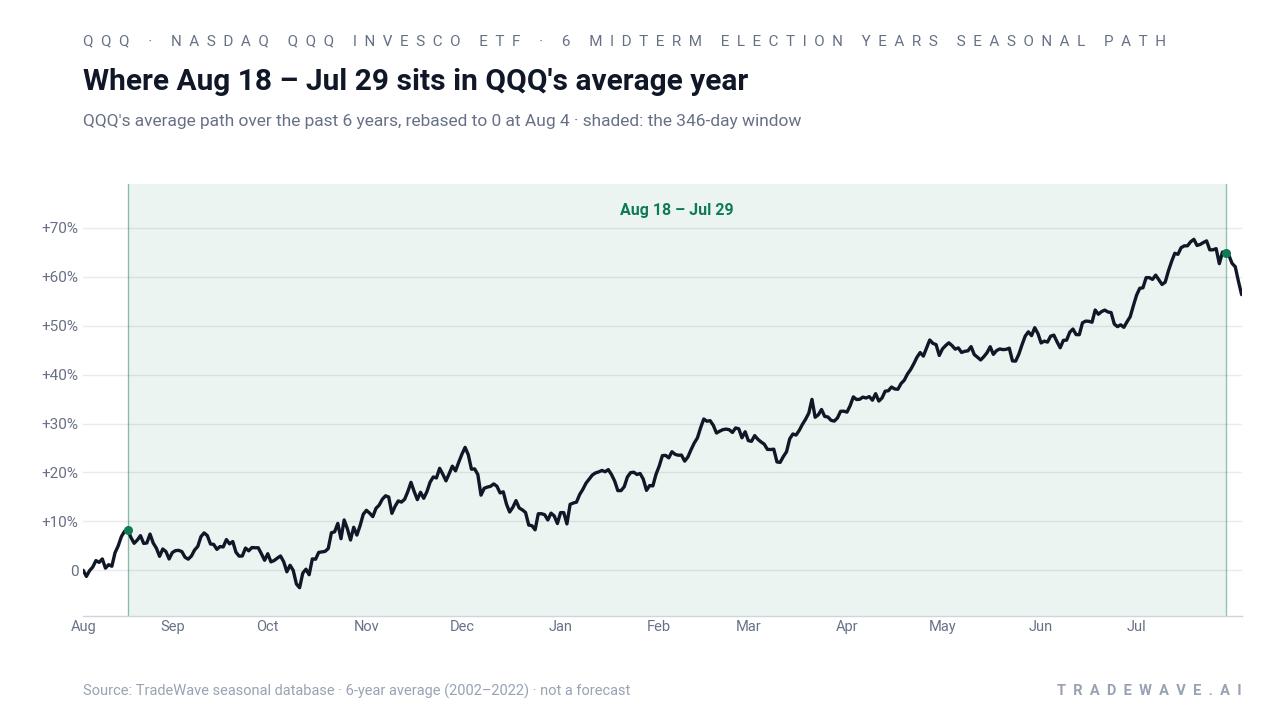
The historical seasonal average suggests that QQQ has tended to grind higher through much of this window rather than spike in a single burst. Gains often build from the early months after Aug 18, with some choppiness around the turn of the calendar year, then re-accelerate as the market moves deeper into the year before the presidential election. That profile lines up with the idea that investors often re-risk into large-cap growth as policy uncertainty around the midterms fades and the pre-election year historically leans more risk-on.
The next chart shows how each year’s net result and full intraperiod range stack up, combining upside potential and downside risk in one view.
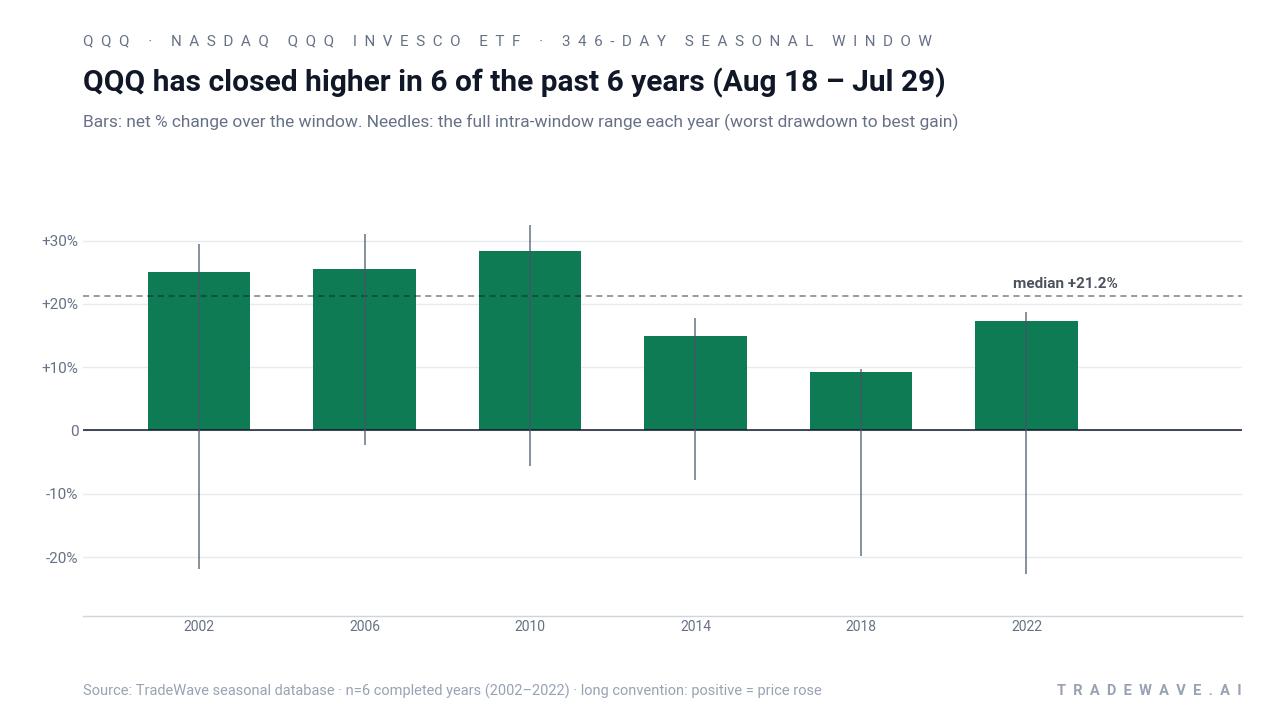
The stacked net / maximum favorable / maximum adverse profile shows a clear pattern: every bar ends above zero, but the needles extend meaningfully in both directions. In several years, QQQ first dropped more than 15% from the entry before finishing with double-digit gains, while in others the ETF rallied strongly with only modest pullbacks. For traders, that means this has historically been a window where staying with the long direction has paid, but only if they were prepared for sizable swings along the way.
History does not guarantee future results; adverse excursions can be large even in winning windows, and past seasonal behavior may not repeat.
Why does Nasdaq QQQ Invesco ETF (QQQ) follow this seasonal pattern?
One likely driver is the way the earnings calendar and policy cycle line up for mega-cap tech and growth stocks that dominate QQQ. Analysts have pointed to midterm election years as a period when early-year volatility gives way to a more supportive backdrop once the political outcome is known and fiscal and regulatory paths look clearer.[2][4] This pattern may also reflect institutional portfolio rebalancing and renewed risk appetite into the year before the presidential election, when historical data show investors often lean back into growth and AI themes using vehicles like QQQ.[1][6]
What is driving Nasdaq QQQ Invesco ETF (QQQ) today?
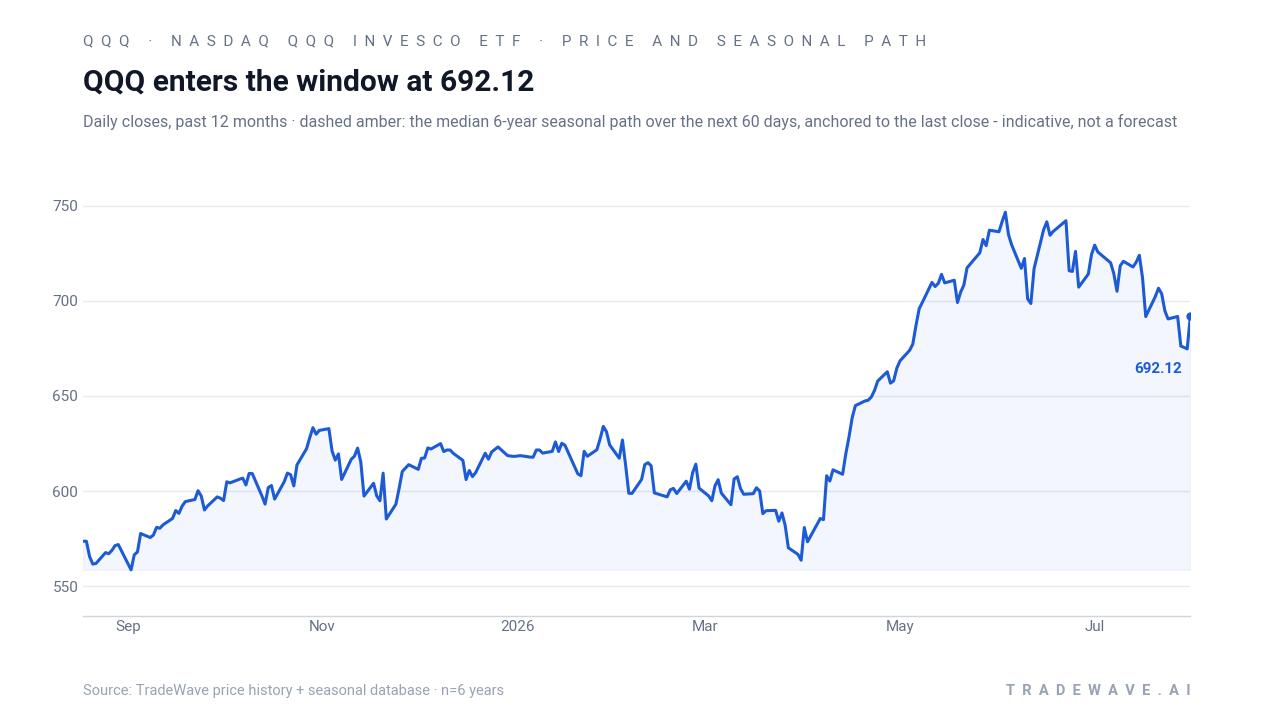
Nasdaq QQQ Invesco ETF closed at 687.99 on Aug 7, up 0.65% on the day and roughly 8.0% below its 52-week high near 748.65, after a roughly 10% correction earlier in the summer reset some of the froth in large-cap growth.[1][3] The ETF remains a primary vehicle for exposure to Nasdaq-100 heavyweights such as Nvidia, Apple and Microsoft, and it has been at the center of a powerful rebound in tech and AI-linked names as markets regained momentum following earnings and a calmer read on Federal Reserve policy.[1][2][6] Several reports describe heavy trading activity and elevated options volume in QQQ, with high volume-to-open-interest readings and concentrated short-dated call buying that point to aggressive bullish positioning rather than quiet index hedging.[2][8] At the same time, flows data and institutional filings show that wealth managers continue to use QQQ as a core way to express long-term conviction in the Nasdaq-100, even as some firms trim or add around the edges in response to volatility.[3][4][12][13]
The chart below situates the latest move in its recent multi-month context alongside the median 60-day seasonal path.
What should traders watch as this QQQ seasonal window approaches?
First, the calendar: the 346-day window opens on Aug 18, so price action in the coming days will determine whether QQQ enters the pattern from a position of strength near the highs or after another shakeout. Second, levels: traders will be watching how QQQ behaves around the 50-day moving average near 714.43 and the prior 52-week high zone around 747–748, since historical windows have often featured sizable drawdowns before the longer-term uptrend reasserted itself.[13] Third, the options tape: if the current wave of heavy, short-dated bullish options flow persists or intensifies as the window begins, it would signal that speculators are leaning into the same side of the boat that history has favored, whereas a sharp fade in call activity or a rise in put demand would suggest a more cautious stance.[2][8] Finally, the policy and macro calendar matters: midterm-year markets are already digesting the outcome of congressional races, and as the calendar rolls toward the year before the presidential election, traders will be gauging whether earnings breadth, AI spending and regulatory headlines keep supporting the kind of tech-led risk appetite that has historically powered this QQQ seasonal trend.[1][2][6]
Sources
- The Motley Fool, "Is QQQ Worth Buying Now That SpaceX Has Joined the Nasdaq-100? Here's My Honest Take.", Aug 3, 2026
- CNBC, "Stock bears obliterated as Nasdaq 100 logs top 10 bullish stat of past decade", Aug 5, 2026
- MarketBeat, "Simplicity Wealth LLC Has $5.38 Million Stock Position in Invesco QQQ $QQQ", Jul 11, 2026
- MarketBeat, "Graetz Wealth LLC Sells 3,195 Shares of Invesco QQQ $QQQ", Jul 10, 2026
About this seasonal analysis
Seasonal pattern data is sourced from TradeWave.ai, which analyzes historical price behavior across annual calendar windows going back up to 30 years. Read the full data methodology or the book The 100-Year Pattern by Afshin Moshrefi (2026 edition). Past performance of seasonal patterns does not guarantee future results. This article is for informational purposes only and does not constitute investment advice.