S&P 500 Technology Sector SPDR (XLK) Has Risen in 6 of 6 Midterm Windows, Averaging 19.44% Gains
S&P 500 Technology Sector SPDR is trading just below record territory as it approaches a midterm-year seasonal window that has never produced a loss in this dataset, setting up a powerful but volatile backdrop for tech traders.

What is the seasonal pattern for S&P 500 Technology Sector SPDR (XLK)?
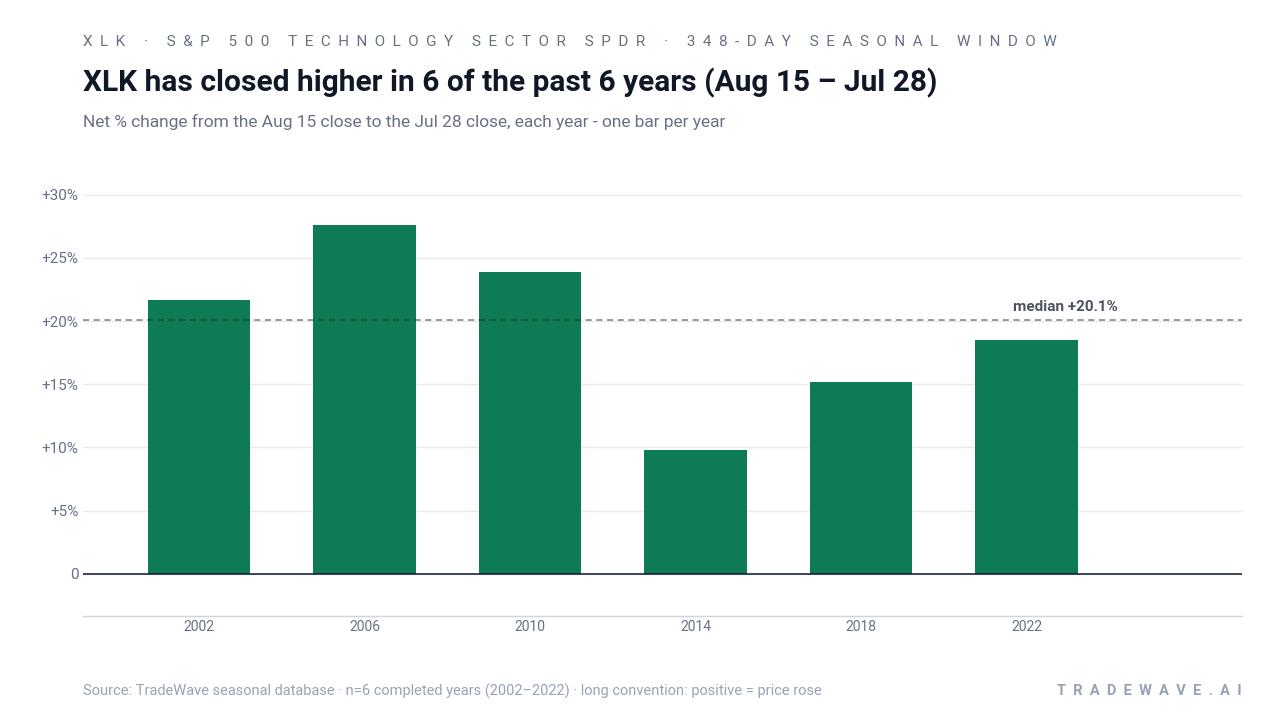
S&P 500 Technology Sector SPDR has risen in 6 of 6 midterm-election-year Aug 15–Jul 28 windows, with an average gain of 19.44% in winning years.
- 6 for 6 in this window, with XLK posting gains every time and averaging 19.44% profit in winning years.
- Seasonal direction is bullish for a long trade from Aug 15 through the following Jul 28, spanning 348 calendar days.
- Percent Profitable is 100%, with 6 winners and 0 losers across the last six midterm election years in this pattern.
- Average profit of 19.44% comes with a 6.38% standard deviation, pointing to a strong but not uniform XLK seasonal trend.
- The TradeWave Ratio of 2.46 indicates that price has typically traveled meaningfully in the long direction within the window, independent of the final close.
- Intraperiod swings have been large in some years, with worst drawdowns exceeding 20% even in windows that ultimately finished higher.
According to historical data from TradeWave.ai, this midterm-election-year stretch has behaved very differently from an average year for XLK, and the next iteration is about to begin.
How has S&P 500 Technology Sector SPDR (XLK) traded in this midterm-year window?
S&P 500 Technology Sector SPDR has closed higher in every single Aug 15–Jul 28 midterm-election-year window in this dataset, averaging a 19.44% gain for long positions. The ETF finished the prior session at 185.48, leaving it about 6.5% below its 52-week high near 198.26 and still well above its 50-day moving average around 183.10. A rare 6.5% two-day surge earlier this week flagged unusually strong volume and momentum in XLK, a move that Finom Group notes has historically been followed by further upside in the fund.[1]
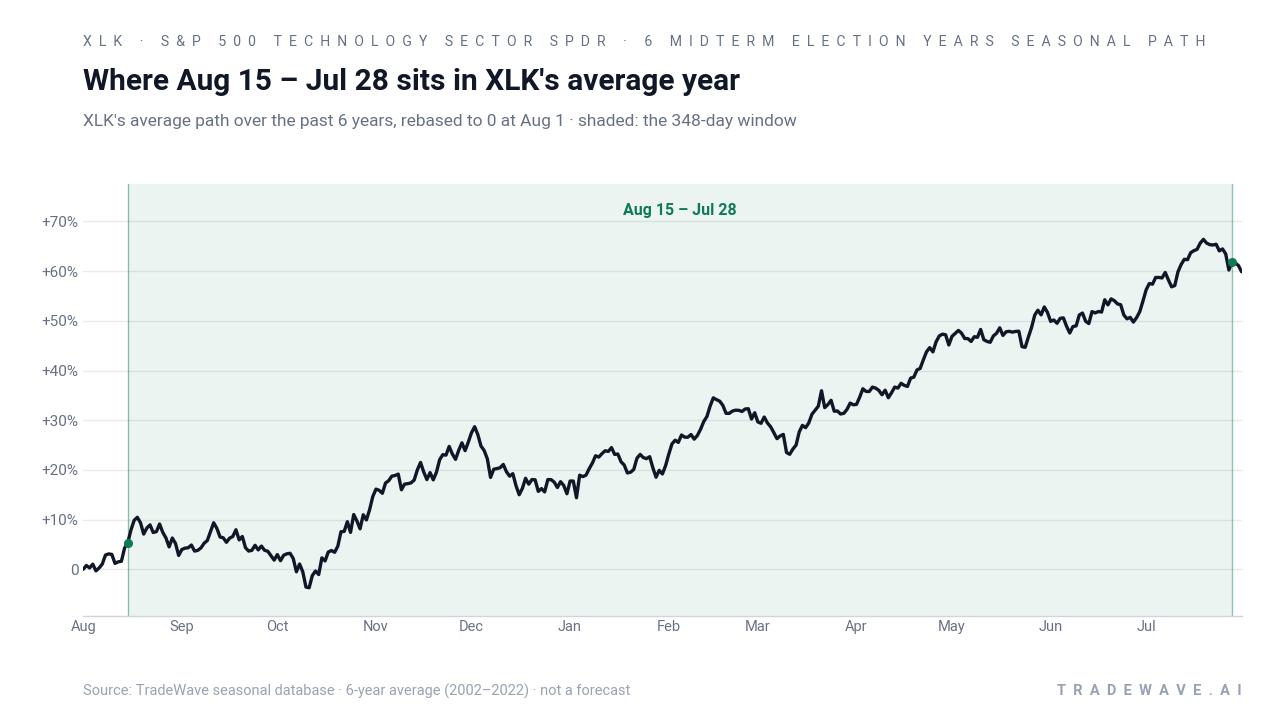
The presidential election cycle matters here because this pattern only looks at midterm election years, a phase that often features policy uncertainty early on and a more supportive liquidity and fiscal backdrop as markets pivot toward the following pre-election year. Pattern phase and calendar phase are aligned: XLK is in a midterm election year today, and the upcoming Aug 15–Jul 28 window spans the back half of this year and most of the year before the presidential election, when risk appetite has often improved.
Across the six midterm-election-year samples since 2002, XLK’s Aug 15–Jul 28 windows have produced a cumulative return of 188%, with an annualized return of 19.29% for this specific slice of the calendar. The strongest year in the sample was 2006, when the ETF gained 27.57% between the Aug 15 entry and the Jul 28 exit, while the softest outcome was 9.78% in 2014. Even that weakest year still delivered a positive double-digit gain for a long trade held through the full S&P 500 Technology Sector SPDR trading window.
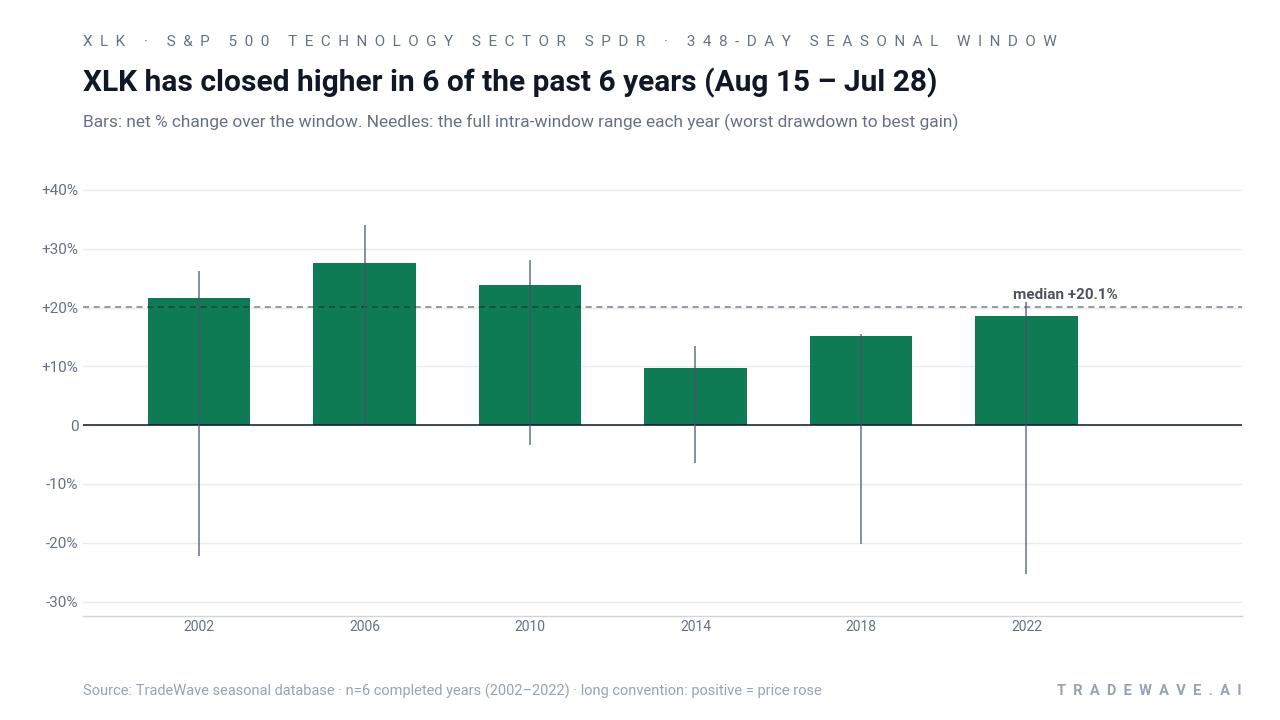
Intraperiod swings have been meaningful. In 2002, XLK’s best point-to-peak move within the window reached 26.28%, but the worst drawdown from the entry level was a deep 22.18% before the ETF recovered to finish higher. In 2018 and 2022, the pattern again combined solid final gains of 15.16% and 18.54% with worst intraperiod declines of 20.22% and 25.28% respectively, underscoring that even historically strong tech seasonal windows can involve sharp air pockets.
A second view stacks each year’s best and worst swings to show how upside and downside have coexisted inside this bullish window.
Put together, the pattern is unusually clean for a long setup: six winners out of six, double-digit average gains, and a Sharpe ratio of 2.45 that reflects strong risk-adjusted returns based on end-of-window outcomes. The catch is that maximum adverse moves have sometimes been large, so the historical edge has come with the need to sit through sizable swings rather than a smooth ride higher.
History does not guarantee future results; adverse excursions can be large even in winning windows, and past XLK seasonal behavior may not repeat.
Why does S&P 500 Technology Sector SPDR (XLK) follow this seasonal pattern?
One likely driver is the way mega-cap tech earnings and guidance cluster in the back half of midterm election years and into the year before the presidential election, when policy visibility often improves and risk appetite returns. Analysts have also pointed to institutional portfolio rebalancing and sector rotation into growth and AI themes during this phase, especially when earlier midterm-year volatility has reset valuations.[2] The result is a recurring XLK seasonal trend where strong fundamental stories and a friendlier macro and policy backdrop have often lined up with this specific Aug-to-Jul trading window.
What is driving S&P 500 Technology Sector SPDR (XLK) today?
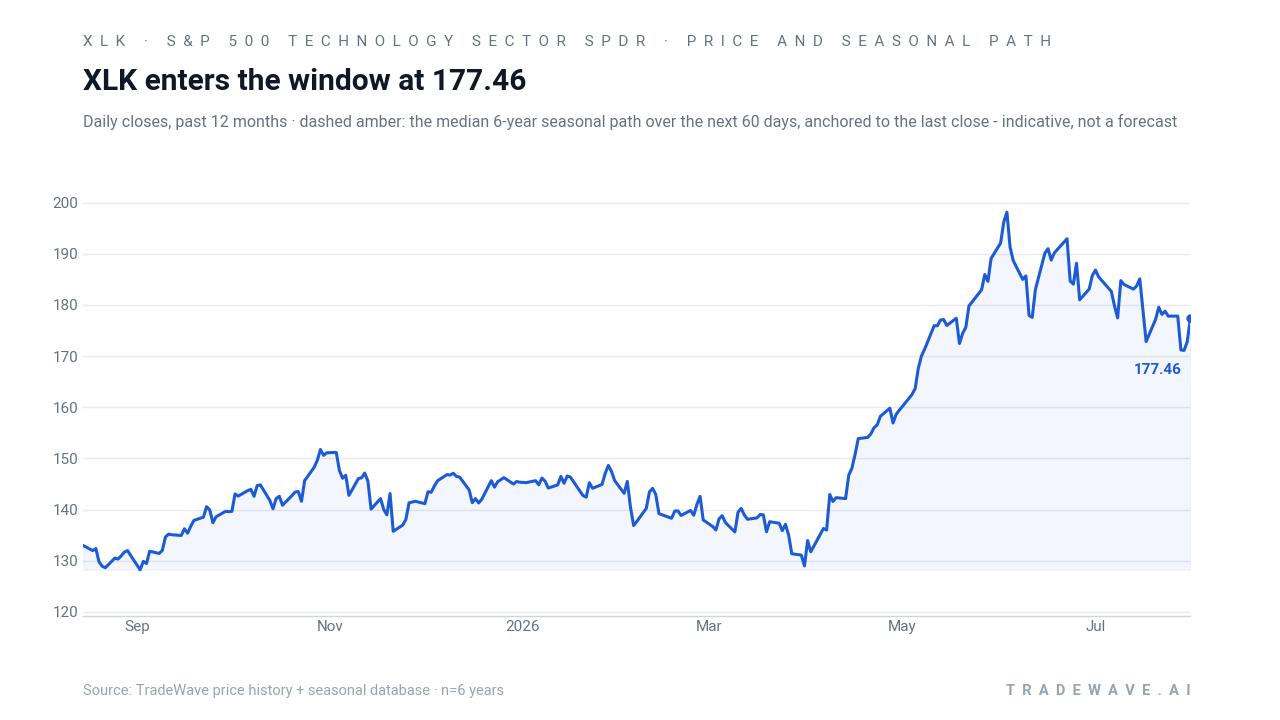
S&P 500 Technology Sector SPDR slipped 0.23% in the prior session to 185.48, easing slightly after a rare two-day, roughly 6.5% surge that Finom Group highlighted as historically bullish for follow-through in the ETF.[1] That move came as investors digested heavyweight earnings from Microsoft and Apple, which kept the broader tech sector and XLK in focus and reinforced the AI-driven earnings narrative supporting the fund’s largest holdings.[1][2]
Flows and leadership inside tech remain mixed. A late-July sector roundup listed XLK among the top “buy on the dip” ETF candidates thanks to strong multi-period performance, even as software-focused funds saw outflows and pressure, underscoring that chips, AI infrastructure and select SaaS names are doing more of the heavy lifting.[2][3] In mid-April, technical analysis already flagged XLK’s rebound toward record highs, with support in the $130–$135 zone and demand tied to semiconductors and cloud infrastructure, context that helps explain why the ETF has been quick to bounce from pullbacks this year.[4]
The chart below shows XLK’s past year of trading alongside a 60-day seasonal projection, giving a sense of how the historical pattern lines up with the current tape.
What should traders watch as this XLK seasonal window approaches?
First, the calendar: the Aug 15 start date is only days away, and the window runs deep into the year before the presidential election, a phase that has historically been friendlier for risk assets than the choppier early midterm months. Second, levels: traders will be watching whether XLK can retest and hold above the 52-week high near 198.26 during the window, and whether pullbacks stay contained around or above the 50-day moving average near 183.10.
Third, behavior relative to the pattern: in prior cycles, XLK has often seen sizable drawdowns inside the window before finishing higher, so a sharp dip would not automatically contradict the historical XLK seasonal trend as long as buyers eventually step back in. Finally, the recent volume and momentum spike bears monitoring; if the rare 6.5% two-day rally is followed by continued strong participation and constructive breadth in mega-cap tech, it would echo the historical tendency for powerful midterm-year windows to build on early strength rather than fade it.[1]
Sources
About this seasonal analysis
Seasonal pattern data is sourced from TradeWave.ai, which analyzes historical price behavior across annual calendar windows going back up to 30 years. Read the full data methodology or the book The 100-Year Pattern by Afshin Moshrefi (2026 edition). Past performance of seasonal patterns does not guarantee future results. This article is for informational purposes only and does not constitute investment advice.