This 352-Day Window Has Delivered 218% Cumulative Gains for S&P 500 Technology Sector SPDR (XLK)
S&P 500 Technology Sector SPDR is entering a 352-day midterm-year seasonal window with a perfect win record just as the ETF trades about 5.4% below its 52-week high and rides a powerful AI-led tech surge.

What is the seasonal pattern for S&P 500 Technology Sector SPDR (XLK)?
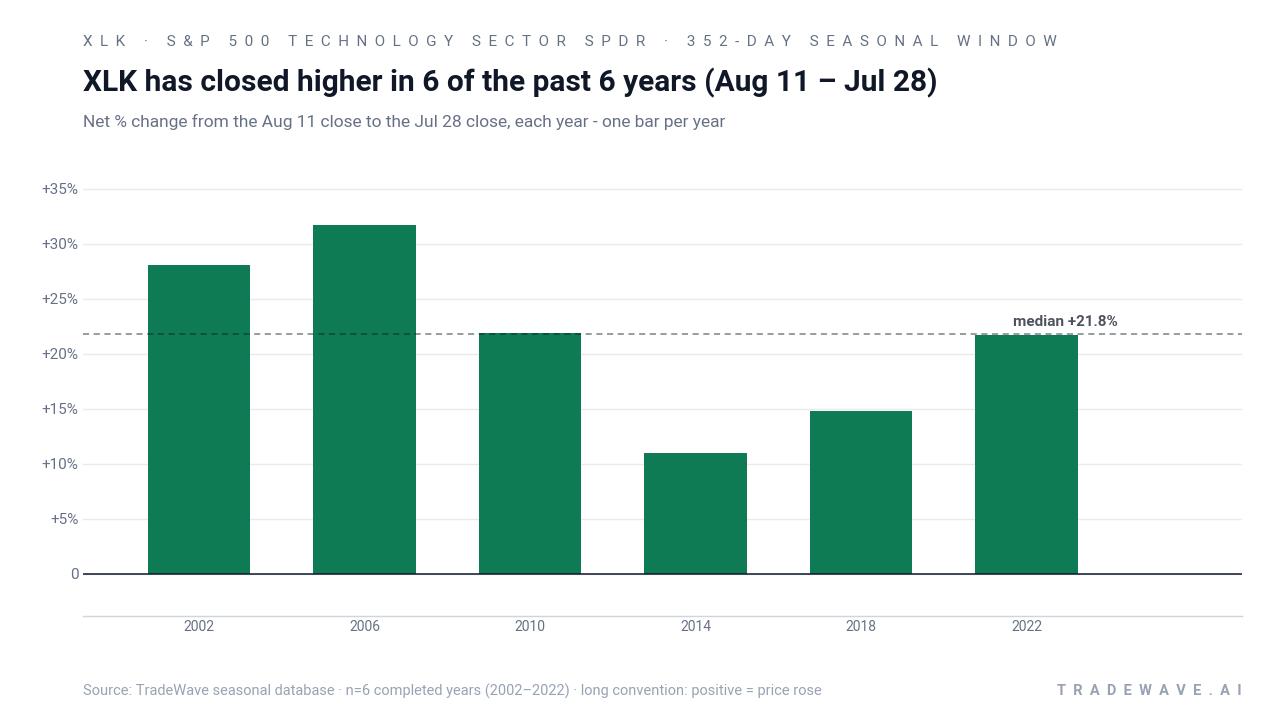
S&P 500 Technology Sector SPDR has risen in 6 of 6 midterm-year Aug 11–Jul 28 windows, with an average gain of 21.51% in winning years.
- 6 for 6 in this window, with XLK posting gains every time across the last six midterm election years.
- Seasonal window runs from Aug 11 through Jul 28, spanning 352 days and covering the late midterm year into the heart of the pre-election year.
- Percent Profitable is 100%, with 6 winners and 0 losers across the historical sample.
- Average profit in winning years is 21.51%, compounding to a 218% cumulative gain when the window is stacked across cycles.
- The TradeWave Ratio is 2.27, and the Sharpe ratio is 2.27, pointing to strong risk-adjusted returns for this long-biased pattern.
- Intraperiod swings have still been meaningful, with some years showing double-digit drawdowns before finishing higher, so volatility has been part of the ride.
According to historical data from TradeWave.ai, this midterm-year stretch in XLK has behaved very differently from an average calendar year, and the next iteration of that pattern begins today.
How strong is the upcoming seasonal window for S&P 500 Technology Sector SPDR (XLK)?
The seasonal window that starts on Aug 11 and runs through Jul 28 has delivered gains for S&P 500 Technology Sector SPDR in every one of the last six midterm election years, averaging 21.51% per cycle. XLK enters this 352-day stretch around 187.97, about 5.4% below its 52-week high of roughly 198.26 and up 30.88% year to date. That combination of a strong historical seasonal trend and a still-elevated but off-peak price backdrop gives this window unusual weight for traders watching the tech-heavy ETF.
Because this pattern is grouped by presidential election cycle, it specifically reflects how tech has behaved from late in the midterm election year into the following pre-election year, a phase that has often coincided with clearer policy visibility and a friendlier liquidity backdrop for growth stocks. For XLK, that means the historical gains in this window are not just about the calendar but about where the sector tends to sit in Washington’s four-year policy rhythm.
Across the six completed midterm-year samples from 2002 through 2022, the trade direction for this window is long, and every instance finished positive. The strongest year in the set was 2006, when XLK gained 31.65% between the Aug 11 entry and the Jul 28 exit, while the softest outcome was 10.99% in 2014. Add it up and stacking those six windows compounds to a 218% cumulative gain, which is unusually high for a single recurring slice of the calendar.
Intraperiod behavior has not been a straight line. In 2002, XLK’s best point-to-peak move within the window reached 32.9%, but the worst drawdown from entry was a deep 18.1% before the ETF recovered into the close. In 2022, the maximum favorable move was 24.07%, while the worst adverse excursion hit 23.31%, underscoring that even winning years have featured sharp pullbacks along the way.
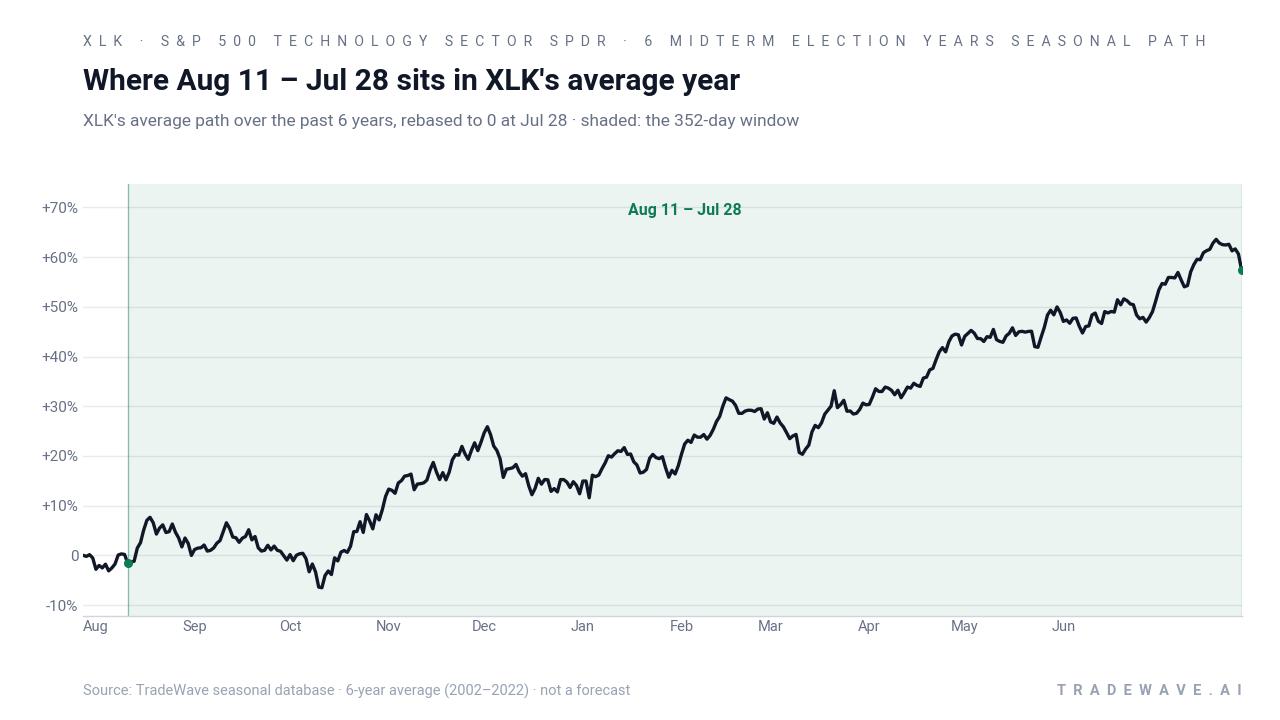
The typical path, as captured by the historical seasonal average, shows XLK tending to grind higher through much of the window rather than front-loading all of the gains. That fits with the structure of the presidential cycle, where midterm-year volatility often gives way to a more persistent risk-on tone as the pre-election year unfolds. For traders, the message is that the XLK seasonal trend has historically rewarded patience across this 352-day stretch rather than quick in-and-out moves.
Year-by-year ranges highlight how those steady average gains have come with sizable swings between worst drawdowns and best rallies.
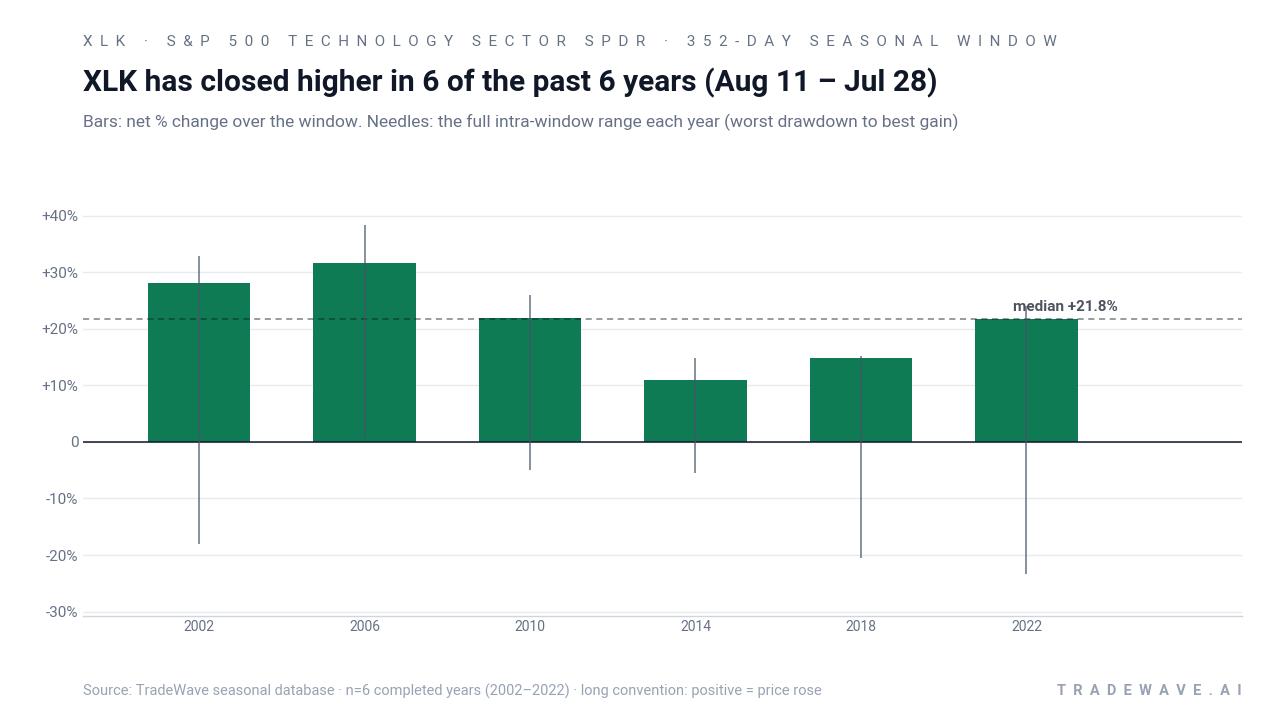
History does not guarantee future results; adverse excursions can be large even in winning windows, and traders should be prepared for volatility inside the pattern.
Why does S&P 500 Technology Sector SPDR (XLK) follow this seasonal pattern?
One likely driver is the way tech earnings, capital spending and policy clarity cluster between late midterm years and the following pre-election years, when Washington often shifts from tightening to a more market-friendly stance. Analysts have also pointed to institutional portfolio rebalancing and sector rotation into growth as macro uncertainty around the midterms fades, which can funnel flows into large-cap tech. For XLK, whose top holdings are mega-cap AI and software names, that combination of clearer policy, strong earnings visibility and renewed risk appetite may help explain why this long midterm-year window has repeatedly skewed positive.
What is driving S&P 500 Technology Sector SPDR (XLK) today?
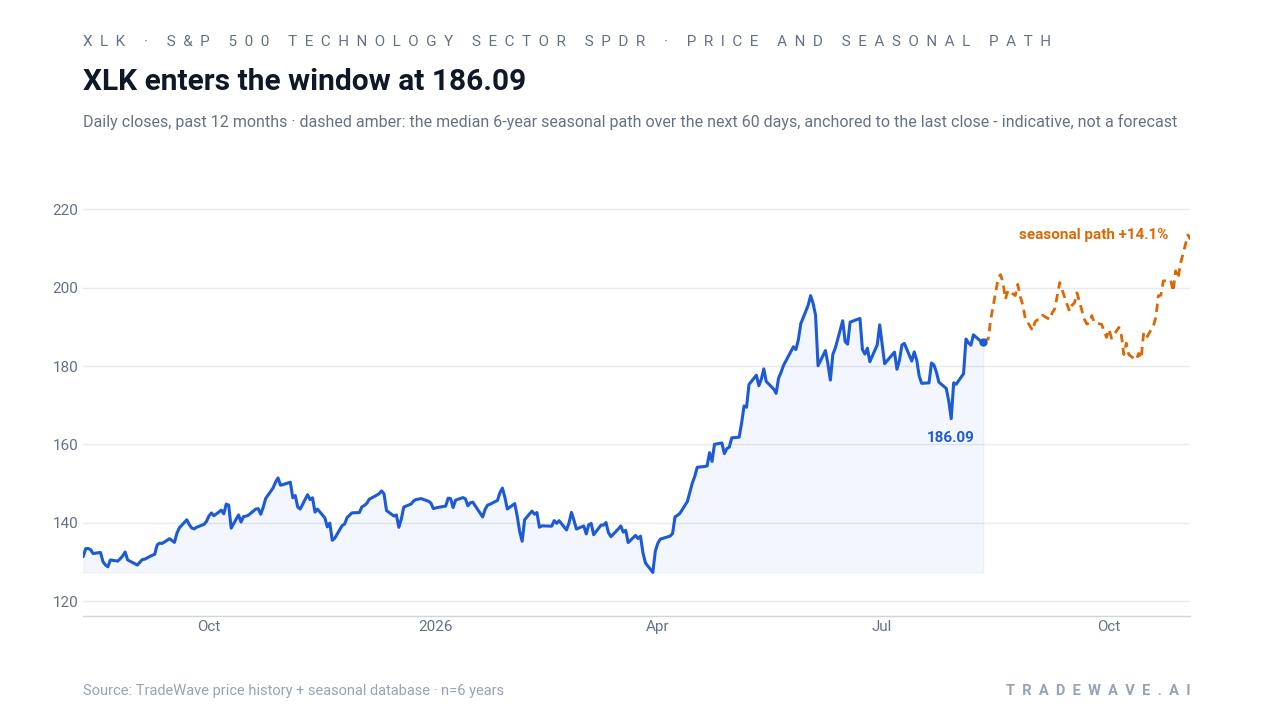
S&P 500 Technology Sector SPDR traded around 187.97 on Aug 11, up 1.42% on the day and roughly 30.88% year to date, leaving it about 5.4% below its 52-week high near 198.26.[3] The ETF has been one of the main engines of the broader market, helped by heavy weights in Apple, Nvidia and Microsoft and a portfolio that is more than 99% technology by sector exposure.[1] Over the past year, XLK has delivered roughly 54% gains in some measures, but that strength has come with elevated volatility and a widening gap between the biggest AI winners and the rest of the sector.[1]
Under the surface, positioning and insider behavior have turned more supportive. Corporate insider buying within XLK components has reached a record reading, signaling elevated internal confidence even as the ETF has swung around its highs.[1] At the same time, reported trading volume of about 6,037,382 shares compares with an average near 12,076,251, suggesting that the latest leg higher has not yet been driven by a surge in speculative turnover.[3] For a sector that has become a proxy for AI infrastructure and semiconductor demand, that mix of strong price performance, record insider buying and only moderate volume leaves room for both continuation and sharp shakeouts if macro or policy headlines shift.[1]
The chart below situates the latest move in its recent multi-month context alongside the historical 60-day seasonal projection.
What should traders watch in this XLK seasonal window?
First, the calendar itself matters. This 352-day stretch bridges the back half of the midterm election year into the pre-election year, a phase that has historically been friendlier to risk assets than the choppy early-midterm period. For XLK, behavior around key policy and regulatory dates, including any shifts in AI or antitrust oversight, will help confirm whether this cycle rhymes with prior midterm-to-pre-election transitions.
Second, price levels around the 52-week high near 198.26 and the 50-day moving average around 183.19 will be important reference points.[3] A sustained break above the prior high with pullbacks holding near the 50-day line would be consistent with the historical pattern of persistent gains across the window. Repeated failures near the highs or a decisive break below the 50-day average would signal that this cycle may diverge from the clean 6-for-6 track record.
Third, traders should keep an eye on insider and volume dynamics. Record-high insider buying velocity within XLK components has been a notable tailwind; if that pace cools or reverses while price grinds higher, it would suggest less conviction behind the move.[1] Conversely, if insider activity stays strong and volume begins to expand on up days, it would echo prior winning windows where institutional and corporate demand helped absorb volatility.
Finally, watch how XLK trades around major macro prints and earnings seasons for its top holdings. As an ETF heavily tilted toward AI infrastructure and semiconductor giants, XLK is sensitive to any shift in the narrative around AI spending, cloud demand and capital expenditure cycles.[1] If pullbacks around those catalysts resemble the historical pattern of sharp but ultimately contained drawdowns followed by renewed highs, it would fit the established seasonal trend. A break from that script, especially if accompanied by policy or regulatory surprises, would be the clearest sign that this midterm-year window is writing a different story.
Sources
About this seasonal analysis
Seasonal pattern data is sourced from TradeWave.ai, which analyzes historical price behavior across annual calendar windows going back up to 30 years. Read the full data methodology or the book The 100-Year Pattern by Afshin Moshrefi (2026 edition). Past performance of seasonal patterns does not guarantee future results. This article is for informational purposes only and does not constitute investment advice.