Nasdaq QQQ Invesco ETF (QQQ) Has Risen in 6 of 6 Midterm Windows, Averaging 20% Gains
Nasdaq QQQ Invesco ETF is trading just off record highs as it approaches a 346-day midterm-year seasonal window that has never finished lower in this sample, putting a powerful historical tailwind behind an already tech-heavy rally.

What is the seasonal pattern for Nasdaq QQQ Invesco ETF (QQQ)?
Nasdaq QQQ Invesco ETF has risen in 6 of 6 midterm-election-year windows starting around Aug 18, with an average gain of 20.08% in winning years.
- 6 for 6 in this window, with Nasdaq QQQ Invesco ETF averaging 20.08% gains across all completed midterm-year cycles.
- The upcoming 346-day Nasdaq QQQ Invesco ETF trading window runs from Aug 18 to Jul 29 and has historically favored long exposure.
- Percent Profitable is 100%, with 6 winners and 0 losers across the last six midterm election years in this pattern.
- Average profit in winning years is 20.08%, with a median outcome of 21.22%, pointing to a consistently strong QQQ seasonal trend.
- Individual years have seen maximum favorable moves of more than 30% but also intraperiod drawdowns approaching 20% to 23% before finishing higher.
- The pattern compounds to a 196% cumulative return when the window is repeated across all six historical midterm-year samples.
According to historical data from TradeWave.ai, this midterm-year stretch has behaved very differently from an average calendar year for QQQ, with a distinct long-biased seasonal regime that investors rarely see discussed in day-to-day market coverage.
How has Nasdaq QQQ Invesco ETF (QQQ) traded in this midterm-year window?
Nasdaq QQQ Invesco ETF has finished higher in every one of the last six midterm election years during the 346-day window that begins on Aug 18, averaging gains of just over 20%. The ETF last traded around 720.87, leaving it about 3.5% below its 52-week high near 747 and well above its 52-week low around 553, so it is heading into this historically strong stretch from a position of strength.
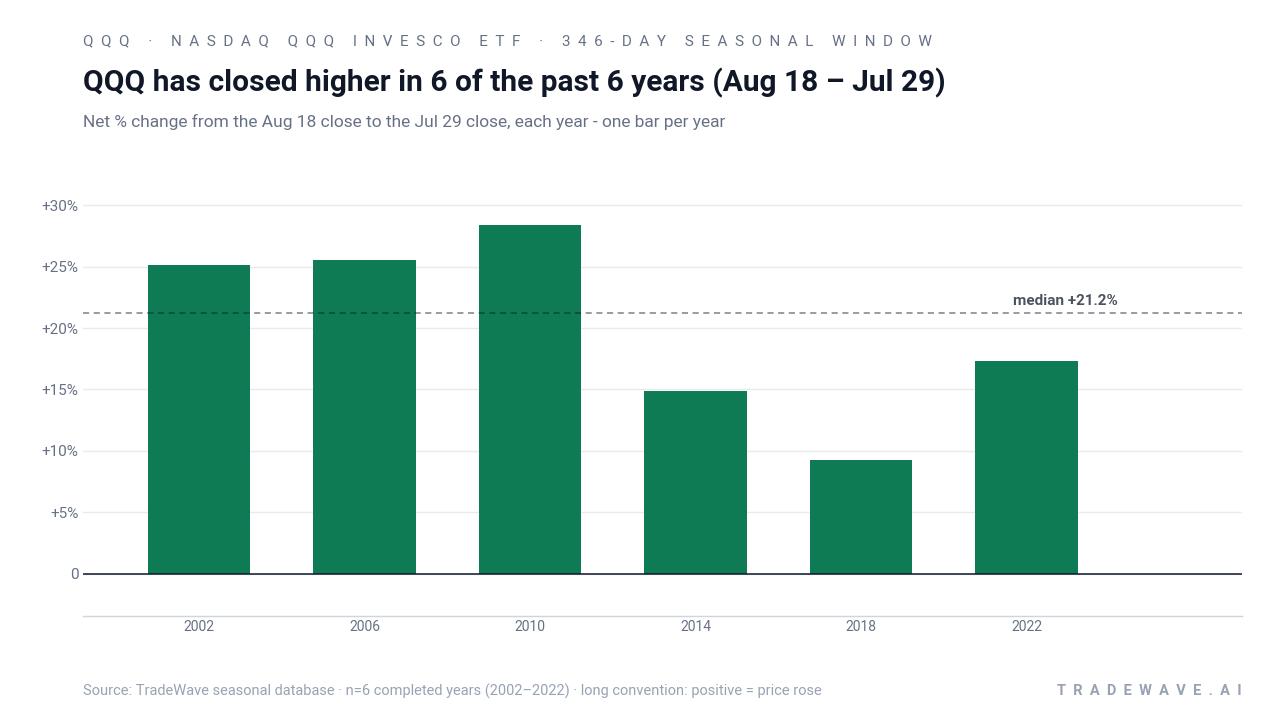
The pattern is built on the last six midterm election years, a phase of the presidential cycle that often features heavy policy debate, shifting rate expectations and periodic volatility in growth stocks. In this specific Nasdaq QQQ Invesco ETF trading window, that noise has historically resolved in favor of the bulls, with every sample year closing the window in positive territory.
Across those six years, the average profit of 20.08% and median profit of 21.22% show that the typical outcome has not been a marginal grind higher but a sizable move. Add it up and repeating the window across all six midterm-year samples would have compounded to a 196% cumulative gain, even though the underlying macro and rate backdrops varied widely from 2002 to 2022.
Individual years underline both the opportunity and the risk. The strongest net return in the sample came in 2010, when QQQ gained 28.35% between the Aug 18 entry and the Jul 29 exit, after reaching a maximum favorable move of 32.4% at the best point in the window. The softest outcome was 2018, which still finished up 9.25% but saw a maximum adverse move of about 19.79% along the way as tech stocks were hit during that year’s volatility episodes.
Those intraperiod swings show up clearly in the maximum favorable excursion and maximum adverse excursion profile. In 2002 and 2022, for example, QQQ ultimately finished the window higher by 25.1% and 17.35% respectively, yet both years saw worst drawdowns in the region of 22% from the entry before recovering. That combination of strong final gains and deep interim dips is what drives the TradeWave Ratio of 2.13, which measures how far price typically travels in the trade direction within the window regardless of where it closes.
A second view stacks each year’s net result with its best and worst intraperiod swings to show the full range of outcomes.
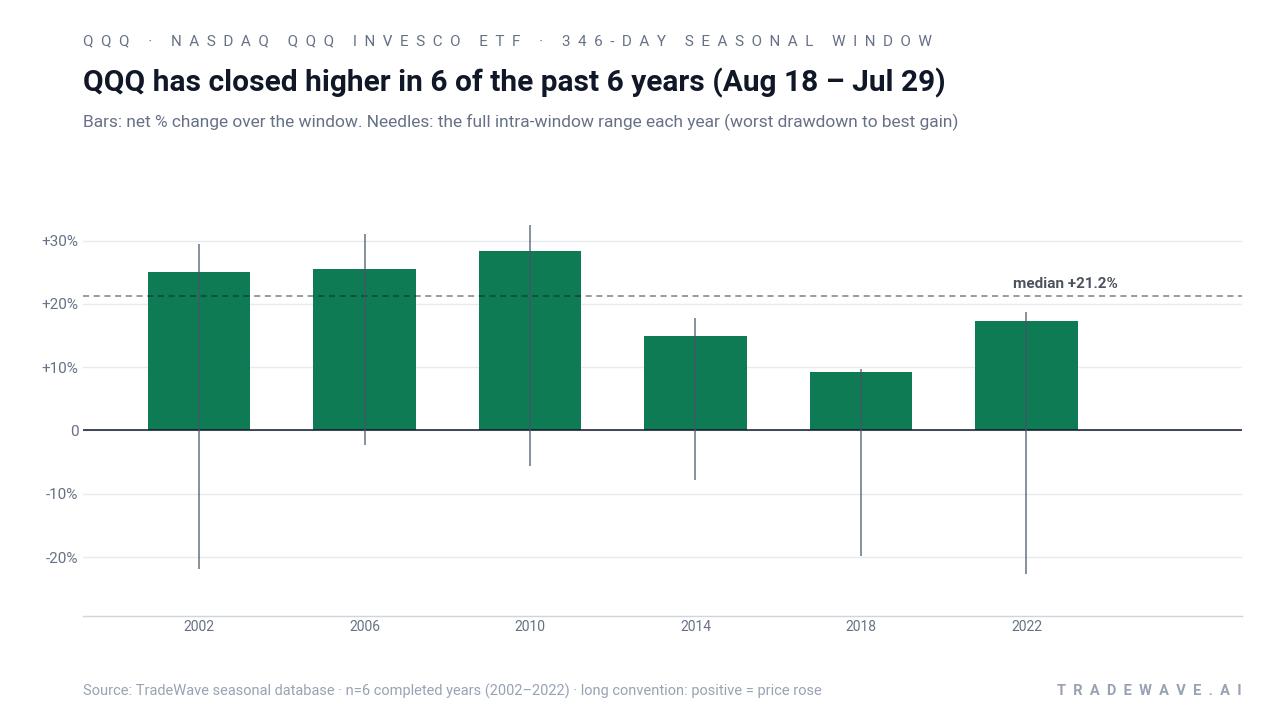
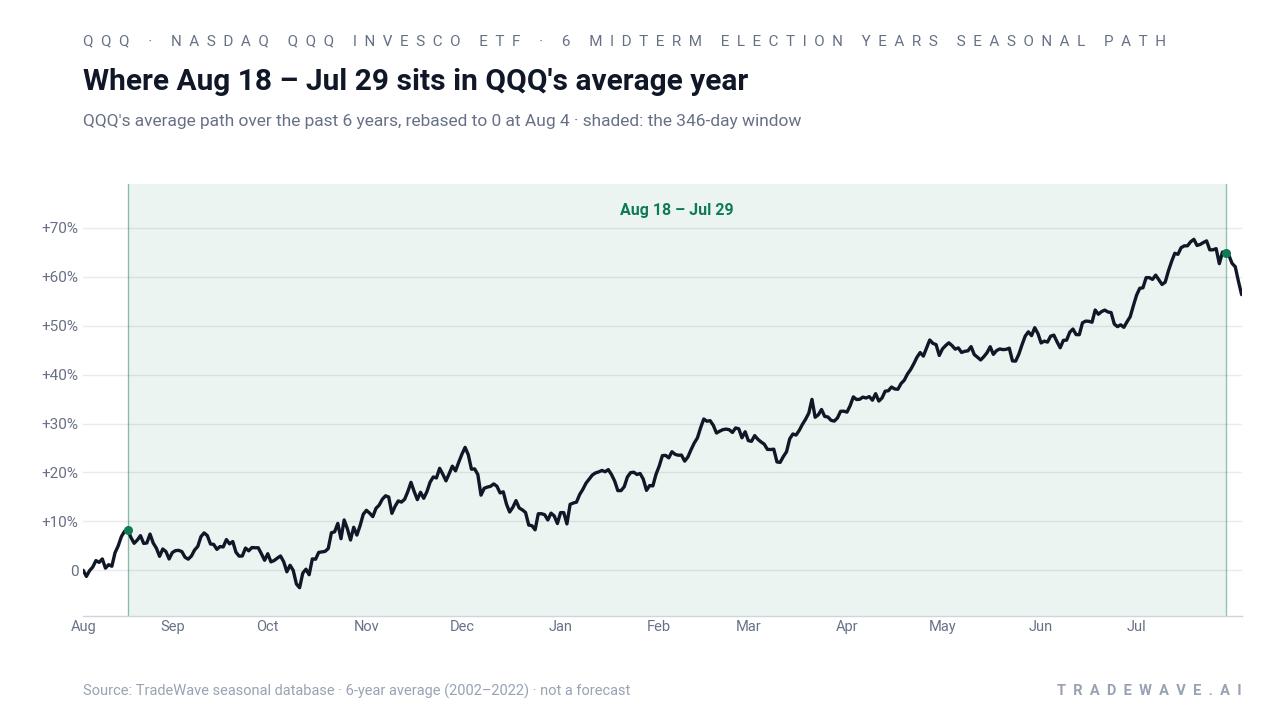
Viewed together, the historical seasonal average and the per-year range chart tell a simple story: this has been a long-biased regime for QQQ, but not a smooth one. Every sample year has delivered a positive finish, yet several have included double-digit drawdowns before the eventual recovery, which matters for anyone sizing risk around this pattern.
History does not guarantee future results; adverse excursions can be large even in winning windows, and past midterm-year behavior may not repeat in the current cycle.
Why does Nasdaq QQQ Invesco ETF (QQQ) follow this seasonal pattern?
One likely driver is the way the presidential election cycle shapes risk appetite for growth stocks, with midterm years often seeing policy uncertainty early on and renewed risk-taking as the political outlook clears. Analysts also point to the clustering of big-tech earnings, index rebalancing and institutional portfolio repositioning across this late-summer-to-summer span, which can funnel flows into Nasdaq 100 names. This QQQ seasonal pattern may reflect that combination of policy clarity, earnings momentum and systematic buying that tends to build from late in the midterm year into the following pre-election year.
What is driving Nasdaq QQQ Invesco ETF (QQQ) today?
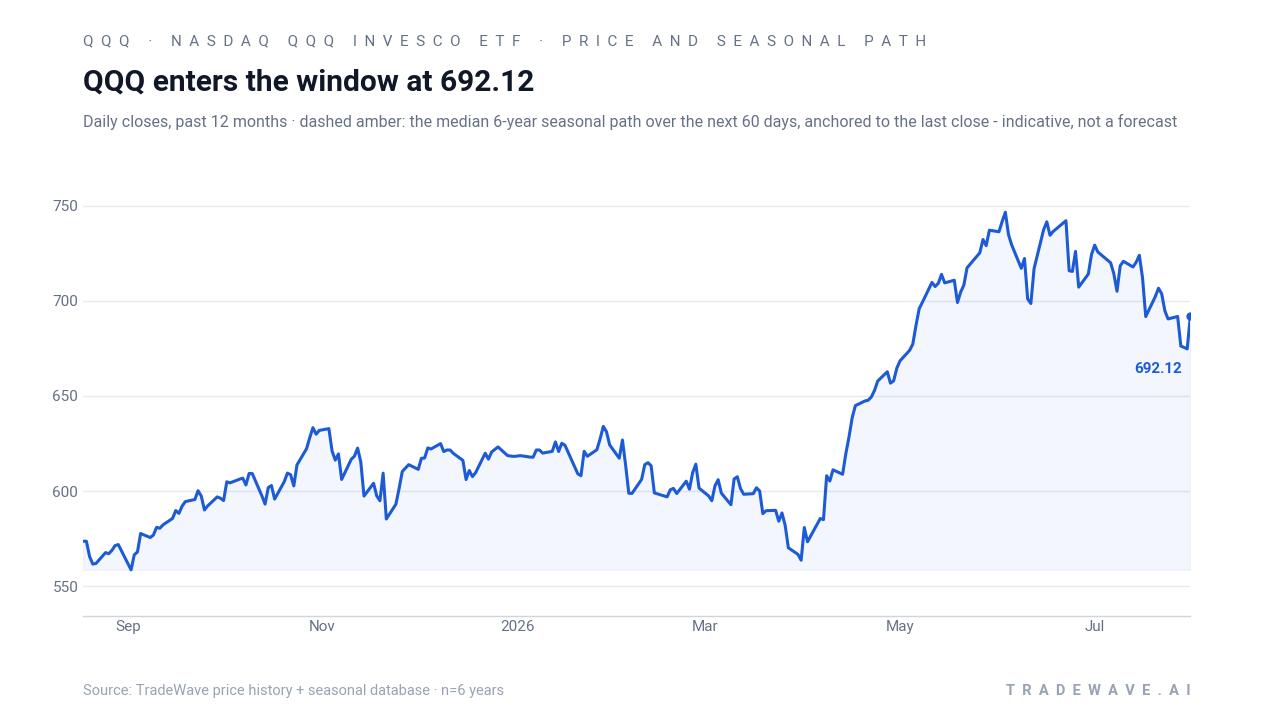
Nasdaq QQQ Invesco ETF slipped about 0.3% in the latest session to roughly 720.87, leaving it about 3.5% below its 52-week high near 747 and far above its 52-week low around 553. A powerful tech-led surge on Aug 5 delivered one of the most bullish single-day readings for the Nasdaq 100 in a decade, with heavy call demand and elevated options volume signaling aggressive positioning in growth and mega-cap names that dominate QQQ’s basket.[2] That move was followed by a weaker U.S. jobs report on Aug 7 that eased rate-hike fears and supported the index, even as Middle East tensions and higher oil prices briefly pressured risk assets on Aug 6.[2]
The chart below shows how that mix of macro headlines and options-driven flows has played out across the past year, alongside a historical seasonal projection for the next two months.
What should traders watch as this QQQ seasonal window approaches?
First, the calendar. The new 346-day window begins on Aug 18, so any pullback or consolidation into that date will shape how stretched or reset QQQ is when the historical pattern kicks in. Traders will be watching whether the ETF holds above its 50-day moving average near 713.79 or retests that level as support, given its proximity to the current price.
Second, the macro tape. The weak jobs report earlier in August cooled rate-hike expectations, which tends to favor long-duration growth stocks that dominate QQQ, but that backdrop can change quickly with the next round of labor and inflation data.[2] If bond yields stay contained and earnings from the largest Nasdaq 100 constituents remain solid, the historical midterm-year tailwind could align with a supportive macro environment.
Third, options and volume. The early-August surge in Nasdaq 100 options activity, particularly on the call side, showed how quickly positioning can swing when sentiment turns.[2] If that elevated activity persists into and through the Aug 18 start date, it would suggest traders are leaning into the same upside that the historical QQQ seasonal trend has delivered in prior midterm years; a sharp fade in call demand or a spike in downside hedging would argue for a more cautious read.
Finally, behavior inside the window will matter as much as the start. In past cycles, some of the strongest years still saw 15% to 20% drawdowns before finishing higher, so a sharp dip would not automatically contradict the pattern. What would break from history is a sustained failure to recover those drawdowns over the course of the window or a year that ultimately closes the Aug 18 to Jul 29 span in the red. For investors who track seasonality, how QQQ trades across this next midterm-year stretch will be an important test of whether this six-for-six record can extend to a seventh cycle.
Sources
About this seasonal analysis
Seasonal pattern data is sourced from TradeWave.ai, which analyzes historical price behavior across annual calendar windows going back up to 30 years. Read the full data methodology or the book The 100-Year Pattern by Afshin Moshrefi (2026 edition). Past performance of seasonal patterns does not guarantee future results. This article is for informational purposes only and does not constitute investment advice.