S&P 500 Technology Sector SPDR (XLK) Has Rallied in Every Midterm Stretch, Averaging 19.44%
S&P 500 Technology Sector SPDR is entering a 348-day midterm-year seasonal window that has never been negative in the data, just as tech valuations reset after a historic momentum burst.

What is the seasonal pattern for S&P 500 Technology Sector SPDR (XLK)?
S&P 500 Technology Sector SPDR has risen in 6 of 6 midterm-year windows from Aug 15 to Jul 28, with an average gain of 19.44% in winning years.
- 6 for 6 in this window, with XLK posting gains every time and averaging 19.44% in those winning years.
- Seasonal window runs roughly 348 days from Aug 15 to Jul 28 across the last 6 midterm election years.
- Percent Profitable is 100%, with 6 winners and 0 losers in the historical sample.
- Average profit of 19.44% compares with a cumulative return of 188% when stacking the window across all six cycles.
- TradeWave Ratio of 2.46 suggests price has typically traveled meaningfully in the long direction within the window, independent of the final close.
- Sharpe ratio of 2.45 indicates a historically strong risk-adjusted profile for this XLK seasonal trend.
According to historical data from TradeWave.ai, this long midterm-year stretch has behaved very differently from an average calendar year for XLK, and the next iteration has just begun.
How has S&P 500 Technology Sector SPDR (XLK) traded in this midterm-year window?
S&P 500 Technology Sector SPDR has closed higher in every single Aug 15 to Jul 28 midterm-year window in the dataset, averaging 19.44% gains across six cycles. The ETF entered the latest iteration of this 348-day stretch around the 191 level, leaving it well above its 50-day moving average of 182.72 and within sight of a 52-week high near 198.26. That combination of a clean 6-for-6 historical record and a fresh breakout backdrop makes this XLK seasonal pattern hard for macro-focused traders to ignore.
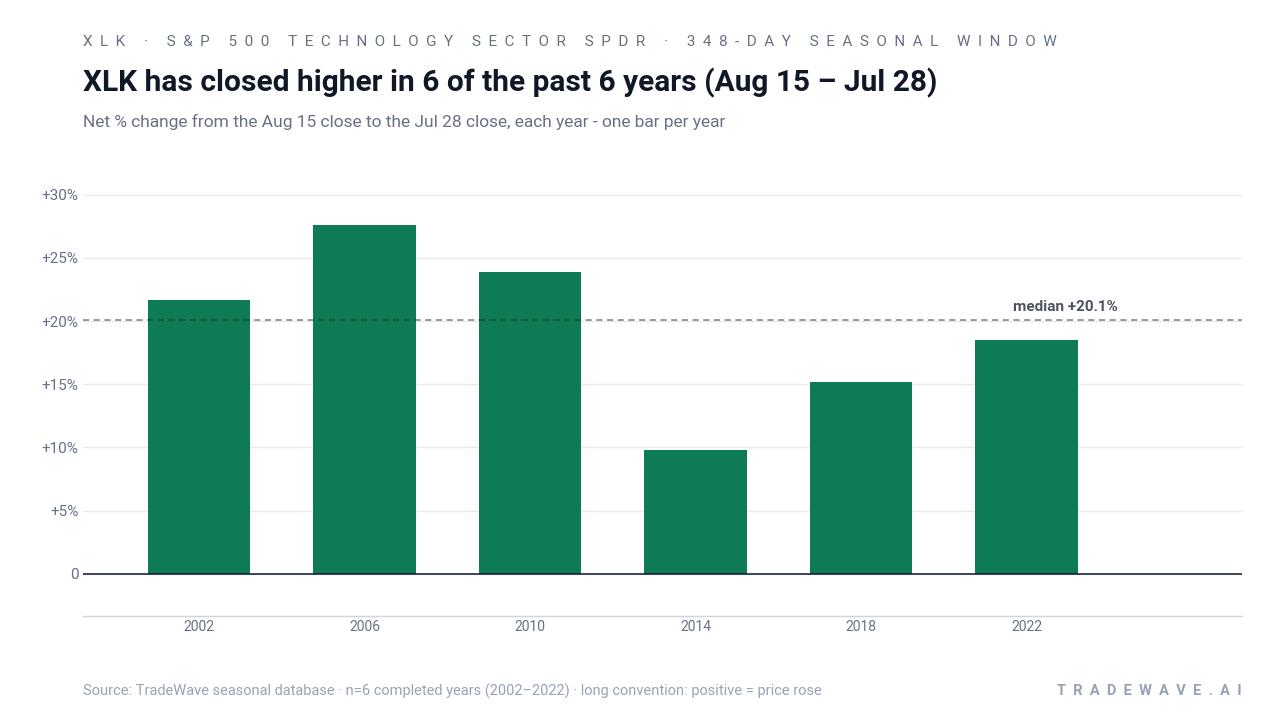
The pattern is grouped by the presidential election cycle, focusing only on midterm election years rather than a simple run of consecutive calendar years. That matters because policy, regulation and liquidity often follow a four-year rhythm, and tech leadership has tended to respond sharply to those shifts.
Across the six midterm-year samples from 2002 through 2022, XLK’s net returns in this window ranged from about 9.78% in 2014 to 27.57% in 2006. The strongest year, 2006, saw the ETF climb from roughly 7.84 to 10.00, while the weakest winner, 2014, still delivered nearly double-digit gains from about 17.03 to 18.70. Even in more volatile cycles such as 2018 and 2022, the window finished positive despite sizable swings along the way.
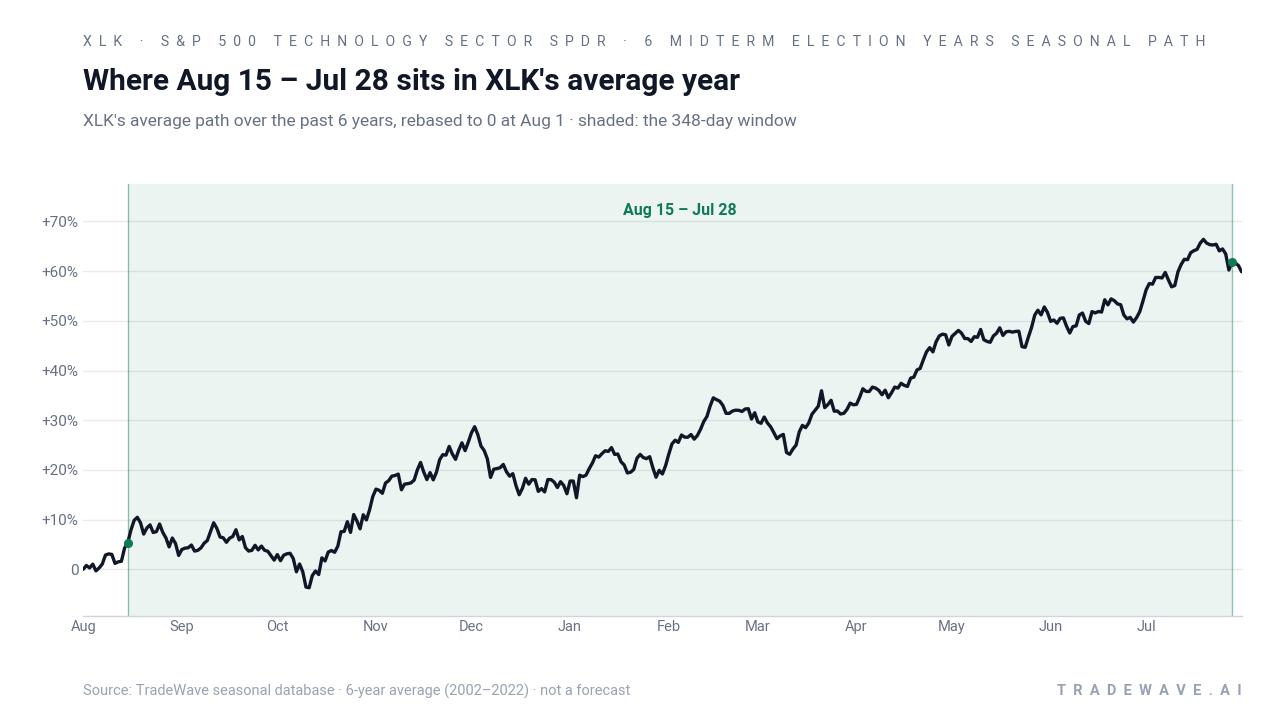
The historical seasonal average shows XLK tending to grind higher through much of the window rather than spiking in a single burst. Gains have often built steadily from the early autumn entry, with pullbacks along the way but a clear upward bias into the following summer.
A closer look at yearly ranges shows how much XLK has typically moved inside the window before settling at those positive closes.
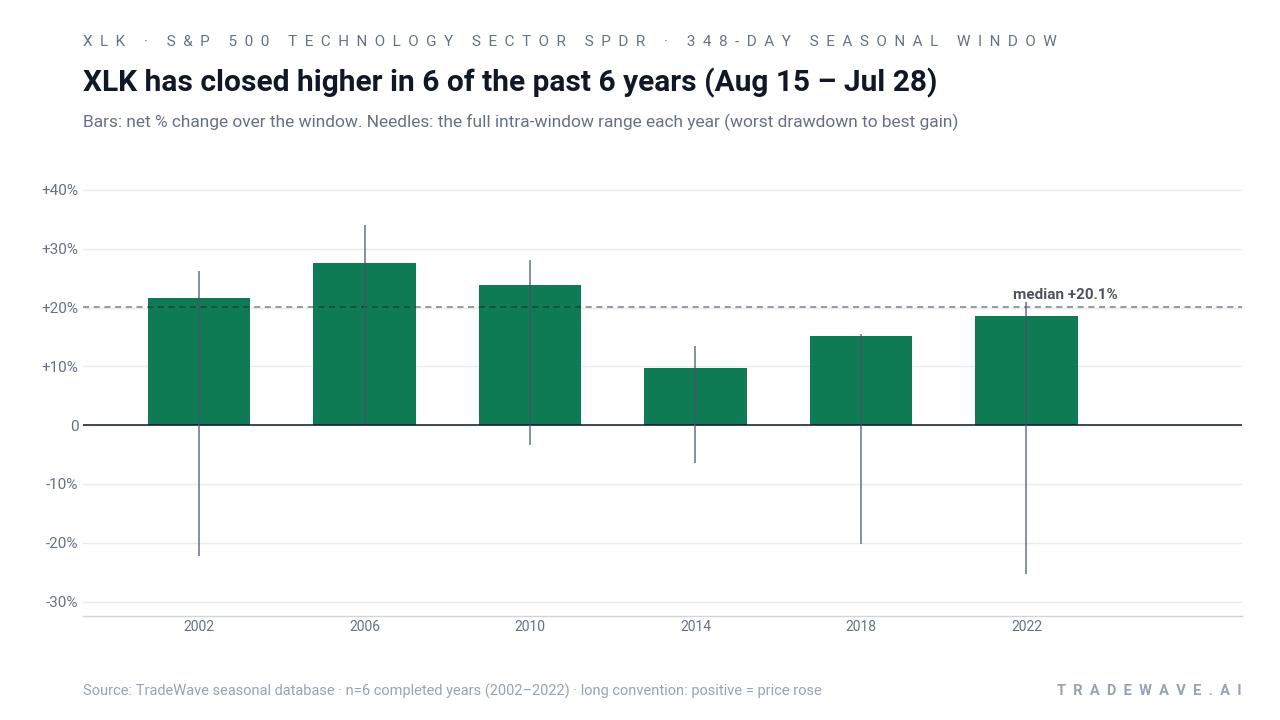
The bar-and-range view highlights that while every year finished higher, the path was not smooth. In 2002, for example, XLK’s best intraperiod move reached about 26.28% above the entry, but the worst drawdown within the same window ran roughly 22.18% below. In 2018 and 2022, maximum adverse moves of about 20.22% and 25.28% respectively sat alongside solid final gains, underscoring that this has been a high-conviction long window with real downside swings along the way.
History does not guarantee future results; adverse excursions can be large even in winning windows, and traders should treat the historical MAE profile as a reminder that drawdowns have been part of the ride.
Why does S&P 500 Technology Sector SPDR (XLK) follow this seasonal pattern?
One likely driver is the way tech earnings, product launches and capital spending plans cluster from late summer through the following summer, which can keep large-cap technology in focus for multiple quarters. Analysts have also pointed to institutional portfolio rebalancing around the midterm election year, as investors reposition for policy shifts that often favor growth and innovation. The pattern may also reflect a broader “risk-on” tendency in the midterm-to-pre-election stretch, when political uncertainty starts to clear and liquidity conditions often stabilize.
What is driving S&P 500 Technology Sector SPDR (XLK) today?
XLK comes into this midterm-year seasonal window on the back of a historic momentum run, with the ETF having rallied more than 50% in just 45 trading days, its strongest 45-day rate-of-change since data began in 1999.[1] That surge was powered by mega-cap tech and a powerful move in the PHLX Semiconductor Index, which logged one of its strongest advances on record, second only to the March 2000 spike.[1] At the same time, technology’s forward price-to-earnings multiple compressed by roughly 30% from a year earlier at its July low, leaving valuations reset even as the broader S&P 500 hovered near record levels.[1]
The chart below shows how that momentum and valuation reset intersect with the new seasonal window.
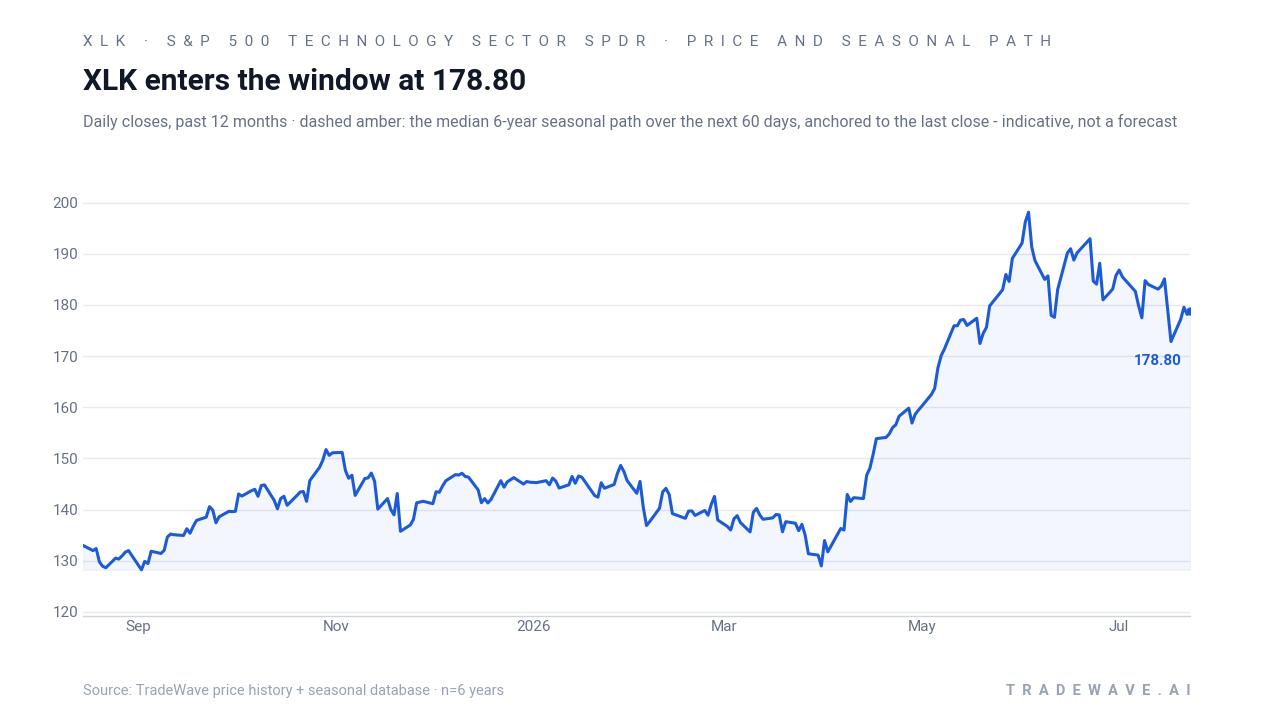
The combination of a record 45-day surge and a long midterm-year window that has never finished negative gives this setup a different flavor than a typical breakout.[1] On one hand, the historical XLK seasonal trend has favored staying long through volatility, with every prior midterm-year sample ultimately rewarding patience. On the other, the intraperiod drawdowns in 2002, 2018 and 2022 show that even strong seasonal regimes can include sharp air pockets, especially when valuations and positioning have just swung hard.
What should traders watch in this XLK seasonal window?
Three things stand out for this cycle. First, the 52-week high near 198.26 is a natural reference point: in prior midterm-year windows, XLK has often consolidated below resistance before grinding higher, so how the ETF behaves around that band will show whether the historical pattern is reasserting or stalling. Second, the 50-day moving average near 182.72 is the first line in the sand for seasonal pullbacks; past windows have tolerated sizable drawdowns, but sustained breaks below key trend lines have usually coincided with the deeper MAE episodes seen in 2002, 2018 and 2022.
Third, traders should keep an eye on whether the recent momentum regime cools or extends. The prior 45-day surge was the strongest on record for XLK, and it arrived alongside one of the most powerful semiconductor rallies since the dot-com era.[1] If that momentum fades while the seasonal window remains historically supportive, it would suggest the pattern is being challenged by macro or policy forces. If, instead, tech leadership and semiconductor strength persist into the autumn, it would line up cleanly with the midterm-year seasonal tendency for XLK to build gains gradually over this 348-day stretch.
Sources
About this seasonal analysis
Seasonal pattern data is sourced from TradeWave.ai, which analyzes historical price behavior across annual calendar windows going back up to 30 years. Read the full data methodology or the book The 100-Year Pattern by Afshin Moshrefi (2026 edition). Past performance of seasonal patterns does not guarantee future results. This article is for informational purposes only and does not constitute investment advice.