6-for-6 Midterm Run: Nasdaq QQQ Invesco ETF (QQQ) Averages 21.29% Gains in This 342-Day Window
Nasdaq QQQ Invesco ETF is stepping into a 342-day midterm-election-year seasonal window with a perfect historical record, even as higher yields and AI expectations keep tech valuations under pressure.

What is the seasonal pattern for Nasdaq QQQ Invesco ETF (QQQ)?
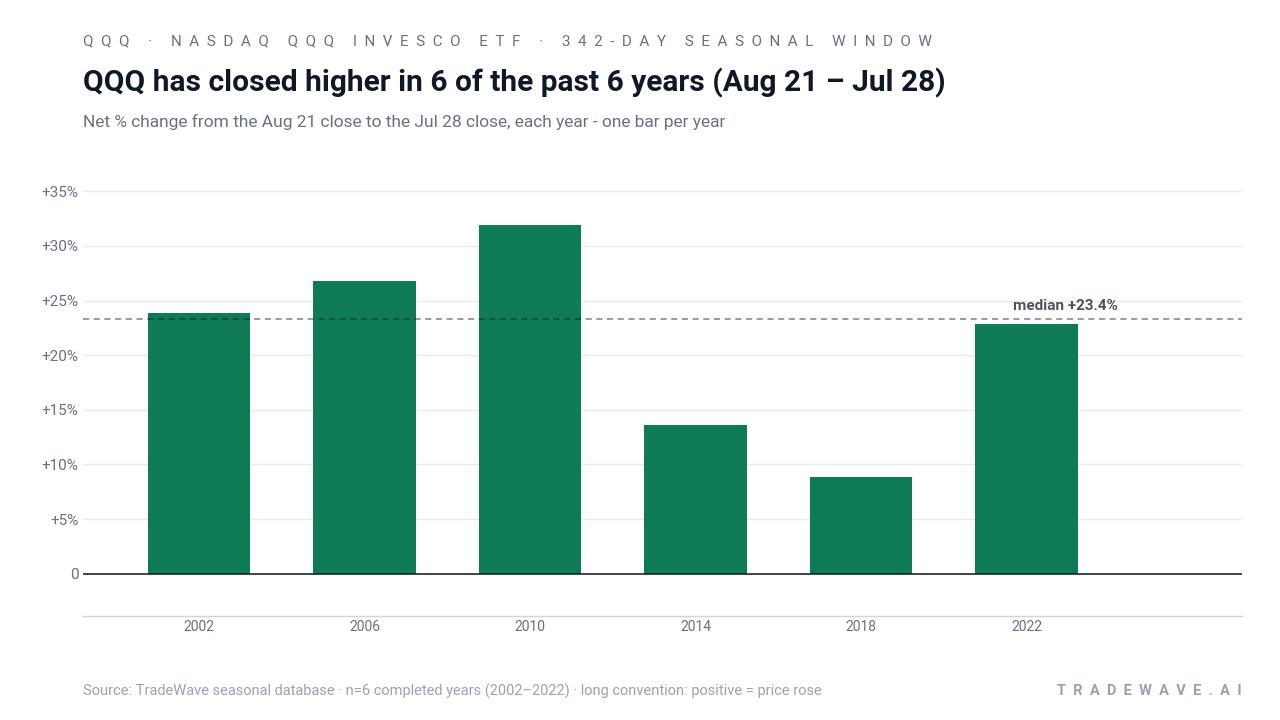
Nasdaq QQQ Invesco ETF has risen in 6 of 6 midterm-election-year windows starting Aug 21 and lasting 342 days, with an average gain of 21.29% in winning years.
- 6 for 6 in this window, with QQQ averaging 21.29% gains in winning years across the last six midterm election cycles.
- The seasonal window begins Aug 21 and runs 342 days through late July of the following pre-election year.
- Percent Profitable is 100%, with 6 winners and 0 losers in the historical sample.
- Average winner gains of 21.29% stack to a 214% cumulative return when the window is repeated across all six cycles.
- Intraperiod swings have been wide, with some years seeing double-digit drawdowns before finishing higher.
- The pattern aligns with the midterm-to-pre-election phase, when policy clarity and tech spending have often supported growth stocks.
According to historical data from TradeWave.ai, this midterm-year stretch has behaved very differently from an average calendar year for QQQ, and the next iteration starts today.
How has Nasdaq QQQ Invesco ETF (QQQ) traded in this midterm-year window?
Nasdaq QQQ Invesco ETF has closed higher in every single one of the last six midterm-election-year windows that start on Aug 21 and run 342 days, averaging 21.29% gains and compounding to 214% across the sample. QQQ finished the prior session at 731.07, about 2.1% below its 52-week high and roughly 32.1% above its 52-week low, leaving it elevated but not stretched at the start of this pattern. That combination of a strong historical seasonal trend and a price sitting near the upper end of its one-year range gives this window outsized relevance for traders watching the Nasdaq QQQ Invesco ETF trading window.
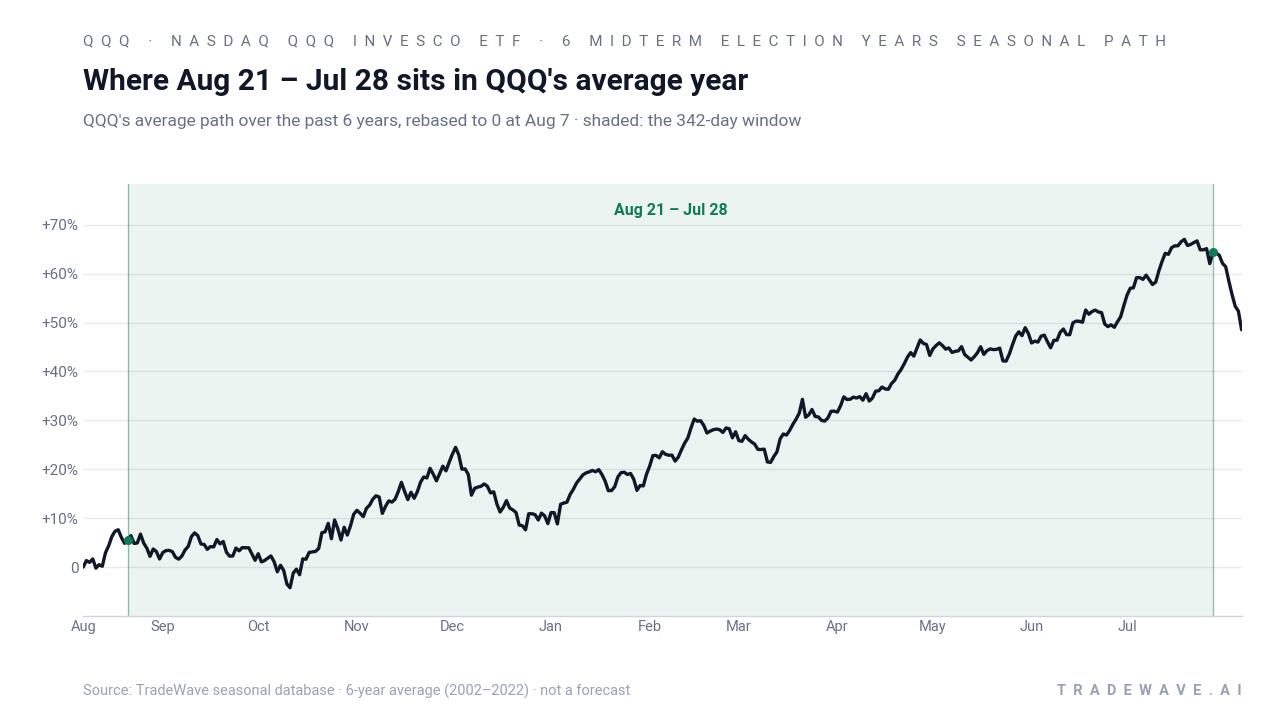
The presidential election cycle matters here because this window always begins in a midterm election year and runs deep into the year before the presidential election, a phase that has often coincided with policy clarity, looser fiscal stances, and stronger risk appetite for growth stocks. For QQQ, which is heavily tilted toward mega-cap technology and communication names, that has historically meant a friendlier backdrop for AI-driven capex stories and high-duration cash flows compared with the choppier early-midterm months.[1]
Across the six completed midterm-election-year samples since 2002, the trade direction for this pattern is long, and every instance has finished positive. The strongest year in the set was 2010, when QQQ gained 31.87% from the Aug 21 entry to the late-July exit, with a best intraperiod run-up of 35.59% and only a 3.39% worst drawdown from entry. The softest outcome still delivered an 8.85% gain in 2018, but that year also saw a 20.09% adverse move at one point before the ETF recovered into the close of the window.
The average winner gain of 21.29% sits alongside a median profit of 23.35%, which tells you the distribution has been skewed toward solid double-digit advances rather than a single outlier year doing all the work. When you hypothetically stack the window back-to-back across the six midterm cycles, the cumulative return reaches 214%, which is consistent with the 21.04% annualized figure for this slice of the calendar. Add it up: six midterm-election-year windows, six gains, and no losing years in this specific QQQ seasonal trend.
Intraperiod behavior has not been smooth, though. In 2002, QQQ ultimately gained 23.84% over the window, but the worst drawdown from the Aug 21 entry was 23.26% before the ETF clawed back and pushed to a 27.18% best run-up. In 2022, the ETF finished up 22.86% with a 24.3% best gain at the highs, yet it also endured an 18.97% adverse move at one point. That mix of strong maximum favorable moves and sizable maximum adverse moves is exactly what the MFE/MAE profile is flagging: historically favorable upside with meaningful downside swings along the way.
The next view shows how each year’s net result and intraperiod range stack up around that average path.
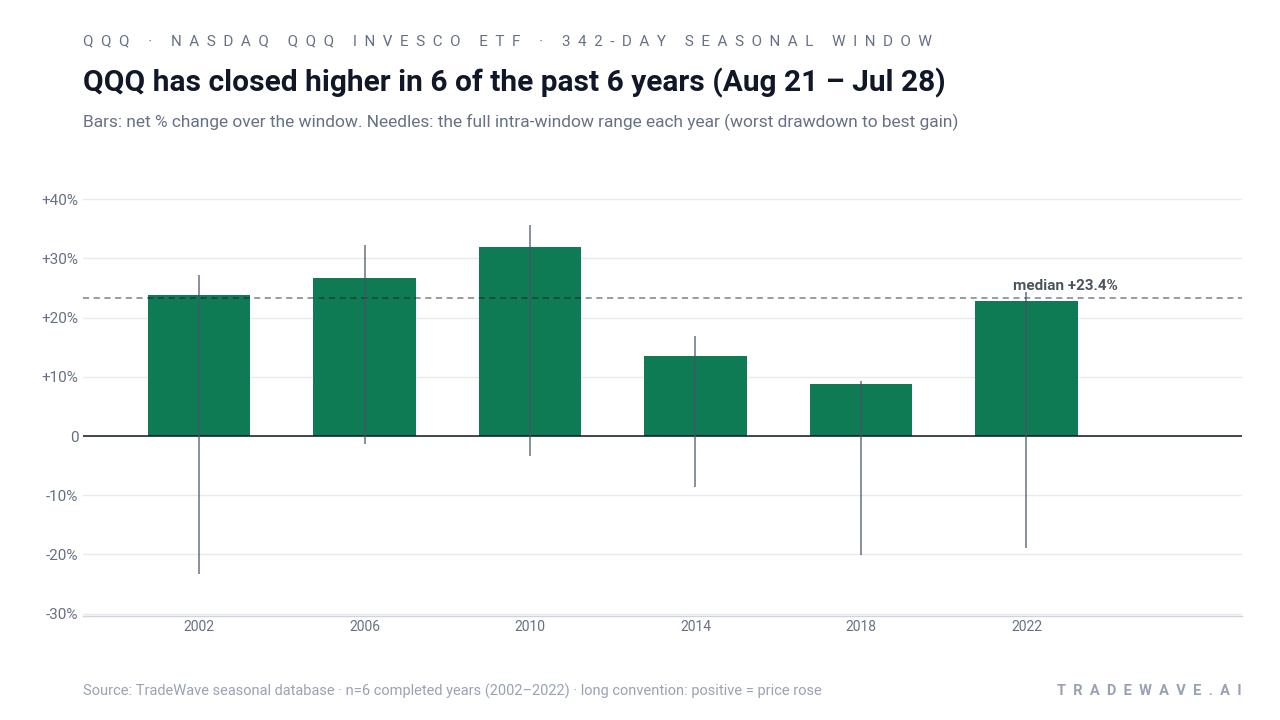
Viewed together, the historical seasonal average and the bar chart tell a clear story: this has been a long-biased regime for QQQ, with every midterm-election-year sample finishing higher, but the path has often involved double-digit drawdowns before the gains stick. The pattern is simple to remember: six for six, with typical winners in the high teens to low 30s on a percentage basis.
History does not guarantee future results; adverse excursions (MAE) can be large even in winning windows, and QQQ’s tech-heavy profile means macro shocks can quickly overwhelm seasonal tendencies.
Why does Nasdaq QQQ Invesco ETF (QQQ) follow this seasonal pattern?
One likely driver is the way the policy and earnings calendar lines up between the back half of a midterm election year and the year before the presidential election. Analysts have pointed to a mix of post-midterm policy clarity, fiscal support, and renewed risk appetite that often benefits growth-heavy benchmarks like the Nasdaq-100, which QQQ tracks.[1][4] This pattern may also reflect institutional portfolio repositioning into large-cap tech as visibility on regulation, interest rates, and AI-related capital spending improves heading into the pre-election year.[1][2]
What is driving Nasdaq QQQ Invesco ETF (QQQ) today?
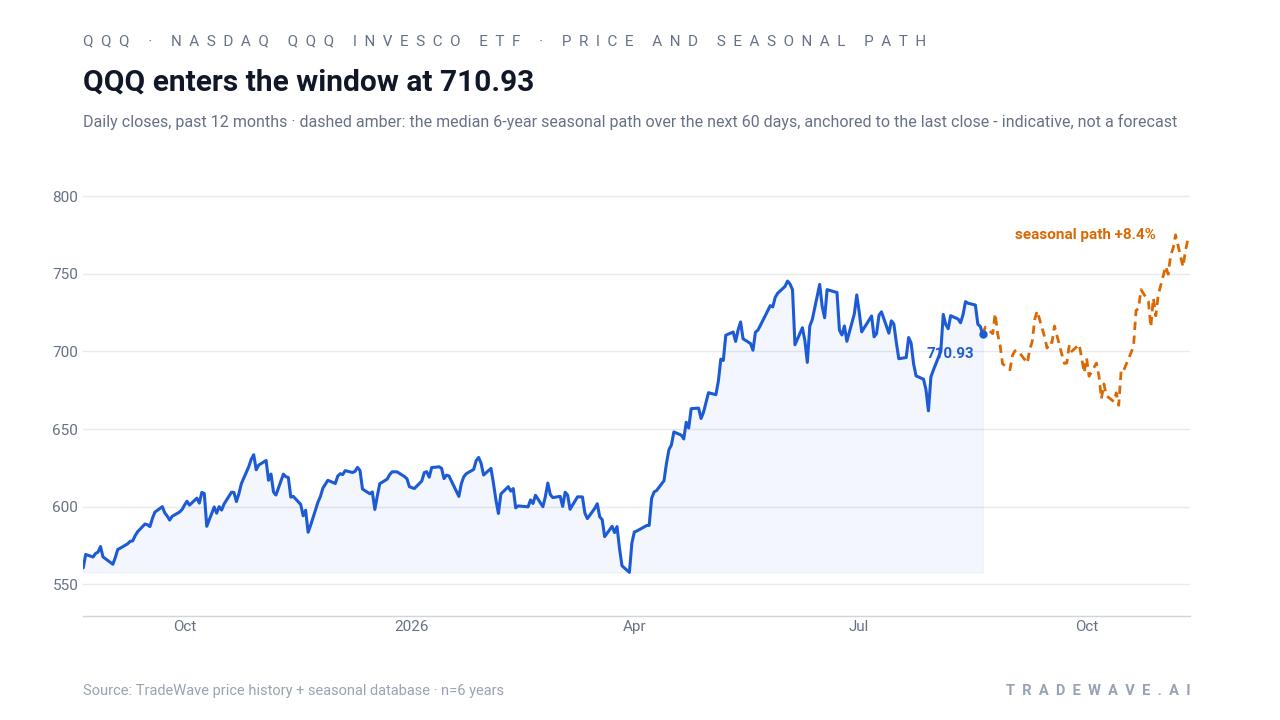
QQQ ended the prior session at 731.07, down 0.14% on the day, leaving it about 2.1% below its 52-week high of roughly 747.00 and well above its 52-week low near 553.49. That level comes after a 2.74% gain over the past month, with the ETF trading above its 50-day moving average of 712.82 on 20-day average volume of about 39.6 million shares, a setup that keeps the broader tech trend pointed higher even as the new seasonal window opens. In mid-August, fresh analysis tied QQQ’s long-term bull case to AI adoption and hyperscaler capital expenditures translating into higher free cash flow for its largest holdings, reinforcing the idea that this ETF’s fate is tightly bound to the AI spending cycle.[1]
Macro headwinds are still in play. Coverage this week highlighted that rising Treasury yields and investor caution around higher-for-longer rates could pressure growth-stock valuations, a direct risk for a tech-heavy vehicle like QQQ.[1] At the same time, reports from MarketBeat describe continued inflows into Invesco ETFs and record U.S. ETF assets in the first half of 2026, suggesting that structural demand for broad tech exposure remains strong despite rate volatility.[3] That push-pull between higher discount rates and robust ETF flows is the backdrop against which this historically strong QQQ seasonal pattern is kicking in.
Index structure is another moving part. A July report from Morningstar and MarketWatch flagged that the Nasdaq-100 has been far more volatile than the S&P 500 and that the planned inclusion of SpaceX could further alter the index’s risk profile, which flows directly into QQQ’s holdings and day-to-day swings.[4] With mega-cap tech names like Nvidia, Apple, Microsoft, and Amazon already dominating the ETF’s weight, any additional concentration in high-beta growth stories could amplify both the upside and downside of this midterm-year seasonal window.[1][2][4]
The chart below situates the latest move in its recent multi-month context alongside the historical 60-day seasonal projection.
What should traders watch in this QQQ seasonal window?
First, the calendar: this 342-day stretch runs from Aug 21 of the midterm election year into late July of the year before the presidential election, a phase that has historically lined up with stronger risk appetite and policy clarity for growth stocks. Traders will be watching whether QQQ can again convert that backdrop into double-digit gains, or whether higher-for-longer rates blunt the pattern this time around.[1]
Second, levels and volatility. With QQQ starting the window just a couple of percent below its 52-week high and well above its 50-day moving average, any sharp pullback that resembles the 18% to 23% intraperiod drawdowns seen in 2002, 2018, or 2022 would test how much of the historical downside tolerance investors are willing to stomach. A pattern-consistent path would likely feature choppy corrections that hold above the 52-week low zone while the ETF grinds higher over the full window.
Third, flows and positioning. MarketBeat’s reporting on strong ETF inflows into Invesco products and record U.S. ETF assets in the first half of 2026 suggests that demand for QQQ has been robust heading into this window.[3] Traders will want to see whether those flows persist if Treasury yields stay elevated; a continued build in assets would support the historical seasonal bias, while a reversal in flows could be an early sign that this cycle may diverge from the six-for-six record.
Finally, the macro and policy calendar. Key inflation prints, Fed meetings, and any regulatory developments around AI and big tech will intersect with this window and could either reinforce or overwhelm the historical pattern.[1][4] If QQQ can weather rate scares and policy headlines while holding above its 50-day moving average and making higher highs into early 2027, that would look a lot like prior midterm-to-pre-election cycles. A sustained break lower on heavy outflows, by contrast, would be the clearest sign that this time is different.
Sources
- The Motley Fool - History Says a $10,000 Investment in the QQQ Will Be Worth $66,000 in 10 Years | The Motley Fool
- The Motley Fool - Which Is the Better ETF, State Street's Broad Market Exposure Through SPY or Invesco's Tech-Focused QQQ? | The Motley Fool
- MarketBeat - Alpha Zero LLC Has $18.54 Million Position in Invesco QQQ $QQQ
- Morningstar / MarketWatch (Dow Jones) - The Nasdaq-100 has been far more volatile than the S&P 500. Now add SpaceX to the mix. | Morningstar
About this seasonal analysis
Seasonal pattern data is sourced from TradeWave.ai, which analyzes historical price behavior across annual calendar windows going back up to 30 years. Read the full data methodology or the book The 100-Year Pattern by Afshin Moshrefi (2026 edition). Past performance of seasonal patterns does not guarantee future results. This article is for informational purposes only and does not constitute investment advice.