6-for-6 Midterm Record: S&P 500 Technology Sector SPDR (XLK) Eyes Another 12.8% Rally Window
S&P 500 Technology Sector SPDR is nearing a historically strong 220-day midterm-year seasonal window even as tech breadth stays uneven and insider buying accelerates across the sector.

What is the seasonal pattern for S&P 500 Technology Sector SPDR (XLK)?
S&P 500 Technology Sector SPDR has risen in 6 of 6 midterm-year Sep 17–Apr 24 windows, with an average gain of 12.8% in winning years.
- 6 for 6 in this window, averaging 12.8% gains in winning years across the last six midterm election cycles.
- Seasonal window runs from Sep 17 and spans 220 days into late April, aligning with the midterm-to-pre-election transition.
- Percent Profitable is 100%, with 6 winners and 0 losers in the historical sample.
- Annualized return across these windows is 12.73%, compounding to a cumulative 105% gain over the six completed cycles.
- TradeWave Ratio of 1.61 indicates price has typically traveled meaningfully in the long direction within the window, not just at the close.
- Sharpe ratio of 2.56 reflects a historically strong risk-adjusted profile for this XLK seasonal trend.
According to historical data from TradeWave.ai, this midterm-year stretch for XLK has behaved very differently from an average calendar period. TradeWave.ai’s historical database shows a repeatable pattern that turns on again in less than a month.
How has S&P 500 Technology Sector SPDR (XLK) traded in this midterm-year window?
XLK has closed higher in every single Sep 17 to Apr 24 midterm-year window across the last six cycles, averaging a 12.8% gain for the ETF. The upcoming 220-day stretch begins on Sep 17, 2026, and historically has delivered an annualized return of 12.73% for this long-only setup. That combination of a clean 6-for-6 record and double-digit average gains makes this one of the more striking XLK seasonal trends on the calendar.
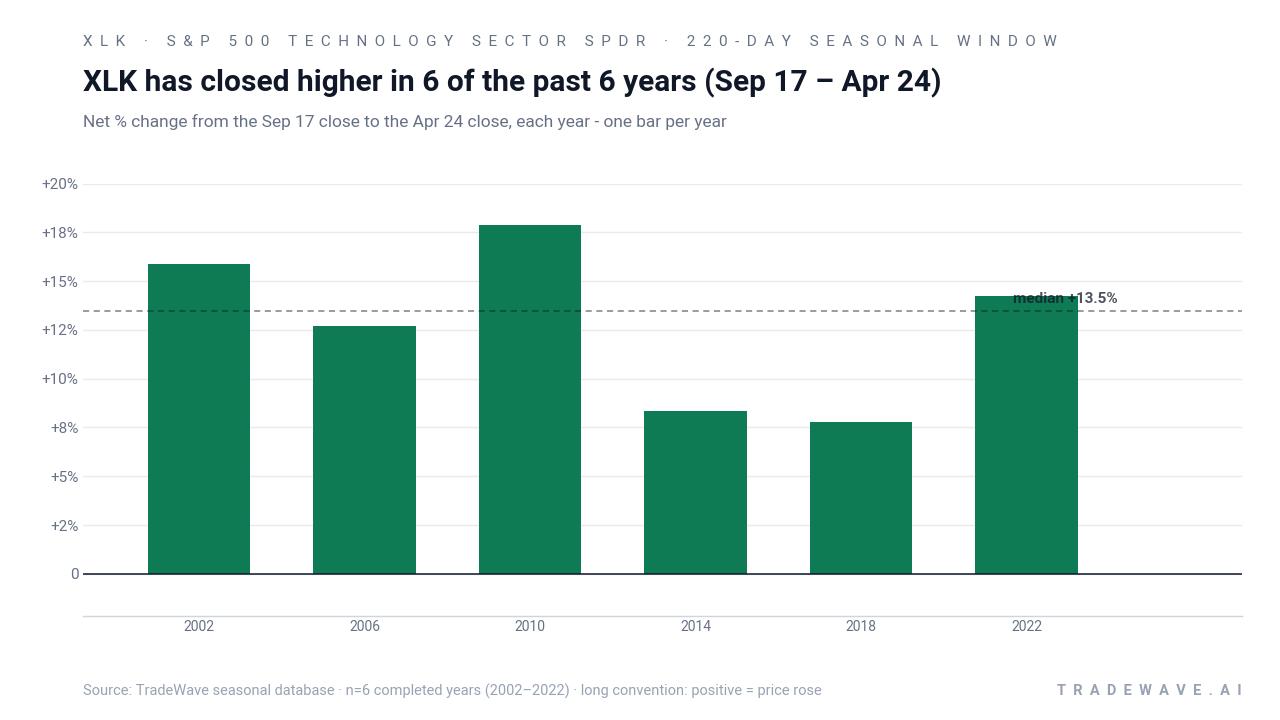
The presidential election cycle matters here because this pattern only looks at the last six midterm election years, then tracks XLK from mid-September into the following spring. That means the window also overlaps the broader midterm-to-pre-election regime that has historically been one of the strongest stretches for U.S. equities, with tech often acting as the high-beta expression of that risk-on phase.
Across the six completed midterm-year samples, the strongest XLK run came in 2010, when the ETF gained 17.86% between the Sep 17 entry and the late-April exit, with a best intraperiod rally of 20.67% and essentially no meaningful drawdown from the starting point. At the other end of the range, 2018 still finished up 7.77% over the window but saw a worst intraperiod drop of 21.6%, showing how choppy the ride can be even in a winning year.
On average, the winners’ 12.8% gain lines up with a 105% cumulative return if an investor had only been exposed to XLK during this 220-day midterm-year slice across the six cycles. Add it up: six seasonal windows, all positive, compounding to more than a double while skipping the rest of the calendar.
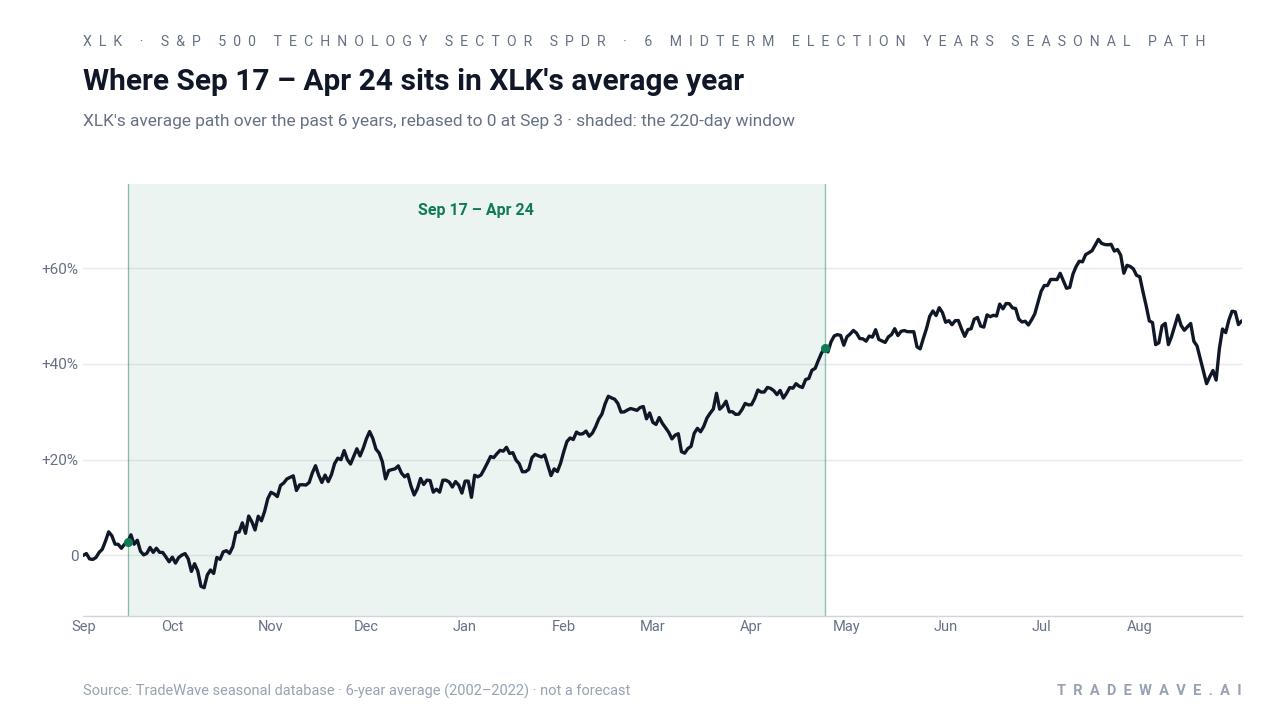
The next view shows how far XLK has swung inside each window before finishing higher.
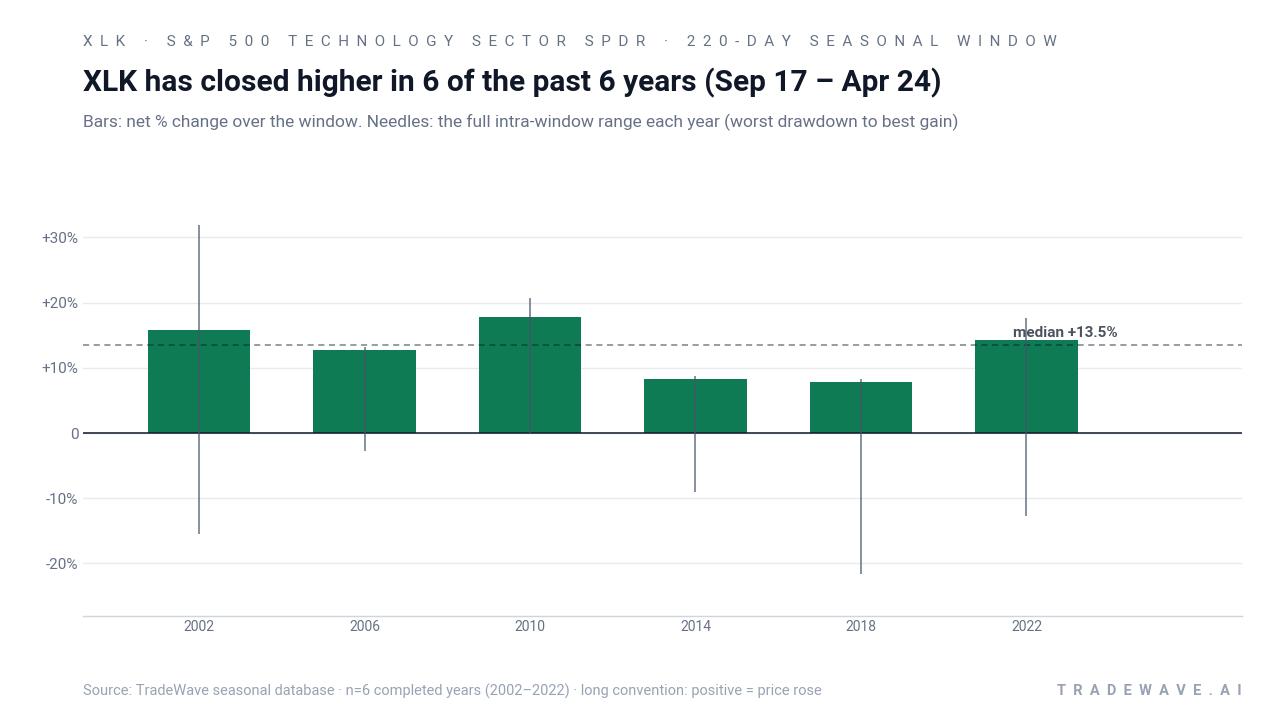
The combined maximum favorable move and maximum adverse move profile shows why this XLK seasonal pattern is powerful but not gentle. In strong years like 2002 and 2010, the ETF’s best intraperiod rallies reached 31.85% and 20.67% respectively, while the worst drawdowns stayed contained or even negligible. In more volatile cycles such as 2018 and 2022, XLK still finished higher but endured double-digit adverse swings of 21.6% and 12.72% from the entry point before recovering, underscoring that the path to those gains has often been bumpy.
History does not guarantee future results; adverse excursions (MAE) can be large even in winning windows.
Why does S&P 500 Technology Sector SPDR (XLK) follow this seasonal pattern?
One likely driver is the way the tech earnings calendar and corporate guidance cluster from late Q3 through Q1, which often resets expectations for growth stocks heading into the pre-election year. Analysts have also pointed to institutional portfolio rebalancing and sector rotation around midterm elections, when policy uncertainty peaks and then fades, as a reason tech tends to catch a bid in this stretch. The pattern may also reflect rising AI and cloud spending cycles that typically ramp into year-end budgets and early-year deployments, benefiting many of XLK’s largest holdings.
What is driving S&P 500 Technology Sector SPDR (XLK) today?
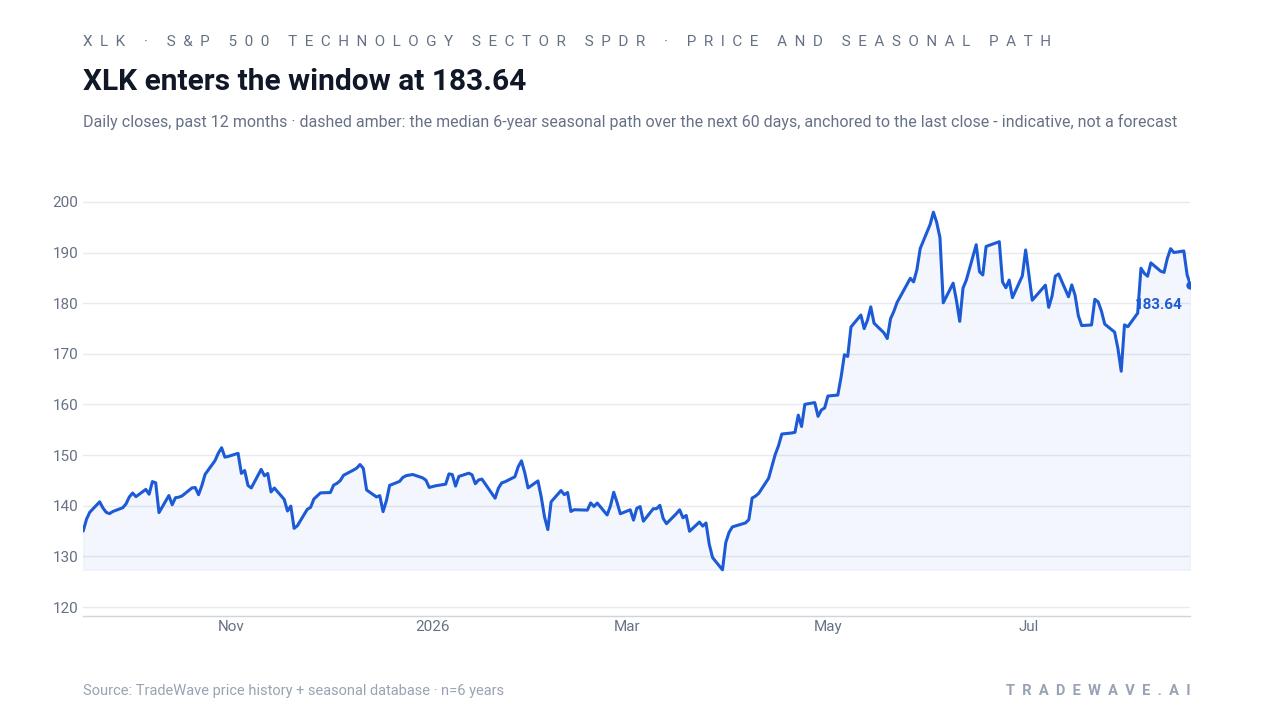
XLK has been trading through a choppy summer backdrop where many S&P 500 tech names sit at least 20% below their 52-week highs, even as a handful of AI leaders and chip stocks continue to pull the ETF higher.[1] Sector breadth has been narrow, with Q2 earnings beats from names like Micron and Intel helping XLK surge earlier in the quarter as investors leaned into AI infrastructure and memory demand.[1] At the same time, corporate insiders across the technology sector have been buying open-market shares at an unusually aggressive pace within the ETF, a signal of internal confidence that stands in contrast to the cautious tone around AI profitability and regulation.[1]
The chart below situates the latest move in its recent multi-month context alongside the median 60-day seasonal path.
How do macro and policy themes shape XLK’s seasonal outlook?
The current midterm election year is unfolding against a heavy AI and data-center policy backdrop, with states rethinking incentives as power costs and public pushback rise, a shift that directly affects several infrastructure-heavy XLK constituents.[1] Goldman Sachs has highlighted that AI capital spending is surging while profit gains remain limited for many adopters, which has pushed investors toward the hardware and infrastructure names that dominate XLK rather than the broader software universe.[1] That mix of policy scrutiny, high capital intensity and selective profitability means the ETF is entering its historically strong Sep 17–Apr 24 window with a more polarized set of winners and laggards than in prior cycles.
Sector-wide, the fact that most S&P 500 tech stocks remain well below their highs while insiders are buying aggressively suggests a market that is still digesting the last AI leg higher rather than one that has fully priced in the next phase.[1] In midterm election years, that kind of uncertainty has often resolved into a stronger risk-on tone as policy clarity improves and investors look ahead to the pre-election year, a dynamic that lines up with XLK’s historical seasonal strength in this window.
What should traders watch as the Sep 17 XLK window approaches?
First, watch how XLK behaves into and through the Sep 17 start date relative to its recent trading range. In prior midterm cycles, the ETF has often used this window to transition from choppy consolidation into a more persistent uptrend, so a failure to gain traction into late September would be an early sign that this cycle is diverging from the historical script.
Second, keep an eye on sector breadth and leadership. If the upcoming seasonal window is going to rhyme with the past six, gains are likely to be driven not just by a handful of AI champions but by a broader pickup across semis, software and IT services, especially as Q3 and Q4 earnings roll in. Stronger participation from the many tech names still 20% or more below their highs would be a sign that the historical XLK seasonal trend is reasserting itself rather than narrowing further.[1]
Third, monitor the insider buying theme that has already emerged in 2026. If insiders continue to step up purchases into year-end, that would reinforce the idea that management teams see current valuations as attractive ahead of the pre-election year, aligning with the ETF’s 6-for-6 record in this window.[1] A sharp slowdown or reversal in insider activity, especially if paired with renewed policy pressure on AI data centers or weaker AI-related earnings, would argue for more caution even in a historically favorable seasonal stretch.
Finally, track the macro and policy calendar around AI regulation, data-center incentives and broader tech oversight. The more clarity investors get on long-term capital spending and regulatory risk, the easier it will be for XLK to follow its historical midterm-year seasonal path. If that clarity arrives alongside stabilizing rates and solid earnings, the Sep 17–Apr 24 window has a track record of rewarding long exposure; if not, the same history shows that even winning years can involve deep drawdowns along the way.
Sources
About this seasonal analysis
Seasonal pattern data is sourced from TradeWave.ai, which analyzes historical price behavior across annual calendar windows going back up to 30 years. Read the full data methodology or the book The 100-Year Pattern by Afshin Moshrefi (2026 edition). Past performance of seasonal patterns does not guarantee future results. This article is for informational purposes only and does not constitute investment advice.