Rich Valuations Meet a 5-of-6 Midterm Fall Rally Record for S&P 500 Healthcare Sector SPDR (XLV)
S&P 500 Healthcare Sector SPDR is nearing a historically strong 65-day midterm-year fall stretch even as valuations look full and policy risk builds into year-end.

What is the seasonal pattern for S&P 500 Healthcare Sector SPDR (XLV)?
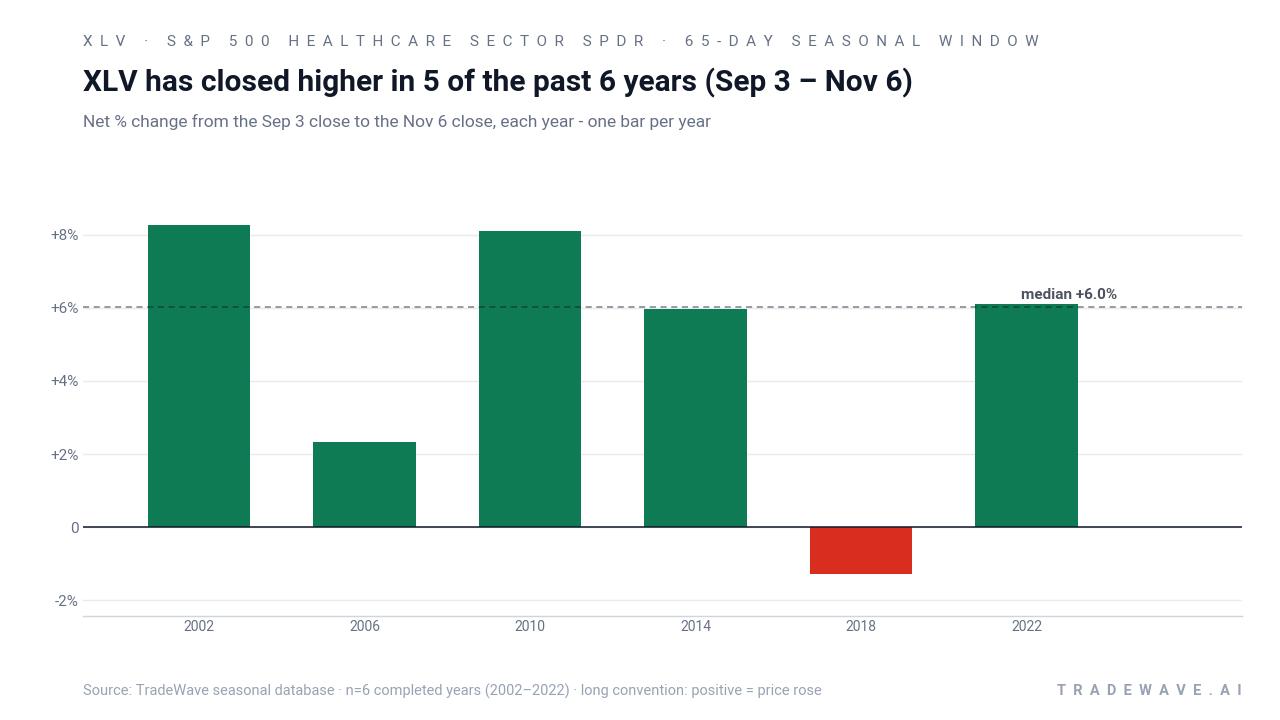
S&P 500 Healthcare Sector SPDR has risen in 5 of 6 midterm-year Sep 3–Nov 6 windows, with an average gain of 6.15% in winning years.
- 5 wins and 1 loss in this 65-day Sep 3–Nov 6 window across the last 6 midterm election years.
- Percent Profitable is 83%, with 5 winners and 1 loser in the historical sample.
- Avg Profit in winning years is 6.15%, while Avg Profit - All, including the lone losing year, is 5%.
- The strongest years, such as 2002 and 2010, posted gains above 8%, while 2018 was the only down window at -1.28%.
- Intraperiod swings have been meaningful, with favorable moves often near 7–9% and adverse drawdowns in some years deeper than -5%.
- The pattern is long-biased, aligning with a midterm-year fall backdrop that has often favored defensive healthcare exposure.
According to historical data from TradeWave.ai, this midterm-year fall window in XLV has behaved differently from an average calendar slice, with a clear long-side tilt that shows up repeatedly across cycles.
How has S&P 500 Healthcare Sector SPDR (XLV) traded in the Sep 3–Nov 6 midterm window?
In the last six midterm election years, this Sep 3–Nov 6 window has been a quietly strong stretch for S&P 500 Healthcare Sector SPDR, with gains in five of six cycles and a 32% cumulative return when the windows are stacked. XLV is trading near the upper end of its 52-week range, with the prior year’s high at 170.30 and the low down at 130.36, so the ETF is heading into this pattern from a position of strength rather than distress.[1]
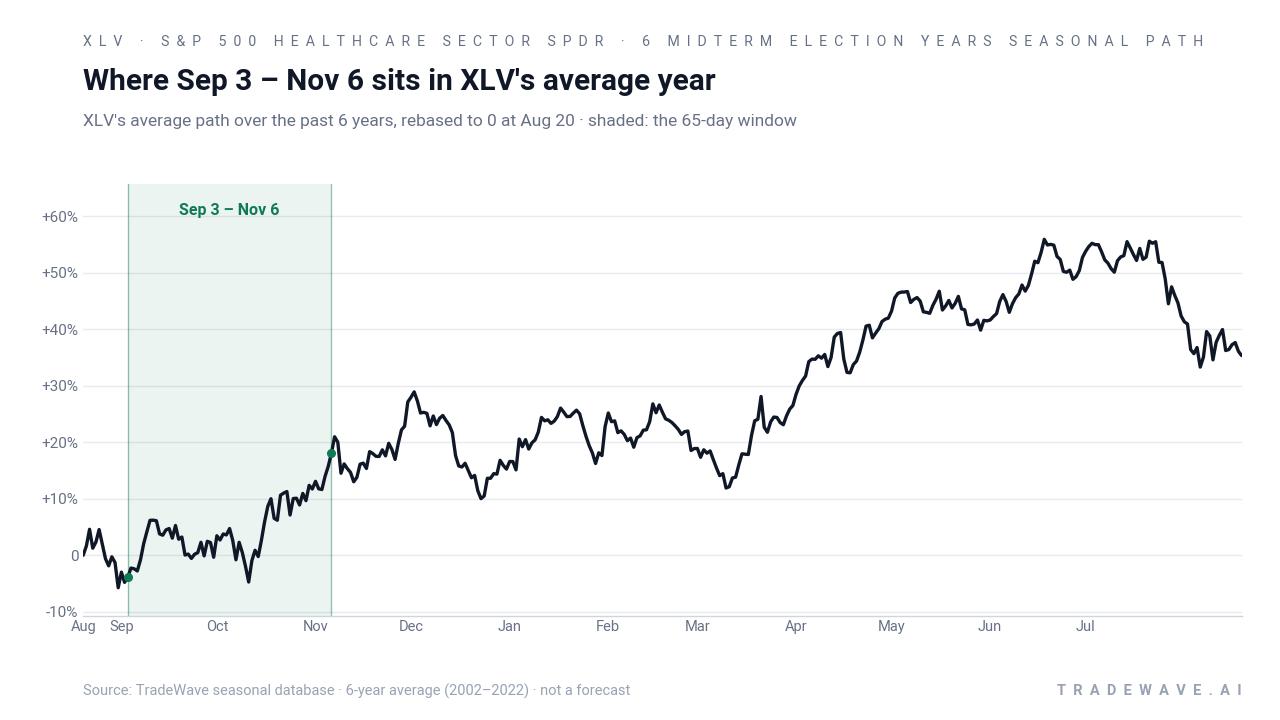
The presidential election cycle matters here because this pattern only looks at the last six midterm election years, a phase that often brings policy noise, regulatory headlines and shifting expectations for healthcare spending. Grouping by midterm years filters out other parts of the cycle and focuses on how XLV has behaved when Washington is in the middle of a term and markets are already looking ahead to the coming pre-election year.
This seasonal window begins on Sep 3 and spans 65 days. Historically, during this period, S&P 500 Healthcare Sector SPDR has shown a constructive long-side tendency, with an 83% win rate and a 6.15% average gain in winning years, while the all-years average including the lone loser still comes in at 5%.
The trade direction for this pattern is explicitly long, and the per-year record backs that up. In 2002 and 2010, XLV logged net returns of 8.26% and 8.10% respectively over the window, while 2014 and 2022 delivered mid-single-digit gains of 5.96% and 6.10%. The only losing year in the sample is 2018, when the ETF slipped 1.28% over the same dates.
Intraperiod swings have been meaningful. In the strongest years, the maximum favorable move from the Sep 3 entry ran between 7.56% and 9.34%, showing that when the pattern works, XLV has often pushed higher than the final close before consolidating. On the downside, the worst intraperiod drawdowns ranged from about -0.79% in 2010 to -7.34% in 2014, so even winning years have seen uncomfortable pullbacks before finishing higher.
A second view shows how each year’s best rally and worst drawdown have lined up inside the same 65-day stretch.
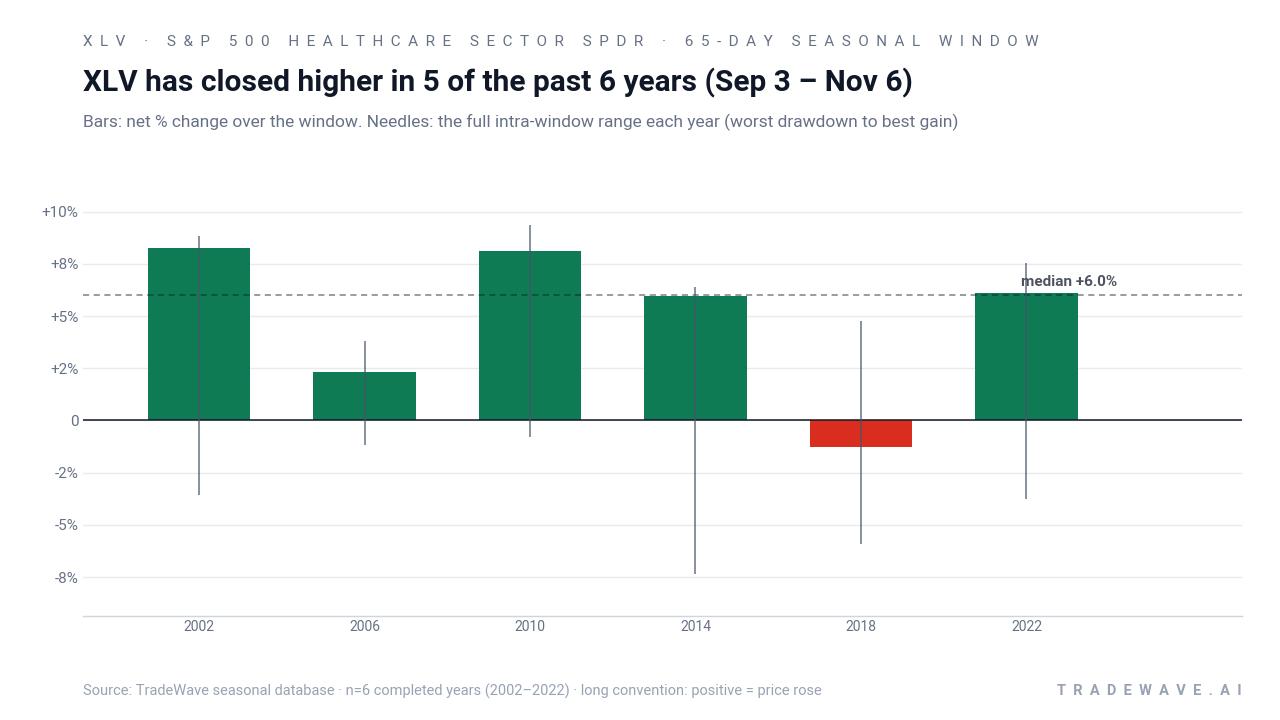
Put together, the stats paint a clear picture: this has been a favorable midterm-year fall window for long exposure in XLV, with five wins out of six and a solid 5% all-years average, but the path has rarely been smooth.
History does not guarantee future results; adverse excursions (MAE) can be large even in winning windows.
Why does S&P 500 Healthcare Sector SPDR (XLV) follow this seasonal pattern?
One likely driver is the way healthcare earnings, regulatory updates and budget negotiations cluster in the early fall of midterm election years, when Congress returns from recess and policy debates restart. Analysts have also pointed to institutional portfolio repositioning into defensive sectors like healthcare as volatility around the midterms picks up, which can support XLV during this specific stretch.[3] The pattern may also reflect sector rotation out of more cyclical areas after the summer, with investors seeking steadier cash flows ahead of year-end.
What is driving S&P 500 Healthcare Sector SPDR (XLV) today?
XLV has been trading near record territory in recent weeks, helped by its heavy exposure to large-cap names such as Eli Lilly, Johnson & Johnson and AbbVie, which together account for more than one-third of the fund’s weight and have benefited from strong drug pipelines and steady cash flows.[2] A July analysis argued that the healthcare sector and XLV in particular may be past the best upside of this cycle, citing rich valuations and technical signs of a topping process even as the ETF continued to act as a relative safe haven.[3] Another comparison highlighted XLV’s focused S&P 500 healthcare exposure, relatively low fees and a trailing-12-month dividend of $2.53, or about a 1.60% yield at the quoted price in that piece, which has kept the fund popular with investors looking for defensive income.[2]
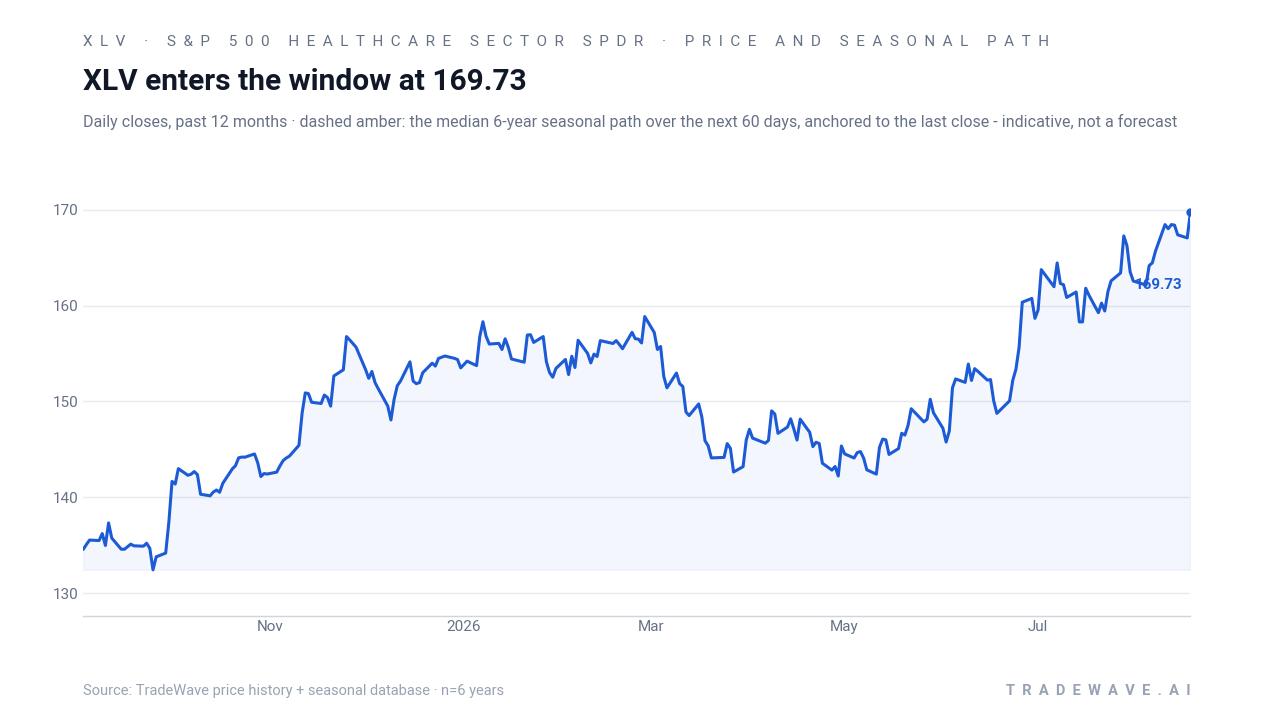
The chart below shows XLV’s climb over the past year alongside a median 60-day seasonal projection for context.
What should traders watch as XLV approaches this midterm-year window?
First, the calendar: the 65-day window opens on Sep 3 and runs through Nov 6, overlapping a period when Congress is back in session and healthcare policy headlines often pick up. Second, levels: with the prior 52-week high at 170.30, traders will be watching whether XLV can sustain or extend a breakout into the window or whether early drawdowns resemble the deeper pullbacks seen in 2014 and 2018. Third, macro and policy catalysts: any movement on drug pricing, Medicare reimbursement or broader fiscal negotiations could either reinforce the historical defensive bid into healthcare or disrupt it if regulation tightens.[1][3] Finally, behavior inside the window will matter: a pattern of early weakness followed by a grind higher would rhyme with several past cycles, while a sharp and persistent break lower would mark a clear departure from the historical XLV seasonal trend.
Sources
About this seasonal analysis
Seasonal pattern data is sourced from TradeWave.ai, which analyzes historical price behavior across annual calendar windows going back up to 30 years. Read the full data methodology or the book The 100-Year Pattern by Afshin Moshrefi (2026 edition). Past performance of seasonal patterns does not guarantee future results. This article is for informational purposes only and does not constitute investment advice.