S&P 500 Financials Sector SPDR (XLF) Has Risen in 6 of 6 Midterm Windows, Averaging 9.35% Gains
S&P 500 Financials Sector SPDR is about to enter a long midterm-year seasonal window that has never finished lower in the past six cycles, just as the ETF trades near a fresh 52-week high after a bruising year for financials.

What is the seasonal pattern for S&P 500 Financials Sector SPDR (XLF)?
S&P 500 Financials Sector SPDR has risen in 6 of 6 midterm-year Aug 30–Jul 22 windows, with an average gain of 9.35% in winning years.
- 6 for 6 in this window, with XLF posting gains every time and averaging 9.35% in winning years.
- The upcoming seasonal window runs from Aug 30 through Jul 22, spanning 327 calendar days in midterm election years.
- Percent Profitable is 100%, with 6 winners and 0 losers across the last six midterm election-year cycles.
- Average winner gains of 9.35% stack to a 70% cumulative return when the window is repeated across all six cycles.
- Intraperiod swings have been meaningful, with some years seeing double-digit drawdowns before finishing higher.
- The pattern is long-biased, with a TradeWave Ratio of 1.26 and a Sharpe ratio of 1.2 across the sample.
According to historical data from TradeWave.ai, this midterm-year stretch for XLF has behaved very differently from an average calendar year, and the next iteration begins in just a few days.
How has S&P 500 Financials Sector SPDR (XLF) traded in this midterm-year window?
S&P 500 Financials Sector SPDR has finished higher in every single Aug 30 to Jul 22 midterm-year window across the last six cycles, averaging 9.35% gains with a 70% cumulative return. The ETF last closed at 58.31, leaving it about 0.2% below its 52-week high of 58.41 and roughly 22.9% above its 52-week low, even as it remains down about 10% year to date.[2][3]
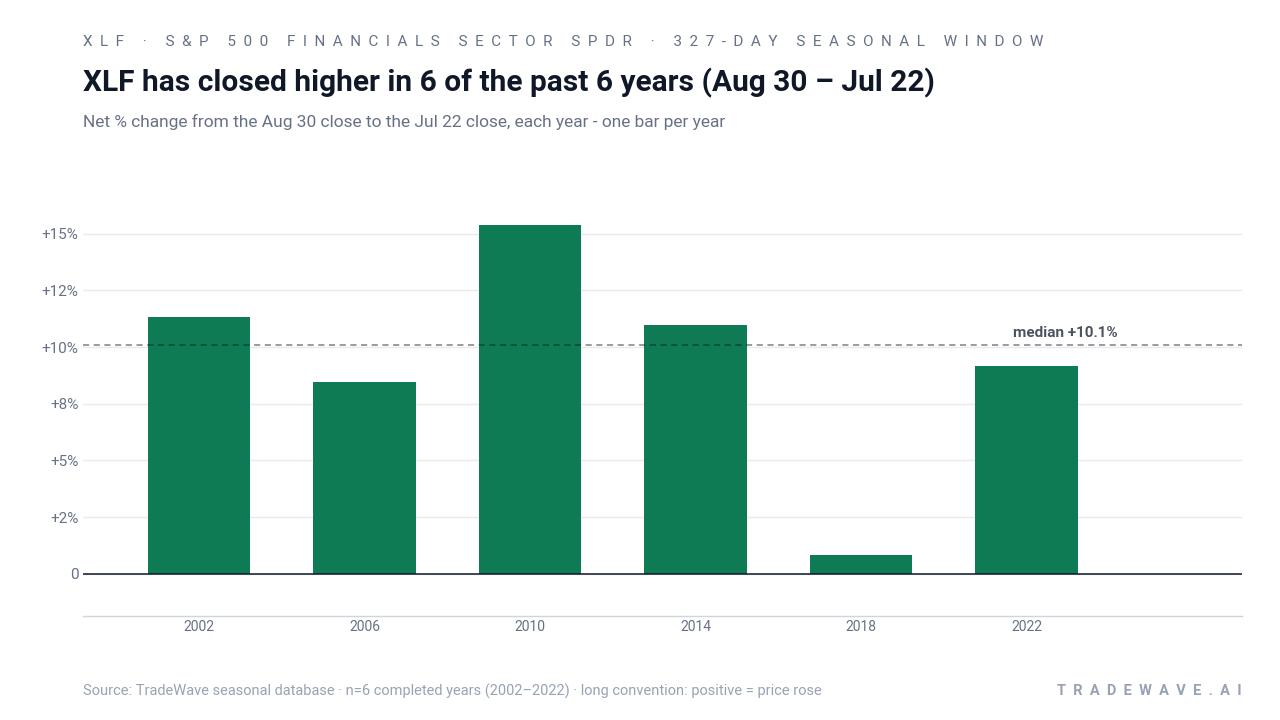
The pattern is built on the last six midterm election years, a phase of the presidential cycle that often looks very different from the year after the election or the pre-election year. In this specific midterm-year stretch, the long trade direction has aligned with the historical tendency: 6 winners, 0 losers, and a Sharpe ratio of 1.2 that points to a relatively strong risk-adjusted profile for a sector ETF.
Average gains of 9.35% mask a wide range of outcomes. The strongest year in the sample was 2010, when XLF gained 15.37% between the Aug 30 entry and the Jul 22 exit, after seeing a maximum favorable move of 28.73% at the best point in the window. The softest year was 2018, which still finished up 0.81% but endured a worst intraperiod drawdown of 21.42% before recovering.
Those intraperiod swings matter. In 2002, XLF ultimately gained 11.33% in the window, but at one point it was down 20.7% from the entry before rebounding. In 2014 and 2022, the worst drawdowns were 7.72% and 10.67% respectively, even though both windows ended with solid single-digit or better gains. The historical record shows that the path has not been a straight line, even in a 100% profitable sample.
The typical return path also has a time profile. The trend statistics show 63 long-trend days versus 0 short-trend days across the window, and a similar 64-to-0 skew in the alternative trend measure, which suggests that strength has tended to persist rather than flip back and forth. In plain English, when this window has worked for XLF, it has usually stayed in “grind higher” mode more often than not.
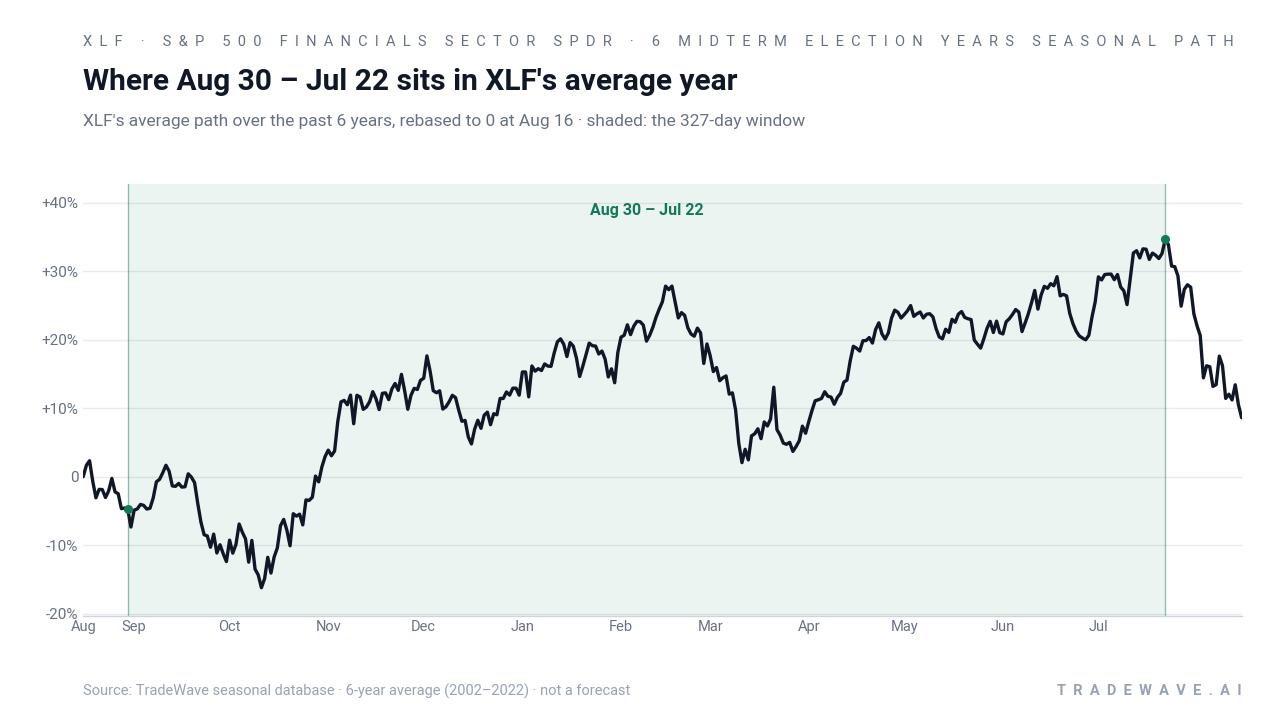
A second view shows how each year’s best rally and worst drawdown have stacked up inside that window.
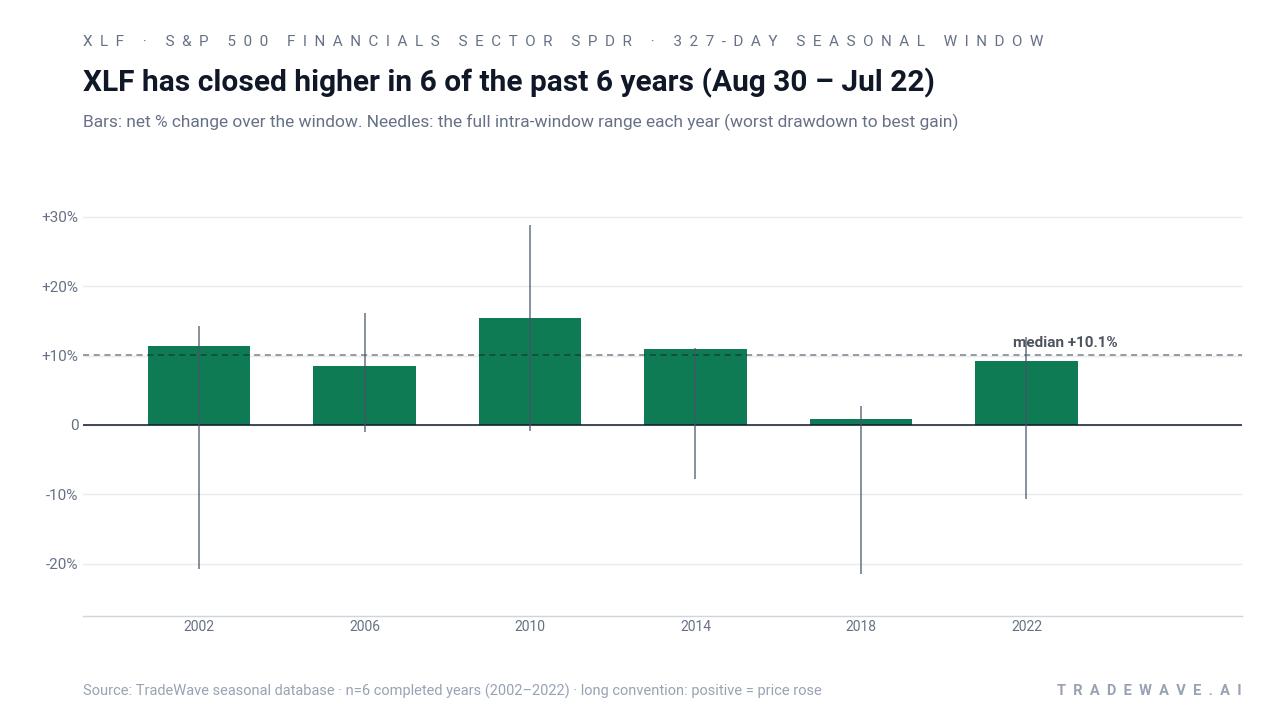
That bars-and-needles profile shows a consistent pattern: every bar is above zero, but the needles extend meaningfully both higher and lower. Some years, like 2006 and 2010, saw large maximum favorable moves with relatively shallow worst drawdowns. Others, like 2002 and 2018, combined deep adverse excursions with modest final gains. Historically, this has been a long-biased window with real upside, but also with enough volatility that timing and risk management have mattered.
History does not guarantee future results; adverse excursions can be large even in winning windows, and past midterm-year behavior may not repeat.
Why does S&P 500 Financials Sector SPDR (XLF) follow this seasonal pattern?
One likely driver is the way the presidential election cycle shapes policy risk and rate expectations for banks and insurers. Midterm election years often bring regulatory noise and choppy first-half trading, followed by clearer visibility on fiscal and monetary policy that can support financials into the following pre-election year. This Aug 30–Jul 22 window straddles that transition, capturing both the back half of the midterm year and much of the pre-election year, when risk appetite for cyclical sectors like financials has often improved.
What is driving S&P 500 Financials Sector SPDR (XLF) today?
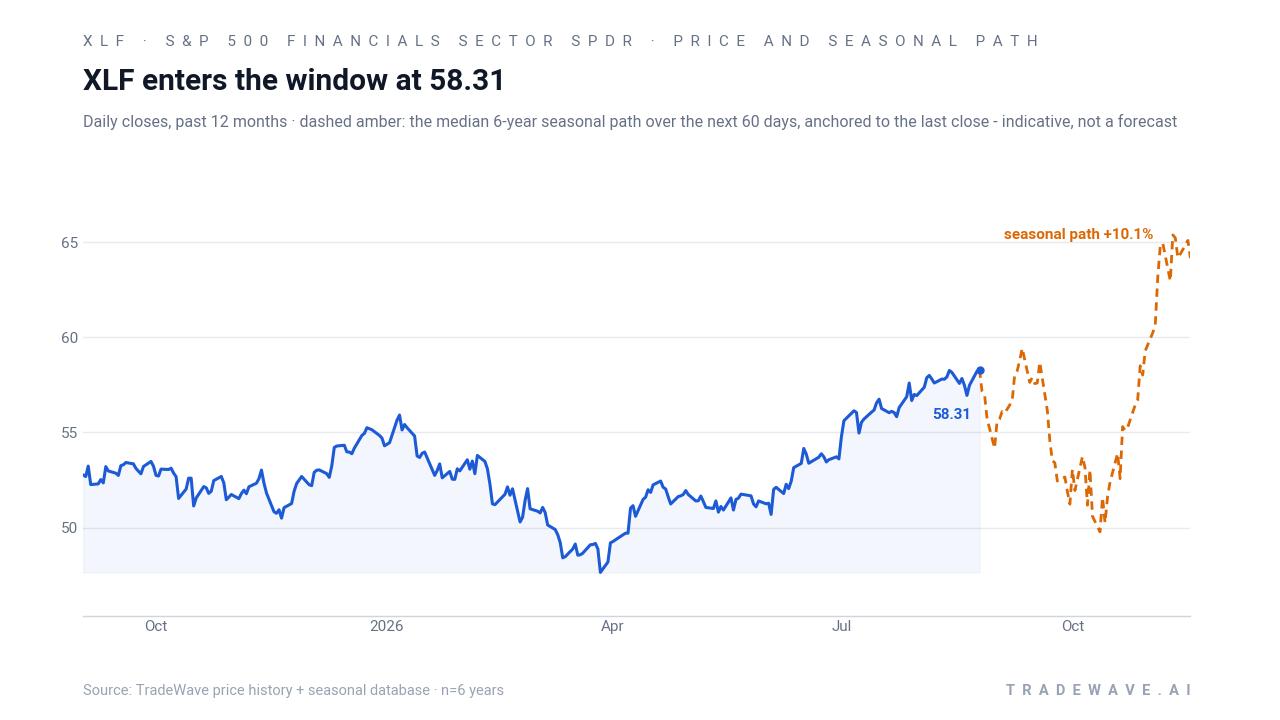
S&P 500 Financials Sector SPDR last changed hands at 58.31, up about 0.2% on the day and sitting roughly 0.2% below its 52-week high of 58.41 while still down about 10% for 2026.[2][3] That mix of near-term strength and year-to-date underperformance reflects a sector caught between sticky short-term rates that pressure bank margins and shifting expectations for rate cuts, even as some investors frame the drawdown as a buy-low opportunity in financials.[1][3][5]
In March 2026, analysis highlighted financials as the worst-performing S&P 500 sector with a double-digit loss, pointing to interest-rate and mortgage-policy dynamics as key headwinds for XLF.[1] A separate February 2026 piece underscored how concentrated the ETF is, with roughly a quarter of its weight in just two names and about 86% of assets in financials, which can amplify both downside and upside when the sector moves.[5] More recently, cross-ETF comparisons have noted XLF’s low expense ratio and large asset base, keeping it a default vehicle for traders looking to express a view on U.S. financials versus other regions.[3][4]
Options traders have also used XLF as a way to play bank earnings season. In July 2026, one strategy note flagged relatively inexpensive call premiums around the mid-50s as a way to position for volatility around big-bank results, reinforcing the ETF’s role as a liquid proxy for the sector’s earnings pulse.[1] At the same time, technical commentary in June 2026 pointed to a lack of notable insider-style activity in the ETF structure itself, which is consistent with its passive, index-tracking design rather than a single operating company.[6]
The chart below situates the latest move in its recent multi-month context alongside the median 60-day seasonal path.
What should traders watch as this XLF seasonal window opens?
First, the calendar. The 327-day window begins on Aug 30 and runs through Jul 22, overlapping the back half of the midterm election year and much of the year before the presidential election. Historically, that has been a friendlier policy and liquidity backdrop for financials than the choppy early-midterm months, which helps explain why this specific slice of the cycle has produced 6 winners out of 6 for XLF.
Second, levels. With the ETF hovering just below its 52-week high and well above its 52-week low, traders will be watching whether pullbacks stay shallow relative to the double-digit drawdowns seen in some prior windows, or whether macro shocks around rates and regulation recreate those deeper dips.[2][3][5] A pattern of higher lows into the fall and winter would rhyme with the historical seasonal trend, while a sustained break lower would mark a clear departure from the last six midterm-year cycles.
Third, the macro and policy calendar. Upcoming data on inflation, labor markets and credit conditions will feed directly into expectations for the Fed’s path, which in turn drives net interest margins and loan growth for XLF’s biggest holdings.[1][5] Any renewed push on banking regulation or capital requirements could also matter more than usual in this phase of the election cycle, when policy debates tend to sharpen.
Finally, watch how flows and positioning respond if the seasonal pattern starts to assert itself. If financials continue to lag the broader market despite a historically strong window, that would signal that macro headwinds are overpowering the usual midterm-to-pre-election tailwind. If, instead, XLF begins to grind higher on rising volume and renewed options interest around earnings and policy events, it would look more like a replay of prior cycles, where the sector quietly made up ground during this long trading window.[1][3][4][6]
Sources
- MarketBeat - XLF Performance Falls in 2026 as Financials Lag; Rates and Mortgage Policy in Focus
- MarketBeat - Financial Select Sector SPDR Fund (XLF) Price, Holdings, & News
- Yahoo Finance - XLF vs EUFN: Is a U.S. Financials ETF Superior to a Europe-Focused Fund?
- Zacks - Should You Invest in the State Street Financial Select Sector SPDR ETF (XLF)?
- Yahoo Finance / 24/7 Wall St. (syndicated) - The XLF Financial Sector ETF Puts 25% of Your Money in Just Two ...
- GuruFocus - Key Pivot Points for Financial Select Sector (XLF)
About this seasonal analysis
Seasonal pattern data is sourced from TradeWave.ai, which analyzes historical price behavior across annual calendar windows going back up to 30 years. Read the full data methodology or the book The 100-Year Pattern by Afshin Moshrefi (2026 edition). Past performance of seasonal patterns does not guarantee future results. This article is for informational purposes only and does not constitute investment advice.