6-for-6 Midterm Sweep: S&P 500 Technology Sector SPDR (XLK) Averages 12.8% Gains
S&P 500 Technology Sector SPDR is nearing a midterm-year seasonal window that has historically favored tech bulls, even as traders weigh rates, earnings and policy risk into 2027.

What is the seasonal pattern for S&P 500 Technology Sector SPDR (XLK)?
S&P 500 Technology Sector SPDR has risen in 6 of 6 midterm-year Sep 17–Apr 24 windows, with an average gain of 12.8% in winning years.
- 6 for 6 in this window, with XLK posting gains every time and averaging 12.8% profit across winning years.
- The seasonal window begins on Sep 17 and runs 220 days through Apr 24, covering the late midterm year into the early pre-election year.
- Percent Profitable stands at 100%, with 6 winners and 0 losers across the last six midterm election years.
- Annualized return for the pattern is 12.73%, compounding to a cumulative 105% across the six completed windows.
- The TradeWave Ratio is 1.61, indicating that price has typically traveled meaningfully in the long direction within the window, while the Sharpe ratio of 2.56 points to a historically strong risk-adjusted profile.
- Individual years have still seen sizable drawdowns inside the window, with adverse moves reaching more than 20% in the weakest stretch before recovering into gains.
According to historical data from TradeWave.ai, this mid-September to late-April stretch has behaved very differently from an average year for XLK. The next section walks through that election-cycle pattern in detail, without making any prediction about what comes next.
How has S&P 500 Technology Sector SPDR (XLK) traded in the Sep 17–Apr 24 window?
The seasonal window that begins on Sep 17 and runs 220 days into Apr 24 has been a clean sweep for XLK in the last six midterm election years, with gains in every single cycle and an average profit of 12.8%. That record sits inside the broader presidential election framework, where late midterm into early pre-election periods have often coincided with friendlier policy tone and improving risk appetite for growth sectors.
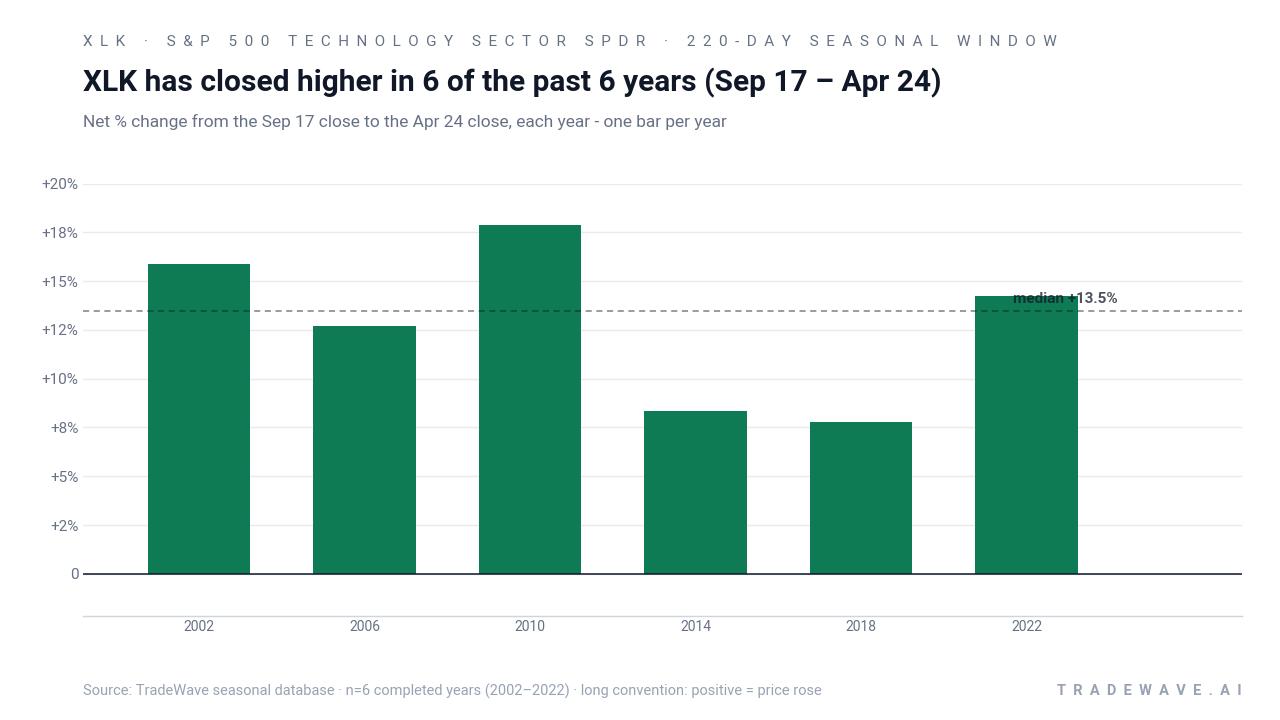
In this pattern, the trade direction is explicitly long. Across the six completed midterm-year samples, XLK finished higher every time, delivering a 100% Percent Profitable record with 6 winners and 0 losers. Average profit across those winning years is 12.8%, while the annualized return for the window clocks in at 12.73%, and stacking the windows compounds to a 105% cumulative gain over the sample.
The per-year breakdown shows how that plays out in practice. The strongest window came in 2010, when XLK gained 17.86% between the Sep 17 entry and the Apr 24 exit, after reaching a best intra-window gain of 20.67%. The softest outcome was 2018, which still finished up 7.77% but saw a much rougher ride inside the window, including a worst drawdown of 21.6% from the entry before recovering into the final gain.
Those swings highlight the role of intraperiod excursions. Maximum favorable move, or MFE, captures the best point-to-peak rally from the entry during the window, while maximum adverse move, or MAE, tracks the worst drawdown from that same entry. In 2002, for example, XLK’s 15.87% net gain came with a 31.85% best run-up and a 15.55% worst drawdown, underscoring that even winning years have contained sizable air pockets.
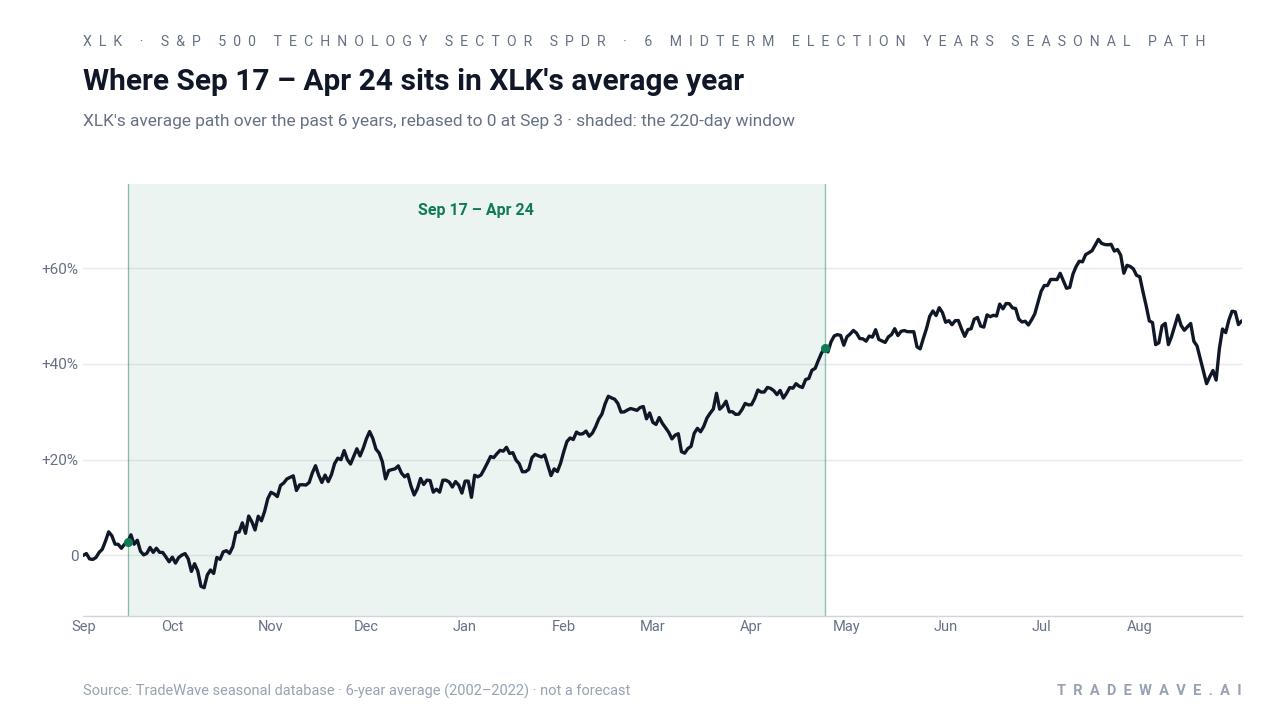
The historical seasonal average chart shows a pattern that tends to build gradually rather than spike. XLK’s typical path in these midterm-year windows starts with a modest lift after mid-September, then accelerates through the turn of the year and into the first quarter, consistent with a backdrop of year-end positioning, new-year risk budgets and early pre-election optimism.
A second view combines net results with both best and worst intra-window moves to show how far XLK has swung in each cycle.
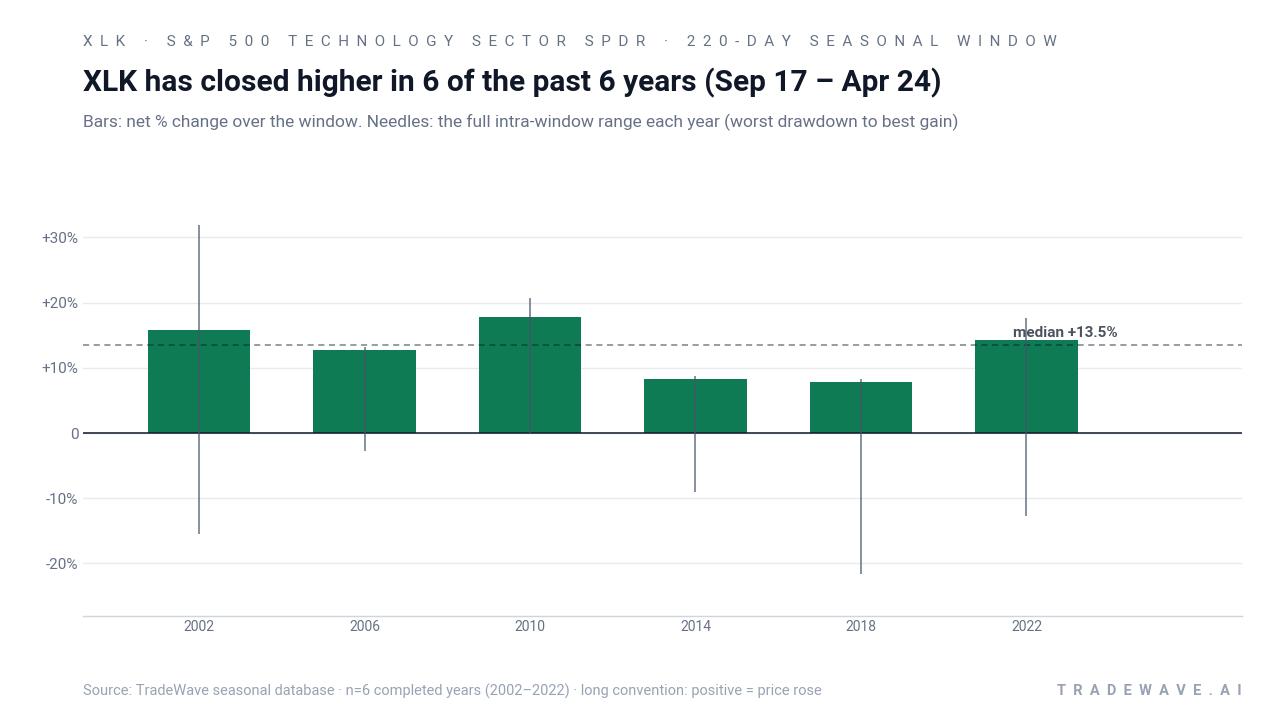
The combined net/MFE/MAE view makes the volatility profile clear. In the better-behaved years such as 2006 and 2014, XLK’s maximum favorable move sat only a few points above the final gain and the worst drawdown stayed in the single digits, suggesting a relatively smooth climb. In more turbulent cycles like 2018 and 2022, the ETF still finished higher but only after enduring double-digit adverse moves, which would have tested any trend follower riding the seasonal pattern in real time.
History does not guarantee future results; adverse excursions (MAE) can be large even in winning windows.
Why does S&P 500 Technology Sector SPDR (XLK) follow this seasonal pattern?
One likely driver is the way the tech sector lines up with the policy and liquidity backdrop from late midterm year into the pre-election year, when Washington often shifts from tightening rhetoric toward a more market-friendly stance. Analysts have also pointed to the clustering of major product launches, cloud spending cycles and corporate IT budget resets around year-end, which can support earnings expectations for XLK’s largest holdings. The pattern may further reflect institutional portfolio rebalancing, as managers add back to growth and technology exposure once early midterm volatility has passed.
What is driving S&P 500 Technology Sector SPDR (XLK) today?
XLK last closed at 180.05, leaving it well below its 52-week high of about 198.26 and far above its 52-week low near 63.40, after gaining 3.3% over the past month. The ETF has been trading with 20-day average volume around 7.9 million shares and sits modestly under its 50-day moving average of roughly 182.93, a setup that suggests consolidation rather than a blow-off top or deep correction. With no single earnings date or macro headline dominating the tape, flows in the fund continue to act as a barometer for broader sentiment toward mega-cap software, semiconductors and hardware names that dominate the S&P 500’s technology sleeve.
The chart below shows XLK’s past year of trading alongside a 60-day historical seasonal projection for context.
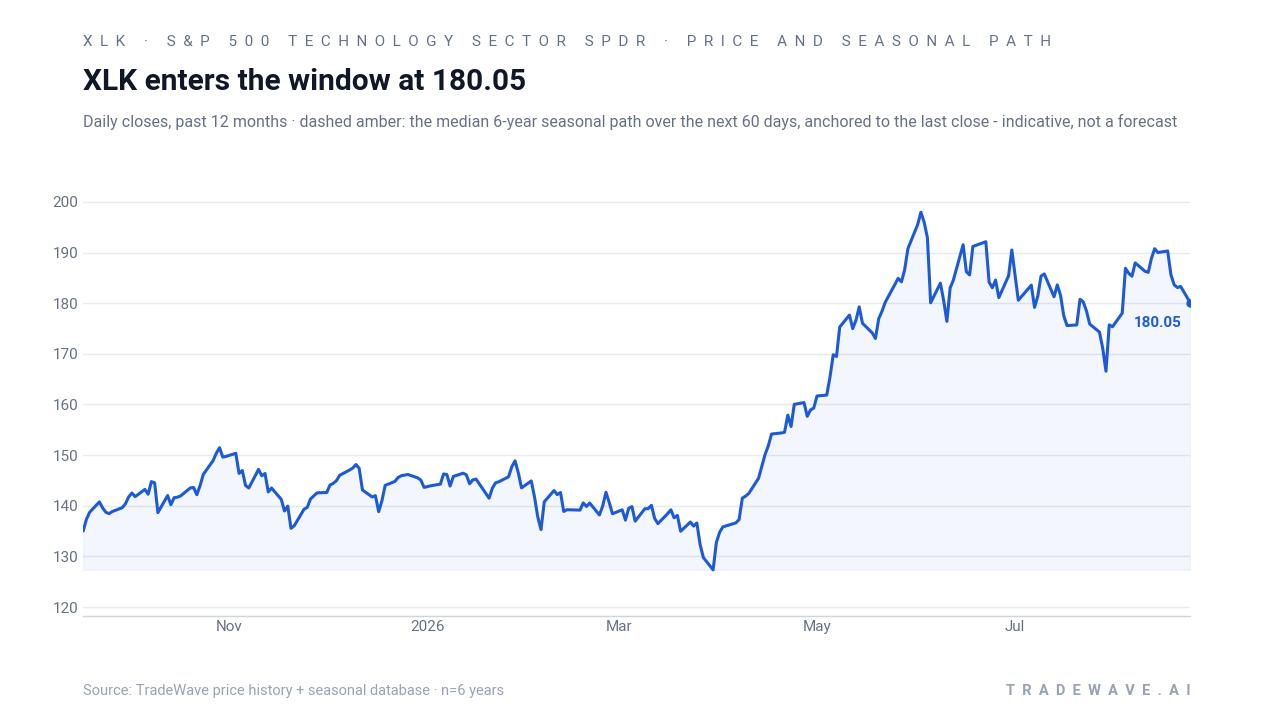
On this view, the ETF’s recent sideways drift sits against a backdrop where the median historical path has tended to tilt higher into the autumn. The gap between the actual line and the dashed seasonal path is not a signal by itself, but it does frame how different the coming weeks could look if the midterm-year pattern starts to reassert. For traders who watch both macro and micro drivers, the key question is whether upcoming data on inflation, rates and tech earnings will support a renewed push toward the prior highs or keep XLK pinned in a range as the seasonal window opens.
What should traders watch as the Sep 17–Apr 24 XLK window approaches?
First, the calendar. The 220-day window kicks in on Sep 17, placing the bulk of the pattern squarely in the concluding midterm election year and the early months of the year before the presidential election. Historically, that transition has lined up with a friendlier policy tone and stronger risk appetite, which has often benefited technology leadership.
Second, levels. On the upside, traders will be watching whether XLK can reclaim and hold above its 50-day moving average and then challenge the 52-week high near 198.26 as the window progresses. On the downside, any break that drags the ETF meaningfully below the recent consolidation band while the seasonal window is active would mark a clear departure from the historical pattern, especially if accompanied by rising volume.
Third, behavior inside the window. In prior cycles, even the winning years have seen sharp drawdowns, with MAE readings that reached into the teens or low 20s before the ETF recovered into gains. If the upcoming window again features early weakness followed by a grind higher into the first quarter, that would rhyme with the historical XLK seasonal trend. A smooth, low-volatility climb would actually be less typical than a choppy path that still resolves higher by late April.
Finally, macro and policy catalysts. The window spans several Federal Reserve meetings, a full earnings season for the tech heavyweights and the ramp-up of the 2027 presidential campaign narrative. If those events line up with improving guidance and a stable or easing rate backdrop, they could help the historical midterm-to-pre-election tech pattern show up again. If instead policy uncertainty or growth concerns dominate, traders should be ready for the possibility that this time the seasonal script does not play out the way the last six cycles did.
Sources
About this seasonal analysis
Seasonal pattern data is sourced from TradeWave.ai, which analyzes historical price behavior across annual calendar windows going back up to 30 years. Read the full data methodology or the book The 100-Year Pattern by Afshin Moshrefi (2026 edition). Past performance of seasonal patterns does not guarantee future results. This article is for informational purposes only and does not constitute investment advice.