Nasdaq QQQ Invesco ETF (QQQ) Has Risen in 6 of 6 Midterm Sep-Jul Windows, Averaging 24% Gains
Nasdaq QQQ Invesco ETF is trading just under record highs as it approaches a 316-day midterm-year seasonal window that has never been negative in the past six cycles, putting a spotlight on tech-heavy risk into 2027.

What is the seasonal pattern for Nasdaq QQQ Invesco ETF (QQQ)?
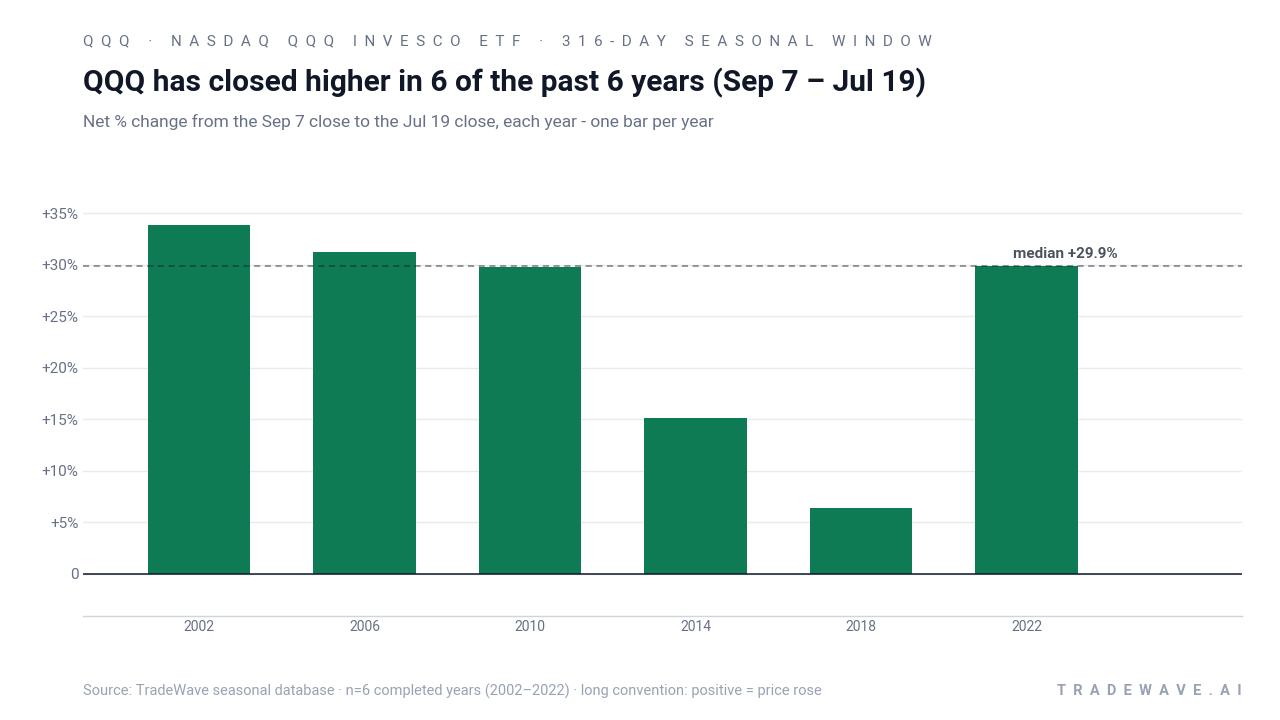
Nasdaq QQQ Invesco ETF has risen in 6 of 6 midterm-election-year Sep 7 to Jul 19 windows, with an average gain of 24.37% in winning years.
- 6 for 6 in this window, averaging 24.37% gains in winning years across the last six midterm election cycles.
- Seasonal window runs from Sep 7 to Jul 19, spanning 316 days that historically favor long exposure in QQQ.
- Percent Profitable is 100%, with 6 winners and 0 losers in the sample of midterm election years.
- Median profit of 29.86% and cumulative return of 262% show how strongly this QQQ seasonal trend has stacked over time.
- TradeWave Ratio of 1.87 and Sharpe ratio of 1.9 point to sizable directional moves with solid risk-adjusted returns in this Nasdaq QQQ Invesco ETF trading window.
- Intraperiod swings have included double-digit drawdowns in some years, so the historical seasonality comes with real volatility risk.
According to historical data from TradeWave.ai, this midterm-to-pre-election stretch has behaved very differently from an average year for QQQ, and the next iteration is about to open.
How strong is the upcoming seasonal window for Nasdaq QQQ Invesco ETF (QQQ)?
Nasdaq QQQ Invesco ETF has closed higher in every single Sep 7 to Jul 19 midterm-election-year window since 2002, averaging gains of 24.37% across six cycles. At 706.32, QQQ sits about 5.4% below its 52-week high of roughly 747.00 and well above its 52-week low near 554.18, leaving it elevated but not stretched into the new regime.[2] Unusual options activity flagged on QQQ’s options chain suggests traders are already positioning around this tech-heavy seasonal setup, with open interest and flow skewed toward active contracts ahead of the fall.[5]
The presidential election cycle matters here because this pattern only looks at the last six midterm election years, then follows QQQ from early September of that midterm year into July of the following pre-election year. That aligns the seasonal analysis with a period when Washington often shifts from policy tightening and rate scares toward a more market-friendly stance ahead of the next presidential race, a backdrop that has historically supported growth and technology leadership.[1]
Across the six completed midterm-election-year samples, the trade direction is firmly long. Percent Profitable is 100%, with 6 winners and 0 losers, and the median gain of 29.86% shows that the upside has not been driven by a single outlier year. Average profit of 24.37% across all years lines up with a 23.94% annualized return and a Sharpe ratio of 1.9, which is high for a window that runs almost an entire year.
The per-year table shows how that plays out in practice. The weakest outcome was 2018, when QQQ still finished the window up 6.39% despite a maximum adverse move of about -20.42% from the entry, reflecting the late-2018 tech selloff before a sharp recovery into the following summer. On the stronger side, 2002, 2010 and 2022 each delivered net returns around 30%, with maximum favorable moves between roughly 30% and 42%, underscoring how powerful this QQQ seasonal trend has been in midterm cycles.
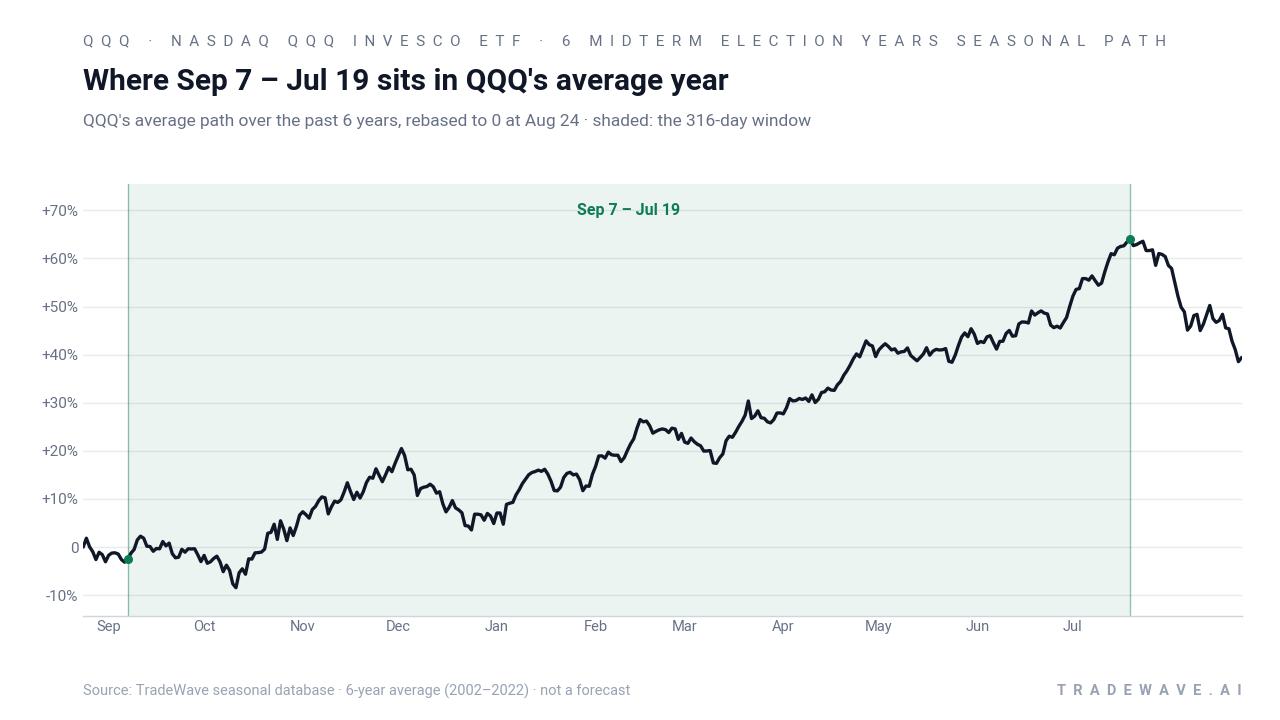
The historical seasonal average chart shows QQQ typically grinding higher through most of the 316-day stretch, with gains accruing gradually rather than in a single burst. The path tends to firm up into year-end, wobble around macro headlines and earnings in the first half of the following year, then finish the window near its highs as the pre-election year narrative takes hold.
Intraperiod ranges highlight how much QQQ has swung inside this otherwise bullish window.
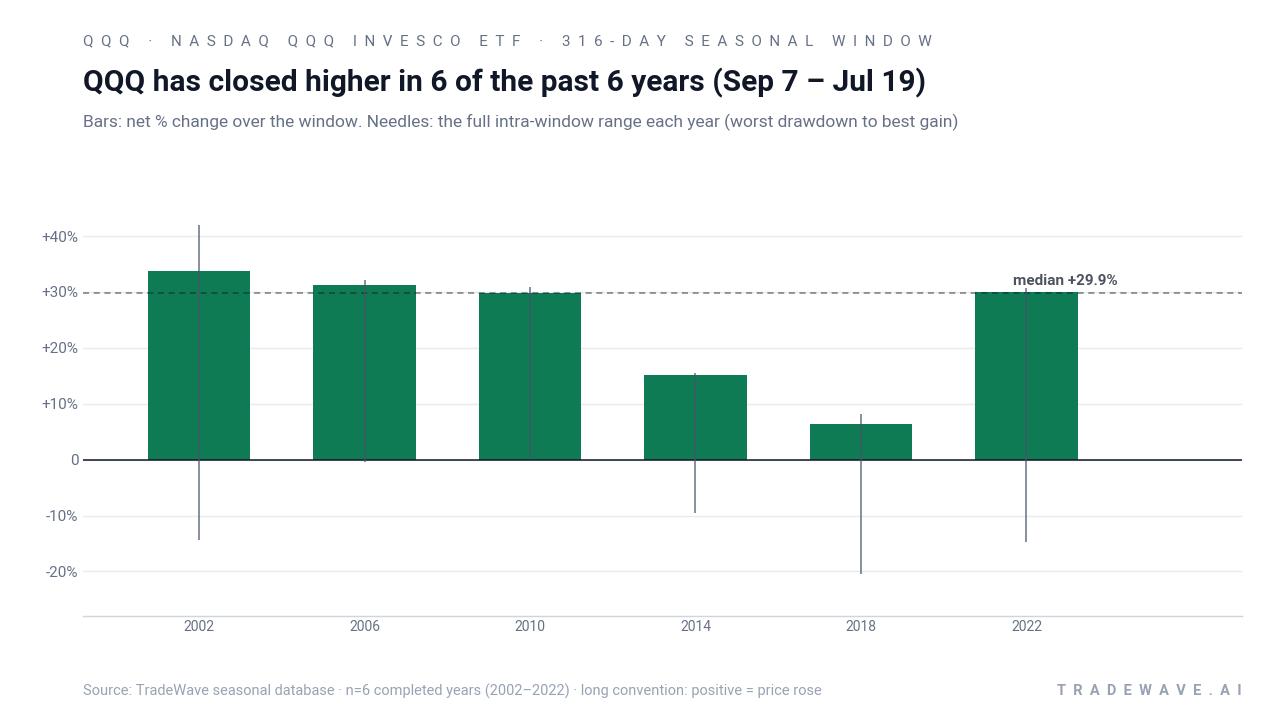
The combined net / maximum favorable / maximum adverse excursion chart makes that volatility clear. In 2018, for example, QQQ’s worst drawdown of about -20.42% came well before the final positive close, while 2002 and 2022 saw deep but more contained setbacks of roughly -14% before finishing near their maximum favorable moves around 30% to 42%. Large maximum favorable excursions paired with meaningful maximum adverse moves fit a high-variance but ultimately upside-biased window, which is consistent with a TradeWave Ratio of 1.87 that signals substantial travel in the trade direction.
History does not guarantee future results; adverse excursions can be large even in winning windows, and QQQ’s past drawdowns inside this pattern have reached double digits.
Why does Nasdaq QQQ Invesco ETF (QQQ) follow this seasonal pattern?
One likely driver is the way the presidential election cycle shapes policy and liquidity, with midterm-year volatility often giving way to a more supportive backdrop as the pre-election year approaches. Analysts also point to the clustering of mega-cap tech earnings, buyback programs and index rebalancing in this stretch, which can funnel flows into QQQ’s largest holdings like Apple, Microsoft and Nvidia.[1] The pattern may also reflect investors using QQQ as a core vehicle for risk-on positioning once midterm uncertainty clears, reinforcing the historical seasonality in this Nasdaq QQQ Invesco ETF trading window.
What is driving Nasdaq QQQ Invesco ETF (QQQ) today?
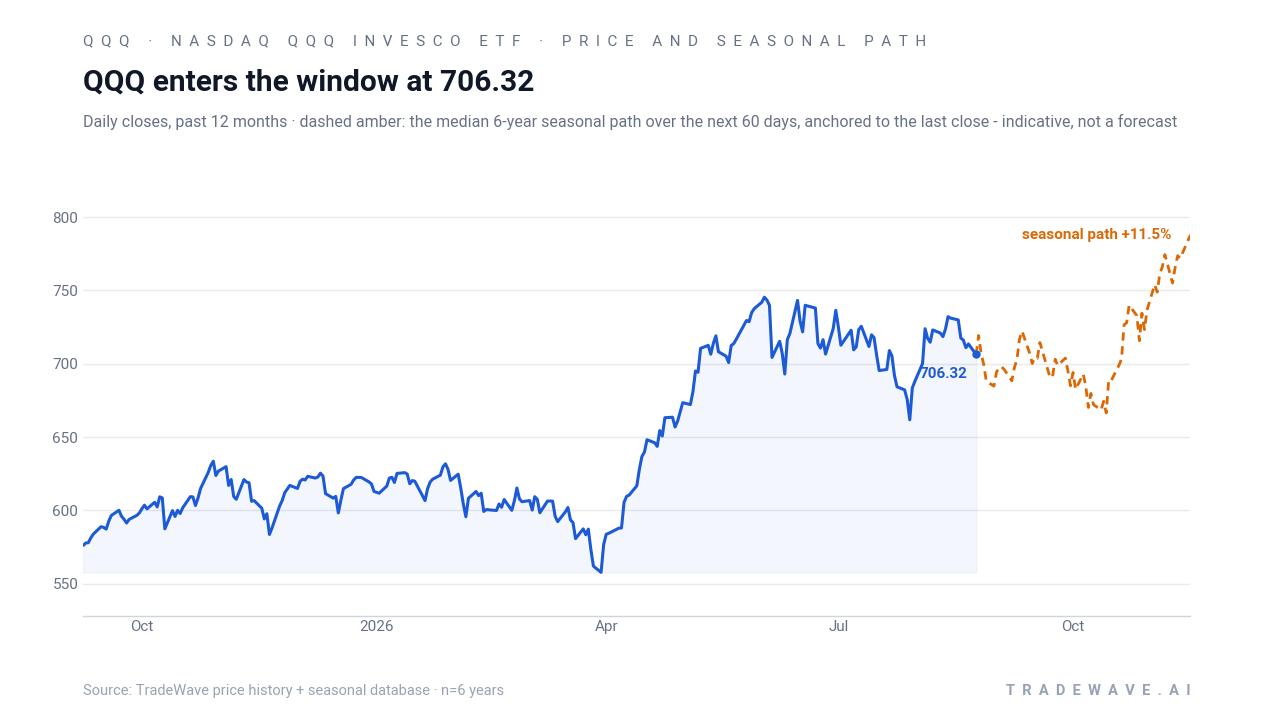
Nasdaq QQQ Invesco ETF slipped about 1% in the prior session to 706.32, leaving it roughly 5.4% below its 52-week high near 747.00 and well above its 52-week low around 554.18, with 20-day average volume running near 39 million shares.[2] The pullback comes as Treasury yields edge higher and traders parse central bank commentary around the Jackson Hole gathering, a combination that has pressured long-duration growth stocks and the technology-heavy QQQ basket in recent days.[1] At the same time, institutional filings show asset managers such as IMS Investment Management Services, Baker Avenue Asset Management and Industrial Alliance Investment Management increasing positions in QQQ, reinforcing its role as a core vehicle for broad tech exposure.[2][3][4] Options data also flag unusual activity on QQQ’s options chain, suggesting that some traders are using calls and puts rather than cash equities to express views on the next leg for mega-cap tech.[5]
The chart below shows QQQ’s past year of trading alongside a 60-day historical seasonal projection.
What should traders watch as this QQQ seasonal window opens?
First, the calendar: the 316-day window begins on Sep 7 and runs through Jul 19, overlapping the heart of the midterm-to-pre-election phase that has historically been friendly to QQQ. Behavior in the first few months will be important; in prior cycles, strong years often saw QQQ hold or reclaim highs quickly after early drawdowns, while weaker but still positive years like 2018 featured deeper air pockets before recovering.
Second, macro catalysts will matter, especially the path of yields and central bank messaging coming out of Jackson Hole and subsequent policy meetings, given QQQ’s sensitivity to discount-rate expectations.[1] If higher yields persist and compress valuations for mega-cap tech, any deviation from the historical seasonal pattern could show up as shallower rallies or more persistent drawdowns inside the window.
Third, traders should keep an eye on the unusual options activity already visible in QQQ contracts, watching whether call buying, put hedging or skew continues to build as Sep 7 approaches.[5] A sustained pickup in bullish call flow would align with the historical upside bias, while heavy put demand or rising implied volatility could signal that the market is bracing for a more volatile or asymmetric outcome than the past six midterm-year windows delivered.
Finally, key levels matter: the 52-week high near 747.00 and the 50-day moving average around 713.06 are likely to act as reference points for trend followers and systematic strategies.[2] How QQQ behaves around those levels inside the window will help confirm whether this powerful historical seasonality is repeating or starting to fade.
Sources
- Seeking Alpha - Invesco QQQ Trust, Series 1 ETF (QQQ) Latest Stock Analysis | Seeking Alpha
- MarketBeat - Invesco QQQ $QQQ is Analyst IMS Investment Management Services Ltd.'s Largest Position
- MarketBeat - Baker Avenue Asset Management LP Grows Position in Invesco QQQ $QQQ
- MarketBeat - Invesco QQQ $QQQ Shares Bought by Industrial Alliance Investment Management Inc.
- Yahoo Finance - Invesco QQQ Trust (QQQ) Options Chain - Yahoo Finance
About this seasonal analysis
Seasonal pattern data is sourced from TradeWave.ai, which analyzes historical price behavior across annual calendar windows going back up to 30 years. Read the full data methodology or the book The 100-Year Pattern by Afshin Moshrefi (2026 edition). Past performance of seasonal patterns does not guarantee future results. This article is for informational purposes only and does not constitute investment advice.