S&P 500 Healthcare Sector SPDR (XLV) Has Risen in 5 of 6 Sep 3-Nov 6 Midterm Windows
S&P 500 Healthcare Sector SPDR is entering a 65-day late midterm-year seasonal window with a strong bullish record, just as the ETF trades near record highs and investors rotate back toward defensive healthcare exposure.

What is the seasonal pattern for S&P 500 Healthcare Sector SPDR (XLV)?
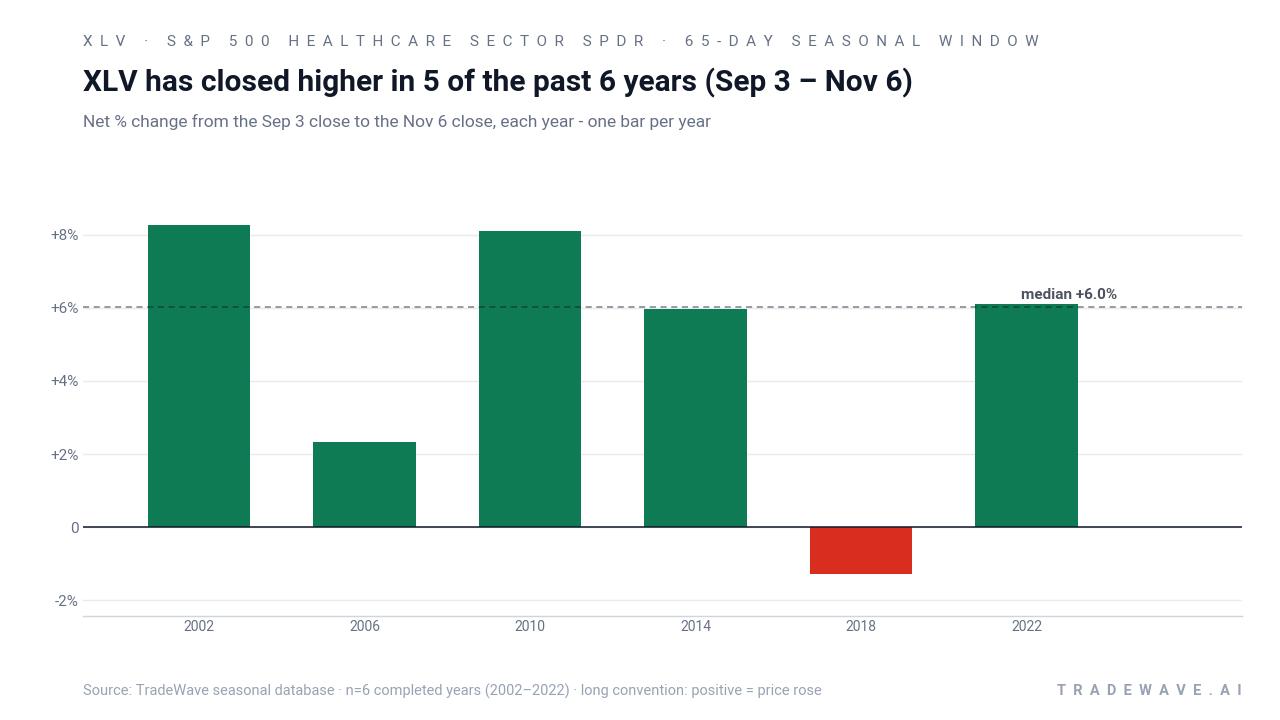
S&P 500 Healthcare Sector SPDR has risen in 5 of 6 late midterm-year Sep 3–Nov 6 windows, with an average gain of 6.15% in winning years.
- 5 wins and 1 loss in this 65-day Sep 3–Nov 6 window across the last 6 midterm election years, a 83% win rate for long exposure.
- Trade Direction: long, with Avg Profit of 6.15% in winning years and Avg Profit - All of 5% once the lone losing year is included.
- The window has compounded to a 32% cumulative gain across the six completed cycles, highlighting a persistent XLV seasonal trend in late midterm years.
- Intraperiod swings have been meaningful, with individual years showing several percentage points of downside before finishing higher, underscoring drawdown risk inside an otherwise bullish pattern.
- The current iteration begins Sep 3, 2026 and runs 65 calendar days, overlapping the transition from the concluding midterm election year into the historically supportive pre-election year backdrop for defensives like healthcare.
According to historical data from TradeWave.ai, this specific late midterm-year stretch has behaved differently from an average autumn for XLV, with a clear directional bias that many investors overlook.
How has S&P 500 Healthcare Sector SPDR (XLV) traded in this late midterm-year window?
S&P 500 Healthcare Sector SPDR has closed higher in 5 of the past 6 Sep 3–Nov 6 windows during midterm election years, averaging 6.15% gains in the winning cycles. The latest 65-day window opens with XLV around 171.16, up 11.78% year to date and sitting about 3.1% below its 52-week high of 176.6.[2][5]
The presidential election-cycle lens matters here because this pattern is built only from late midterm election years, a phase that often sees Washington gridlock, calmer policy headlines and a gradual shift toward the historically stronger pre-election year. For a defensive sector like healthcare, that backdrop has often coincided with steady inflows as investors rebalance away from early-cycle growth winners and toward earnings stability.
Across the six completed midterm-year samples since 2002, XLV’s 65-day window produced a 32% cumulative gain when the returns are stacked, with only 2018 finishing modestly negative at about a 1.28% loss. The strongest years, such as 2002 and 2010, delivered window gains of 8.26% and 8.1% respectively, while even the softer 2006 and 2014 cycles still finished in positive territory. The lone down year still saw a sizable intraperiod rally before rolling over, which is why the all-years average remains a solid 5% despite that setback.
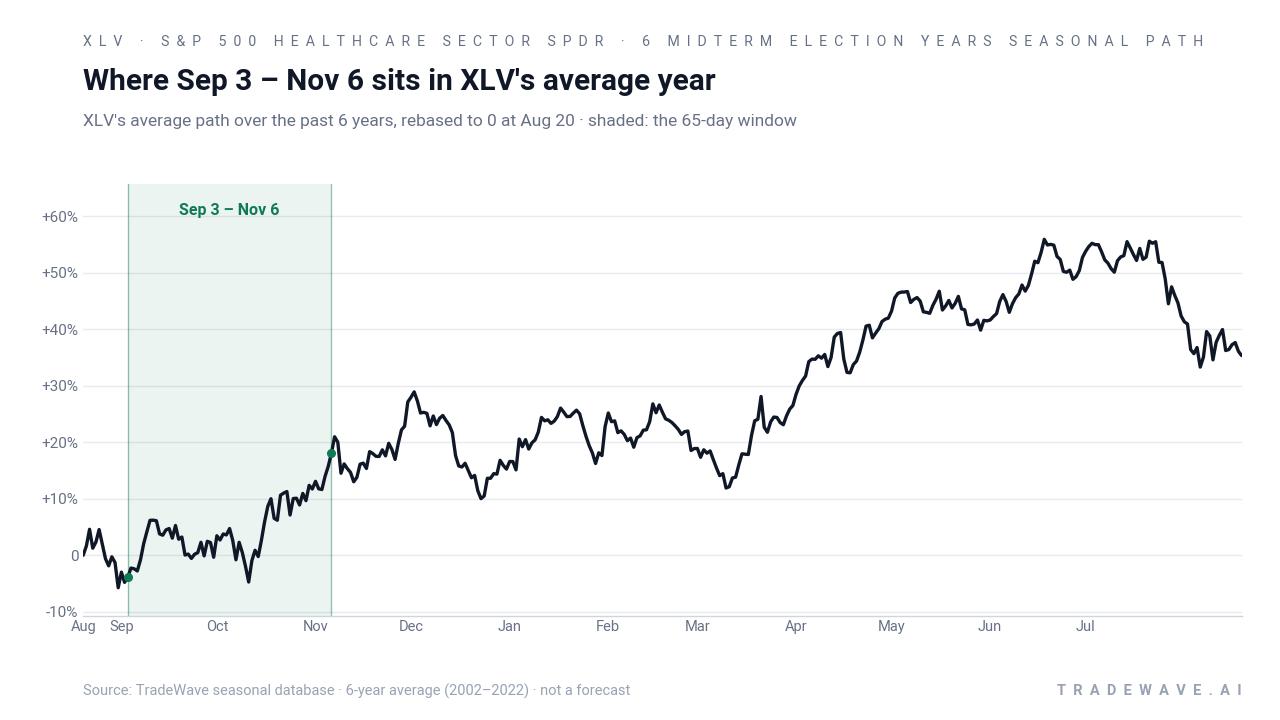
The historical seasonal average suggests that strength in this window often builds gradually rather than spiking on day one. In several years, XLV chopped sideways or even dipped early in September before the bulk of the advance arrived in October, which fits the pattern of investors repositioning after summer and ahead of year-end.
A closer look at each year’s best and worst intraperiod swings shows how much room XLV has historically had to move inside this window.
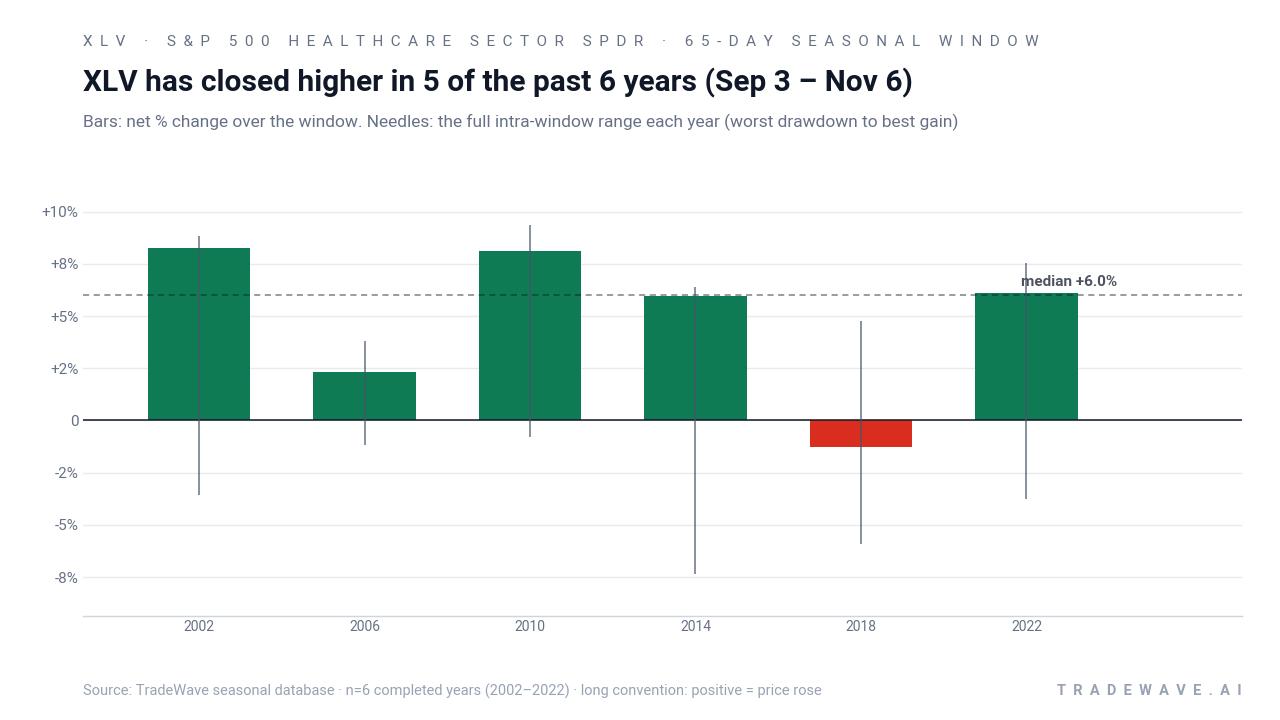
The maximum favorable move and maximum adverse move profile is telling. In strong years like 2010, XLV’s best intraperiod rally ran ahead of the final close, while the worst drawdown stayed relatively shallow, under 4%. In contrast, 2014 and 2018 saw deeper temporary drops of roughly 6% to 7% from entry before recovering, a reminder that even a bullish seasonal window can involve uncomfortable volatility along the way.
Put together, the pattern is straightforward: this 65-day late midterm-year stretch has historically favored long positions in XLV, with five wins out of six, mid-single-digit average gains and drawdowns that have usually been manageable but occasionally sharp.
History does not guarantee future results; adverse excursions (MAE) can be large even in winning windows.
Why does S&P 500 Healthcare Sector SPDR (XLV) follow this seasonal pattern?
One likely driver is the way the healthcare earnings calendar and policy news flow cluster in the back half of midterm years, when Washington often shifts from legislating to campaigning and regulatory risk feels less acute. Analysts have also pointed to institutional portfolio repositioning, as managers lock in gains in cyclical sectors and rotate toward defensive groups like healthcare ahead of the pre-election year. The pattern may also reflect year-end index and sector rebalancing, which can amplify flows into large-cap healthcare names that dominate XLV’s holdings.[3][7]
What is driving S&P 500 Healthcare Sector SPDR (XLV) today?
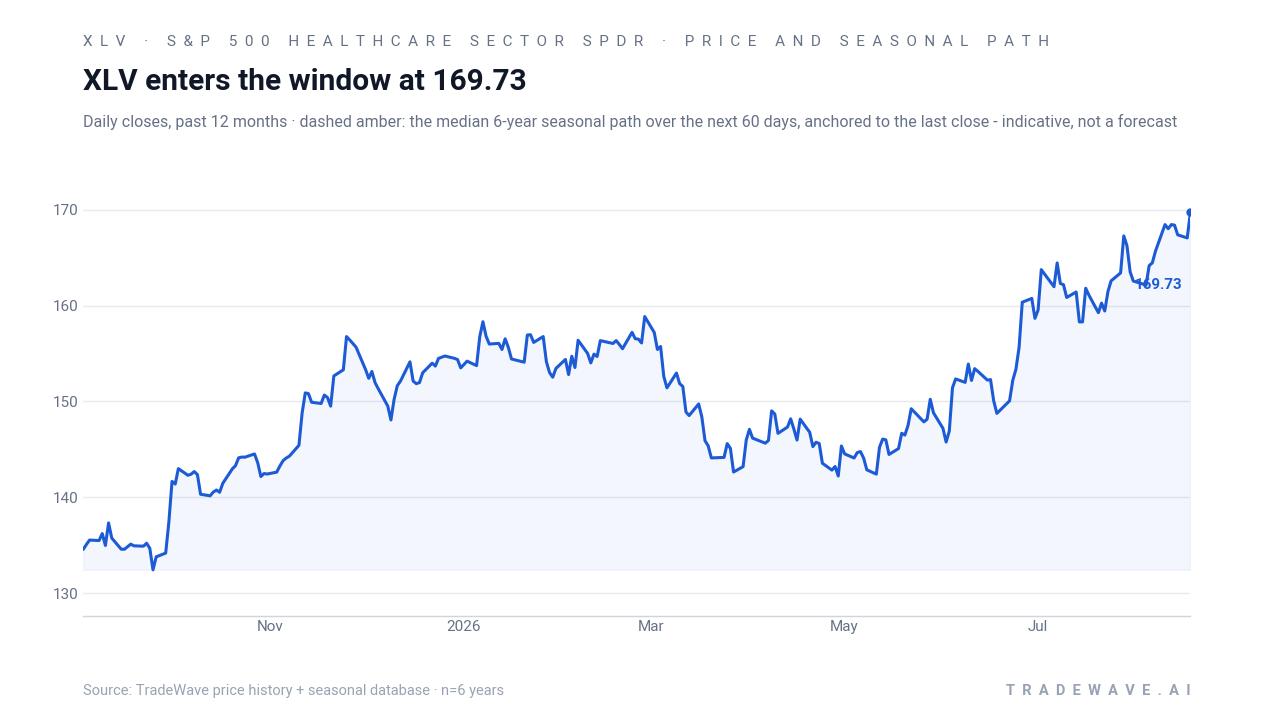
S&P 500 Healthcare Sector SPDR slipped about 0.24% in the latest session to roughly 171.16, leaving the ETF up 11.78% so far in 2026 and about 3.1% below its 52-week high of 176.6.[2][5][9] That move comes after a steady rebound in healthcare stocks this year as investors have rotated toward defensive sectors while trimming exposure to stretched technology names, with XLV benefiting from renewed interest in large-cap drugmakers, insurers and medical device makers.[3][8]
Under the surface, several storylines are shaping the healthcare sector outlook. A June analysis highlighted Eli Lilly’s weight-loss drugs Mounjaro and Zepbound as key revenue engines, with pricing and demand for these therapies seen as important drivers for XLV’s pharma-heavy portfolio.[6] At the same time, commentary in July suggested the sector may be pausing after a strong run, arguing that while healthcare is on the mend, upside could be more limited from here as valuations reset and investors weigh policy risk.[4] Another thread is policy: a 15% cap on pharma imports in U.S. trade deals has been framed as easing some of the long-running policy discount on the group, though the impact is uneven across constituents.[6]
The chart below situates the latest move in its recent multi-month context and overlays the historical seasonal path for this window.
Valuation is another piece of the puzzle. A recent GuruFocus note argued that XLV looks about 3.0% overvalued on its proprietary GF Value framework, reflecting how the ETF’s steady climb has pulled it slightly above fair value estimates.[9] That does not preclude further gains, but it reinforces the idea that future returns may depend more on earnings delivery, drug pipeline execution and policy clarity than on multiple expansion alone.
Sources
- Barchart - XLV Performance Report for S&P 500 Healthcare Sector SPDR ETF - Barchart.com
- Yahoo Finance - State Street Health Care Select Sector SPDR ETF (XLV) Stock Price, News, Quote & History - Yahoo Finance
- Yahoo Finance - Holdings - State Street Health Care Select Sector SPDR ETF (XLV) Holdings - Yahoo Finance
- Seeking Alpha - XLV: Healthcare Sector On The Mend, But Probably Not For Long
- Yahoo Finance (performance) - State Street Health Care Select Sector SPDR ETF (XLV) - Performance
- Yahoo Finance / 24/7 Wall St. - The 2 Factors That Will Decide Whether XLV Finally Catches the S&P 500 in 2026
- MarketWatch - State Street Health Care Select Sector SPDR ETF - XLV
- Barchart (news) - When the AI Trade Collapses, These 3 S&P 500 Sectors Are Your Best Bet
- GuruFocus - XLV Looks 3.0% Overvalued on GF Value™ - GuruFocus
About this seasonal analysis
Seasonal pattern data is sourced from TradeWave.ai, which analyzes historical price behavior across annual calendar windows going back up to 30 years. Read the full data methodology or the book The 100-Year Pattern by Afshin Moshrefi (2026 edition). Past performance of seasonal patterns does not guarantee future results. This article is for informational purposes only and does not constitute investment advice.