Nasdaq QQQ Invesco ETF (QQQ) Has Closed Higher in All 6 Midterm Sep-Jul Runs, Averaging 22.26% Gains
Nasdaq QQQ Invesco ETF is nearing a long midterm-year seasonal window that has never been negative in this dataset, just as the tech-heavy fund trades close to record highs and investors look ahead to a policy-charged pre-election year.

What is the seasonal pattern for Nasdaq QQQ Invesco ETF (QQQ)?
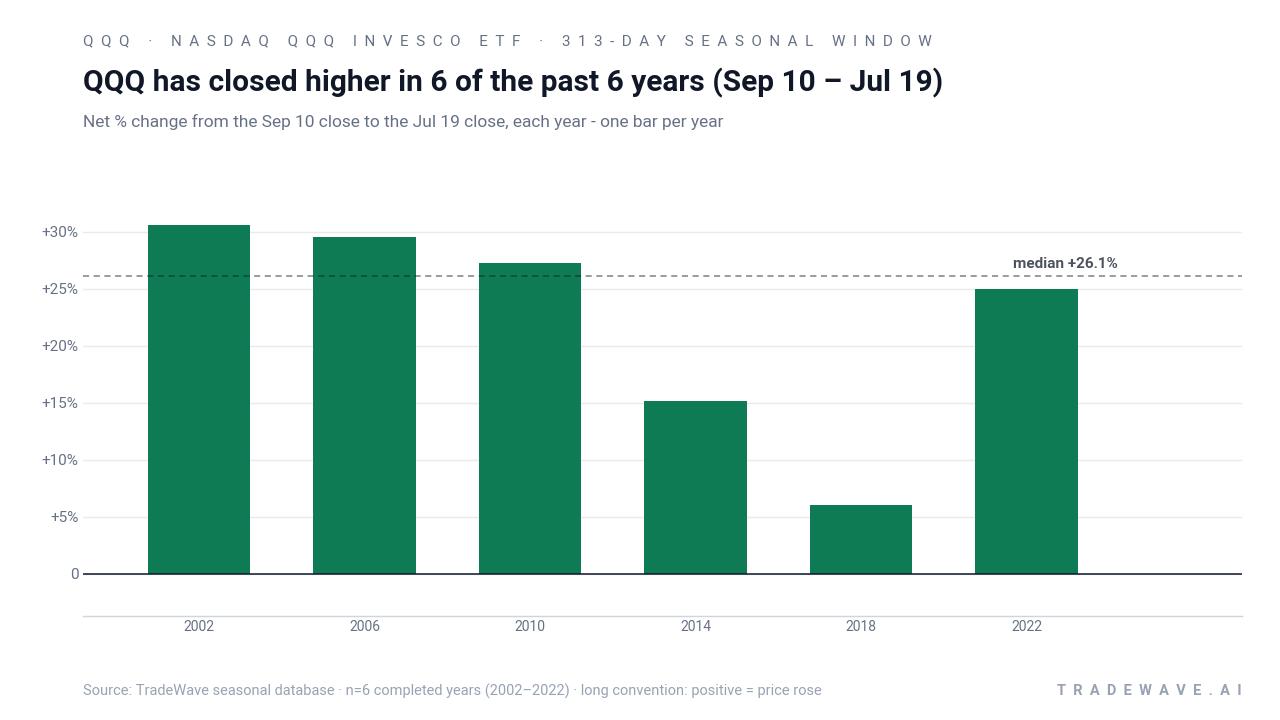
Nasdaq QQQ Invesco ETF has risen in 6 of 6 midterm-election-year Sep 10 to Jul 19 windows, with an average gain of 22.26% in winning years.
- 6 for 6 in this window, with Nasdaq QQQ Invesco ETF averaging 22.26% gains across the winning years.
- The upcoming 313-day window runs from Sep 10, 2026 through Jul 19, 2027 and is based on the last 6 midterm election years.
- Percent Profitable is 100%, with 6 winners and 0 losers in the historical sample.
- Average profit of 22.26% reflects strong upside across all completed windows, with a cumulative return of 228% when stacked.
- The TradeWave Ratio of 1.9 suggests price has typically traveled meaningfully in the long direction within the window, while the Sharpe ratio of 1.94 points to favorable risk-adjusted returns.
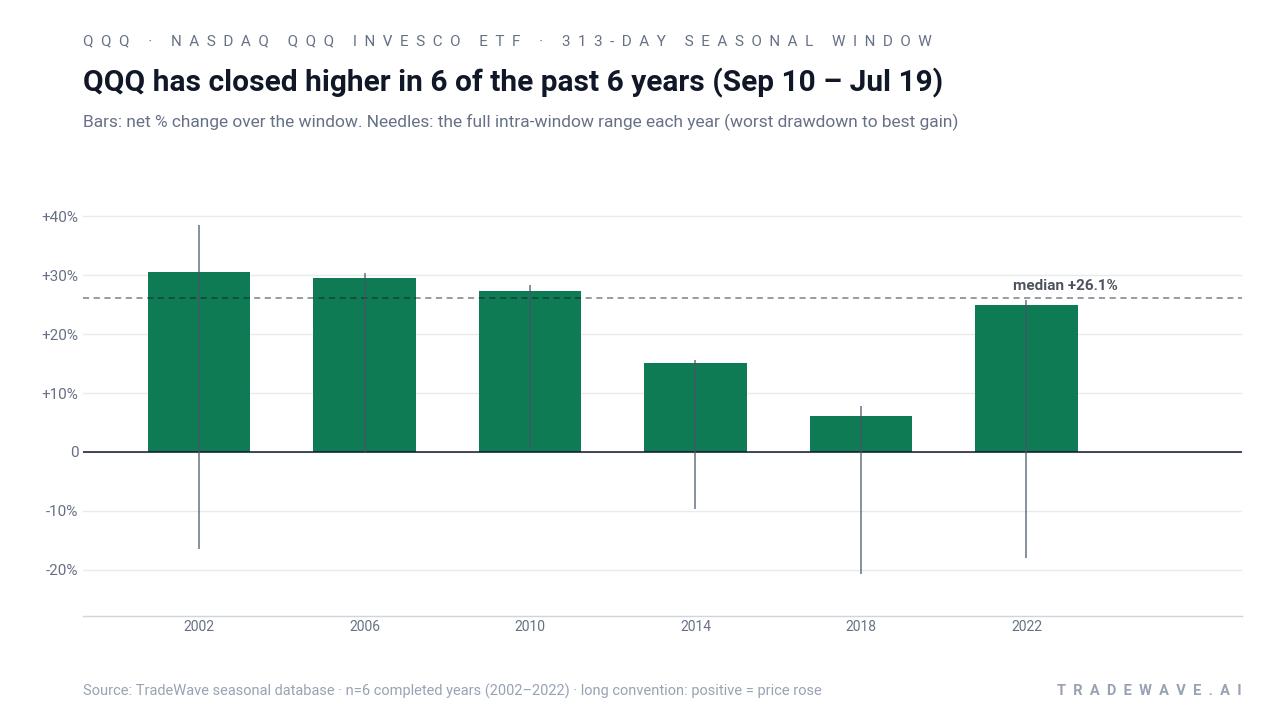
- Individual years have still seen sizable drawdowns inside the window, including adverse moves of more than 16% in 2002 and more than 20% in 2018 before finishing higher.
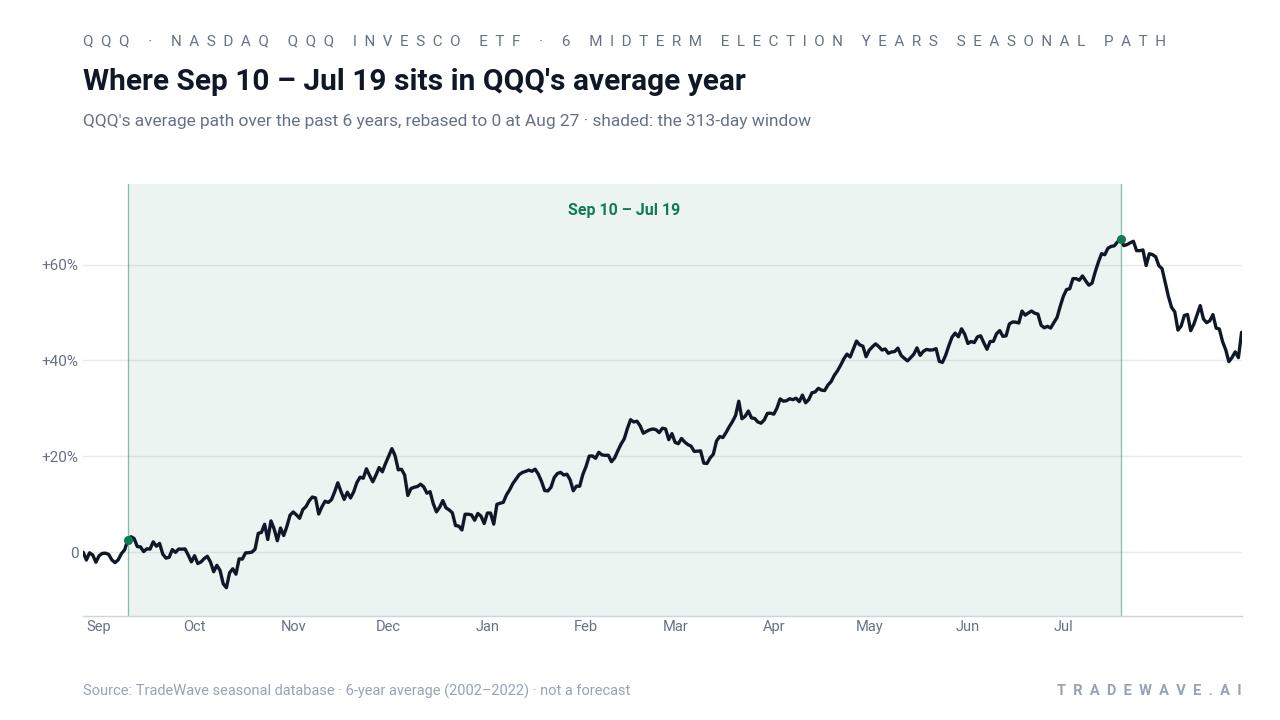
According to historical data from TradeWave.ai, this long Sep-to-Jul stretch in midterm election years has behaved very differently from an average calendar year for QQQ, and the next iteration begins in less than a week.
How has Nasdaq QQQ Invesco ETF (QQQ) traded in the Sep 10 – Jul 19 midterm window?
Nasdaq QQQ Invesco ETF has closed higher in every Sep 10 to Jul 19 window across the last six midterm election years, averaging a 22.26% gain with a 228% cumulative return when those windows are stacked. At Friday’s close around 709.24, QQQ sits about 5.1% below its 52-week high of roughly 747.00 and is up 20.09% year to date, leaving it near the top of its recent range as this historically powerful stretch approaches.[1][4]
The presidential election cycle matters here because this pattern only looks at the last six midterm election years, then follows QQQ from early September of that midterm through mid-July of the following pre-election year. That is the part of the cycle when Washington often shifts from midterm gridlock toward pre-election fiscal and regulatory positioning, a backdrop that has historically lined up with stronger risk appetite in large-cap growth and technology.
Within this 313-day Nasdaq QQQ Invesco ETF trading window, the trade direction is explicitly long. Percent Profitable is 100%, with 6 winners and 0 losers, so every midterm-year sample in this dataset finished the window in positive territory. Average profit of 22.26% means that, from the Sep 10 entry to the Jul 19 exit, QQQ has typically added a little more than one-fifth to its value across these cycles, even after including the softer 2018 outcome.
The per-year table shows how wide the range of outcomes has been. The strongest year in this sample was 2002, when QQQ gained 30.57% over the window, helped by a maximum favorable move of 38.48% at the best point-to-peak level. The weakest, though still positive, year was 2018, when the ETF added just 6.03% from entry to exit despite a best intraperiod gain of 7.79% and a sharp interim drawdown.
Those intraperiod swings are captured by the maximum favorable excursion and maximum adverse excursion. In 2018, for example, QQQ suffered a worst drawdown of 20.69% from the entry level before recovering to finish higher, while 2002 saw a 16.45% adverse move at the low point of the window. That mix of strong final gains and deep temporary losses is why the TradeWave Ratio sits at 1.9 and the Sharpe ratio at 1.94: historically, the reward has been sizable, but investors have had to sit through real volatility to capture it.
A second view that layers in both best and worst intraperiod moves shows how much air and turbulence QQQ has faced inside each of these winning windows.
Across the six completed cycles, the cumulative return from repeatedly holding only this Sep 10 to Jul 19 slice compounds to 228%. Add it up: that is more than tripling capital over the sample by being exposed only during this specific midterm-to-pre-election regime. The pattern is clear in this dataset: this long window has historically favored longs in QQQ, with every midterm-year iteration finishing in the green despite sometimes bruising drawdowns along the way.
History does not guarantee future results; adverse excursions can be large even in winning windows, and QQQ’s intraperiod drawdowns in this pattern have at times exceeded 20% before recovering.
Why does Nasdaq QQQ Invesco ETF (QQQ) follow this seasonal pattern?
This midterm-to-pre-election pattern may reflect a mix of earnings season clustering, fiscal and regulatory positioning ahead of presidential campaigns, and institutional portfolio rebalancing into growth and technology as policy visibility improves. Analysts have pointed to the Nasdaq‑100’s heavy weighting in large-cap tech and communication names, sectors that often benefit when rate expectations stabilize and risk appetite returns after midterm uncertainty.[2][3][5] The result is a window where macro, policy and sector rotation forces have historically lined up in QQQ’s favor, even if the ride has been volatile.
What is driving Nasdaq QQQ Invesco ETF (QQQ) today?
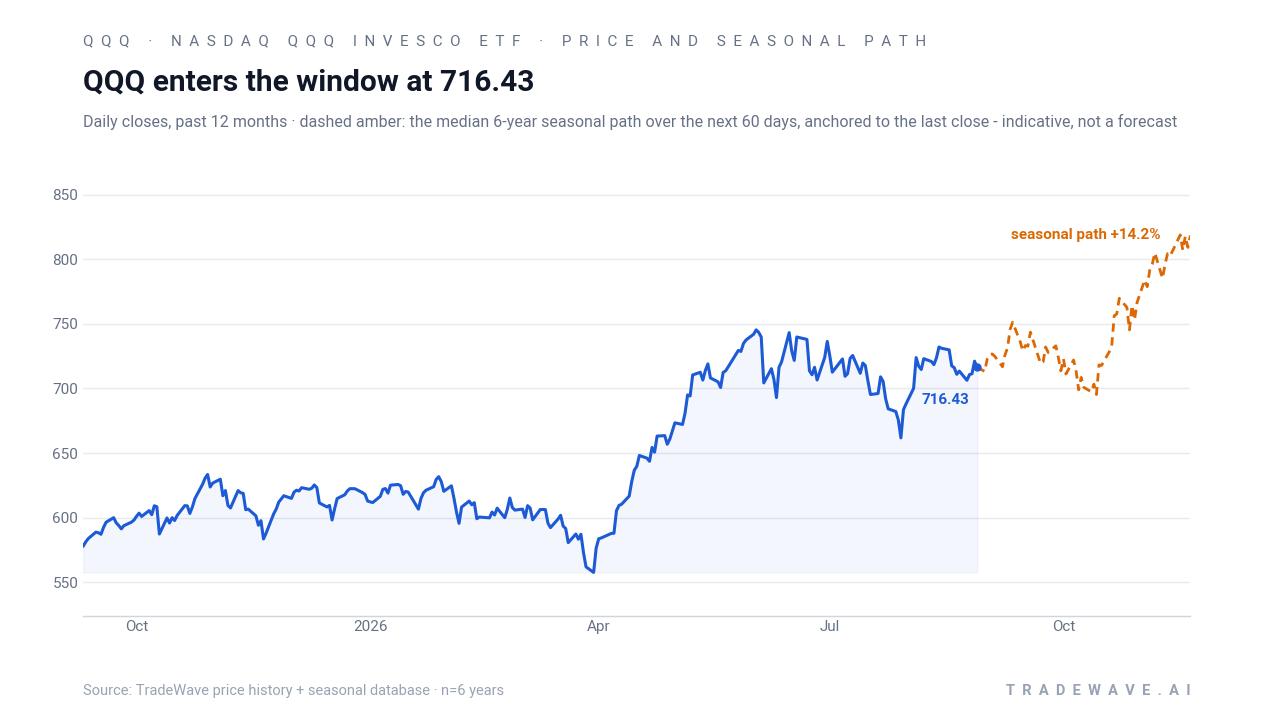
Nasdaq QQQ Invesco ETF ended the prior session around 709.24, up 0.23% on the day and roughly 20.09% higher year to date, leaving it about 5.1% below its 52-week high of approximately 747.00.[1][4] The fund has outpaced many broad benchmarks in 2026 as mega-cap technology and AI-linked names have led the tape, helped by strong results from key holdings such as Micron and the high-profile addition of SpaceX to the Nasdaq‑100 and QQQ in early July.[2][3][6]
Issuer updates from Invesco describe how the ETF’s sector tilt remains heavily skewed toward information technology, with tech exposure above 50%, which has amplified both the upside from the AI and cloud cycle and the sensitivity to any pullback in those themes.[2][5] Options and volatility trackers show active derivatives trading around QQQ, with implied volatility and put/call ratios closely watched as investors hedge concentrated tech exposure rather than as a signal of a specific one-off options shock.[7][9] Short-interest monitoring pages likewise frame positioning as an ongoing backdrop rather than a sudden squeeze or capitulation event.[8]
Macro commentary around QQQ has also flagged geopolitical risk, including the possibility that any renewed tension in the Middle East could lift energy prices, complicate the inflation path and pressure long-duration growth valuations. At the same time, valuation-focused research has argued that QQQ screens richly valued versus some historical metrics, even as flows and performance have kept it on many investors’ radar screens.[1][3][10] That mix of strong price momentum, concentrated sector risk and elevated expectations is the backdrop against which this historically strong seasonal window is about to open.
The chart below places QQQ’s latest move in the context of its past year of trading and a typical seasonal path over the next two months.
What should traders watch as this QQQ seasonal window opens?
First, the calendar: the window begins on Sep 10 and runs through Jul 19, covering the final stretch of the midterm election year and the bulk of the following pre-election year. Historically, that has been a friendlier part of the presidential cycle for growth assets, but the path has not been smooth. Traders will be watching whether any early drawdown inside the window resembles the deeper adverse moves seen in 2002 and 2018 or whether QQQ can track closer to the steadier paths of 2006 and 2010.
Second, levels: with QQQ about 5.1% below its 52-week high, the 747 area and the round 700 zone are likely to be key reference points for trend followers and options desks.[1][4] Sustained trading above the 50-day moving average and continued leadership from top holdings would be more consistent with the historical pattern of strong midterm-to-pre-election windows, while a decisive break lower accompanied by rising implied volatility would mark a departure from the prior six cycles.[2][3][7][9]
Third, the policy and macro calendar: upcoming inflation prints, Fed communications and any escalation in geopolitical risk that affects energy prices could all test the durability of this QQQ seasonal trend. If the ETF can absorb those shocks while maintaining its leadership role, it would fit the historical script of this window as a powerful, if volatile, tailwind for long exposure. If instead policy uncertainty or valuation concerns trigger a more persistent de-rating, traders will have to weigh that against a seasonal record that, so far in this dataset, has been six for six.
Sources
- Seeking Alpha - Invesco QQQ Trust, Series 1 ETF (QQQ) Price, Quote, News & Analysis
- Invesco - Quarterly Highlights for the Invesco QQQ ETF
- ETF Database - Invesco QQQ Trust Series I
- Yahoo Finance - Invesco QQQ Trust (QQQ) Latest Stock News & Headlines - Yahoo Finance
- Yahoo Finance - Should Invesco QQQ (QQQ) Be on Your Investing Radar?
- Invesco - Monthly Performance Review QQQ
- Fintel Labs - QQQ / Invesco QQQ Trust, Series 1 - Implied Volatility - Fintel Labs
- Fintel - Stock: Short Interest - Invesco QQQ Trust, Series 1 - Fintel
- Barchart - QQQ Put/Call Ratio for Invesco QQQ Trust ETF - Barchart.com
- GuruFocus - QQQ Looks 28.0% Overvalued on GF Value™ as Pivot Points Signal K
About this seasonal analysis
Seasonal pattern data is sourced from TradeWave.ai, which analyzes historical price behavior across annual calendar windows going back up to 30 years. Read the full data methodology or the book The 100-Year Pattern by Afshin Moshrefi (2026 edition). Past performance of seasonal patterns does not guarantee future results. This article is for informational purposes only and does not constitute investment advice.