S&P 500 Technology Sector SPDR (XLK) Has Rallied in 6 of 6 Midterm Sep-Apr Windows
S&P 500 Technology Sector SPDR is trading just below record territory as it approaches a 220-day midterm-year seasonal window that has never been negative in the past six cycles.

What is the seasonal pattern for S&P 500 Technology Sector SPDR (XLK)?
S&P 500 Technology Sector SPDR has risen in 6 of 6 midterm-year Sep 17–Apr 24 windows, with an average gain of 12.8% in winning years.
- 6 for 6 in this window, with XLK posting gains every midterm-year Sep 17–Apr 24 stretch since 2002 and averaging 12.8% in those winning years.
- Seasonal bias is bullish across a 220-day window that begins on Sep 17 and runs into late April of the following pre-election year.
- Percent Profitable stands at 100%, with 6 winners and 0 losers across the last six midterm election years in this pattern.
- Trade Direction is long, supported by a TradeWave Ratio of 1.61 and a Sharpe ratio of 2.56, indicating historically strong risk-adjusted returns.
- Individual years have seen net gains ranging from 7.77% to 17.86%, with some windows experiencing double-digit intraperiod drawdowns before finishing higher.
- Cumulatively, stacking this specific window across the six midterm cycles compounds to roughly 105% total return.
According to historical data from TradeWave.ai, this midterm-year stretch has behaved very differently from an average calendar period for XLK. The next section walks through how that pattern has played out and where the upcoming window fits into the current cycle.
How has S&P 500 Technology Sector SPDR (XLK) traded in the Sep 17–Apr 24 midterm-year window?
S&P 500 Technology Sector SPDR has finished higher in every single Sep 17–Apr 24 midterm-year window across the last six cycles, averaging a 12.8% gain. The next iteration of this 220-day stretch begins on Sep 17, with XLK changing hands around 185.69 and sitting about 6.3% below its 52-week high of 198.26.[1] That combination of a clean historical win streak and a pullback from peak levels gives this upcoming seasonal regime unusual weight for a sector ETF that anchors more than one-third of the S&P 500’s market cap.[2][5]
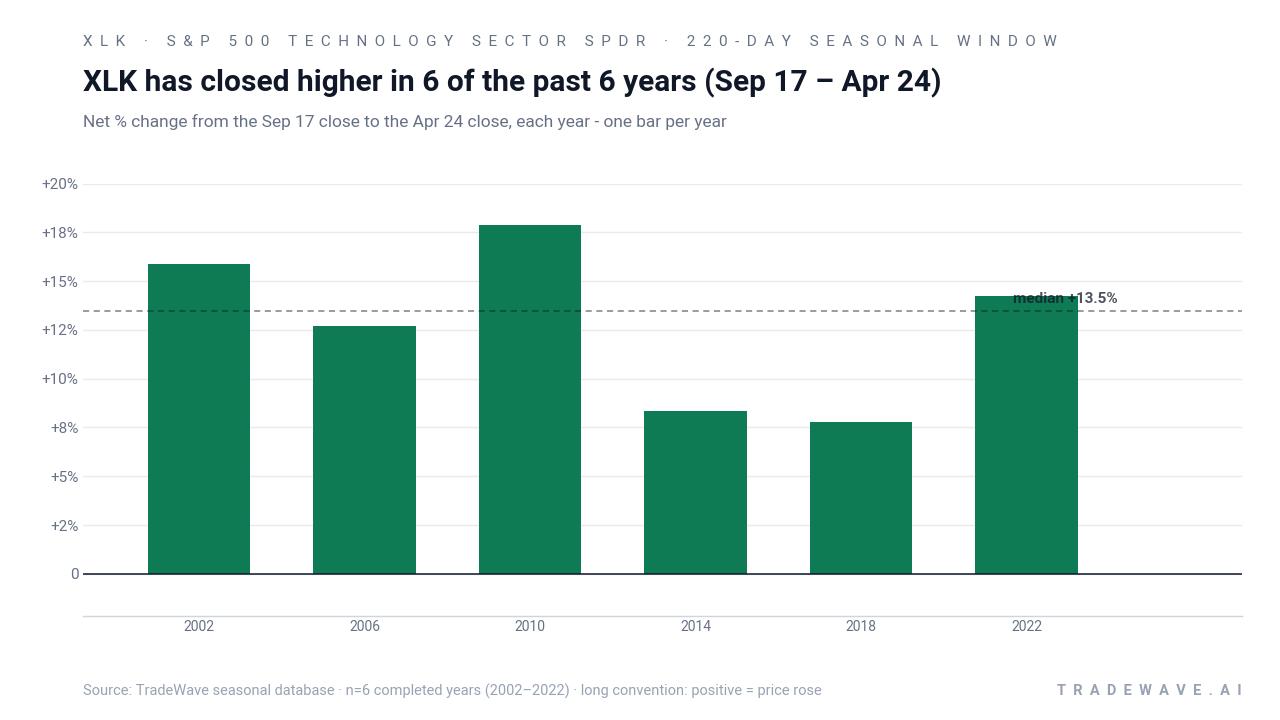
The presidential election cycle matters here because this pattern only looks at the last six midterm election years, then follows XLK from late September of that midterm into late April of the following pre-election year. That is the part of the political calendar when Washington often shifts from gridlock and policy uncertainty toward a more market-friendly tone, and when tech spending plans for the next year start to firm up in corporate budgets.
Across those six midterm cycles, XLK’s net gains in this window range from 7.77% in 2018 to 17.86% in 2010. The median profit of 13.48% sits close to the average, which suggests the wins have been relatively clustered rather than driven by a single outlier year. On an annualized basis, the pattern translates to a 12.73% return profile, which is in line with long-run equity returns but compressed into a specific 220-day slice.
The intraperiod path has not been a straight line. In 2018, XLK ultimately finished the window up 7.77%, but the worst drawdown from the Sep 17 entry point reached -21.6% before the ETF recovered into April. In 2002, the maximum adverse move was -15.55% even as the final gain landed at 15.87%. Other years, such as 2010, saw almost no downside from entry, with the worst drawdown effectively flat while the best run-up reached 20.67%.
Put together, the maximum favorable excursions have often stretched into the mid-teens or low 20s in percentage terms, while the worst drawdowns have ranged from negligible to more than -20%. That mix is what the TradeWave Ratio of 1.61 is capturing: XLK has typically traveled meaningfully in the trade direction within the window, even when the path included sharp pullbacks along the way.
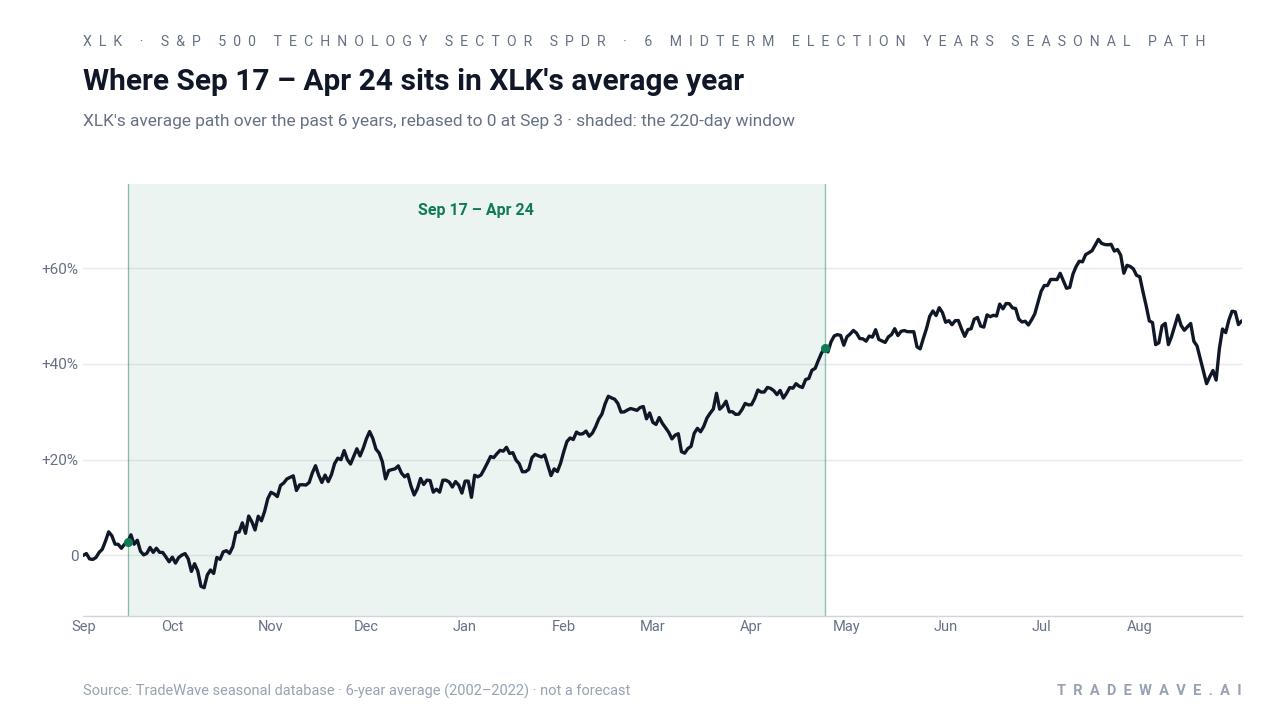
A second view shows how each year’s upside and downside swings have stacked up inside that window.
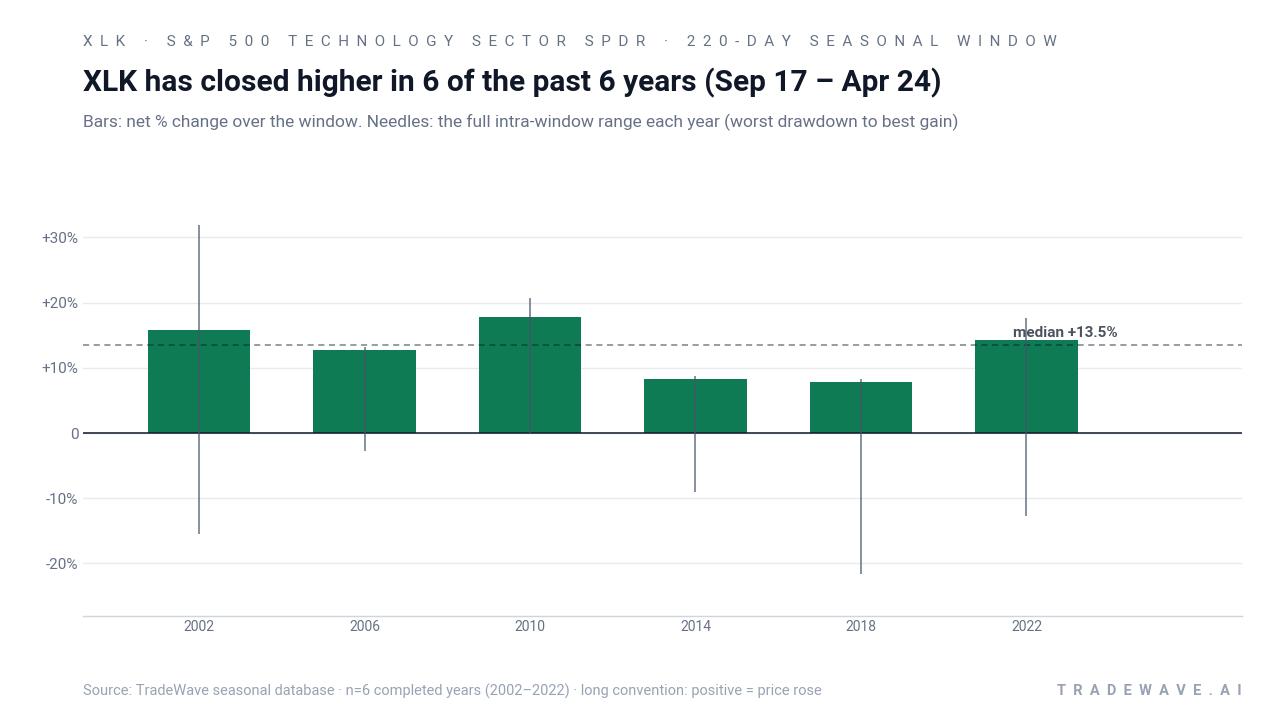
The bars-and-needles profile makes the trade-off clear. Every bar is positive, reflecting the 6-for-6 win record, but the needles extend well below zero in several years, showing that adverse excursions have sometimes been deep before the window finished higher. At the same time, the upper ends of the needles cluster in the mid-teens, which is consistent with the 105% cumulative gain from repeatedly holding this window across the six midterm cycles.
History does not guarantee future results; adverse excursions can be large even in winning windows, and past MAE and MFE ranges are not a promise of future volatility.
Why does S&P 500 Technology Sector SPDR (XLK) follow this seasonal pattern?
This midterm-to-pre-election window likely reflects a mix of earnings calendar clustering, sector rotation and policy timing. One likely driver is that large-cap tech companies often issue guidance and capital spending plans for the coming year in the fall, then update them through winter earnings season, which can support a sustained trend when expectations are rising. Analysts have also pointed to institutional portfolio repositioning around the midterm vote and into the pre-election year, when risk appetite for growth and AI-related themes tends to improve, giving XLK a tailwind that shows up in this specific seasonal slice.[2][6]
What is driving S&P 500 Technology Sector SPDR (XLK) today?
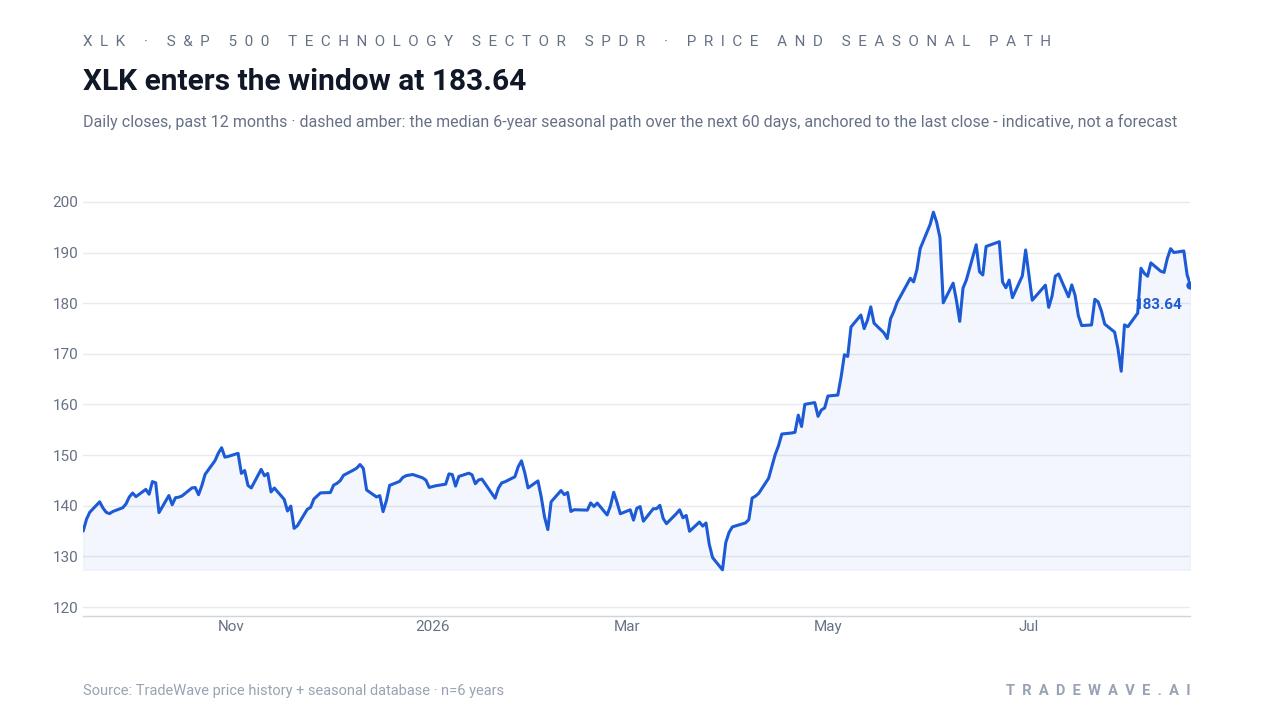
S&P 500 Technology Sector SPDR ended the prior session at 185.69, down 1.55% on the day and sitting about 6.3% below its 52-week high of 198.26, with the 50-day moving average near 182.49 and 20-day average volume around 6.1 million shares.[1][7] That pullback follows a powerful run that saw XLK notch a new 52-week high in May 2026 as AI-driven demand and robust earnings from mega-cap holdings like NVIDIA, Apple and Microsoft powered the sector higher.[2][4]
Since that peak, the ETF has shown more two-way trade. In July 2026, XLK suffered its worst 10-day stretch versus the S&P 500 since 2002, a sign that investors were rotating out of crowded tech winners or at least questioning how far the AI trade could stretch without a pause.[3] At the same time, breadth under the surface has been weaker than the headline index, with a large share of S&P 500 technology stocks trading at least 20% below their 52-week highs even as the ETF itself stayed near records.[5]
That concentration risk cuts both ways. XLK tracks the Technology Select Sector Index, and its top holdings are heavily skewed toward a handful of mega-caps, so swings in those names can dominate the ETF’s path.[1][2] In June 2026, commentary around the AI trade highlighted how tech’s weight of more than one-third of the S&P 500 has amplified volatility, with investors debating whether to lean into or away from that exposure as macro data and rate expectations evolve.[6]
The chart below situates the latest move against the past year of trading and the indicative 60-day seasonal projection.
What should traders watch as XLK approaches this seasonal window?
First, the calendar. The Sep 17 start date lands as the midterm election year is wrapping up and the pre-election year approaches, a phase that has historically been friendlier to risk assets and especially to large-cap tech. How XLK behaves into that date will shape how stretched or reset the ETF is when the historical pattern kicks in.
Second, levels. The 52-week high near 198 and the 50-day moving average around 182.5 are the key reference points. A break back toward the highs before Sep 17 would mean the window opens with XLK already extended, while a deeper consolidation toward the moving average or below would echo prior cycles where the ETF endured a drawdown early in the window before recovering.
Third, sector breadth and leadership. If more S&P 500 tech constituents continue to trade 20% or more below their highs while the ETF grinds higher, the seasonal tailwind could remain concentrated in a few mega-caps, which would keep volatility elevated.[5][6] A broadening of participation into semis, software and hardware would look more like the healthier midterm-to-pre-election ramps seen in earlier cycles.
Finally, macro and policy catalysts. Inflation prints, Fed communication and any shifts in regulatory rhetoric around AI and big tech will intersect directly with this window. Stronger-than-feared earnings updates from XLK’s top holdings or renewed AI capex commentary could reinforce the historical upside bias, while a hawkish turn in rates or a policy shock could be the kind of catalyst that has produced the deeper intraperiod drawdowns seen in years like 2018.[2][3][6]
Add it up: XLK is heading into a part of the election cycle that has delivered a clean 6-for-6 record for long exposure, but the path has often been bumpy. Traders watching this window will be focused on whether any autumn weakness sets up another recovery into spring, or whether a break in the AI and mega-cap leadership story finally forces this pattern to blink.
Sources
- Seeking Alpha - State Street Technology Select Sector SPDR ETF (XLK) Price, Quote ...
- Morningstar - XLK Stock Price – Technology Select Sector SPDR® ETF | Morningstar
- Seeking Alpha (news) - Tech stumbles: XLK suffers the worst 10-day stretch versus the S&P 500 since 2002
- Zacks - Technology ETF (XLK) Hits New 52-Week High - May 8, 2026
- Seeking Alpha (news) - Most S&P 500 tech stocks are 20% below their highs, while Micron and AMD lead XLK ratings
- Barchart - When the AI Trade Collapses, These 3 S&P 500 Sectors Are Your Best Bet
- MarketBeat - Technology Select Sector SPDR Fund ETF Price, Holdings, & News (NYSEARCA:XLK)
About this seasonal analysis
Seasonal pattern data is sourced from TradeWave.ai, which analyzes historical price behavior across annual calendar windows going back up to 30 years. Read the full data methodology or the book The 100-Year Pattern by Afshin Moshrefi (2026 edition). Past performance of seasonal patterns does not guarantee future results. This article is for informational purposes only and does not constitute investment advice.