Target Corporation (TGT) Rides Q2 Earnings Beat and Raised EPS Outlook Into a Strong August Run
Target Corporation shares are surging after a Q2 earnings beat and raised guidance, just as the stock approaches a late-August seasonal window that has quietly delivered gains in every midterm election year in the dataset.
Price as of Aug 19, 2026: $159.00 (last close).
What is the seasonal pattern for Target Corporation (TGT)?
Target Corporation has risen in 7 of 7 midterm-year late-August windows, with an average gain of 4.26% in winning years.
- 7 for 7 in this window, averaging 4.26% gains in winning years across the last 7 midterm election years.
- The 12-day Target Corporation trading window runs from Aug 30 to Sep 10 in midterm election years.
- Percent Profitable is 100%, with 7 winners and 0 losers over the historical sample.
- Average profit of 4.26% in winning years stacks to a 33% cumulative return when the window is repeated across cycles.
- The strongest year in the sample gained 8.13%, while even the softest year still finished positive at 2.23%.
- Intraperiod swings have included meaningful drawdowns in some years, so the path has not been a straight line even in a bullish seasonal trend.
According to historical data from TradeWave.ai, this late-August stretch for Target has behaved differently in midterm election years than in other parts of the calendar. The next section looks at how that pattern has played out and where it sits in the current election cycle.
How has Target Corporation (TGT) traded in the late-August midterm-year window?
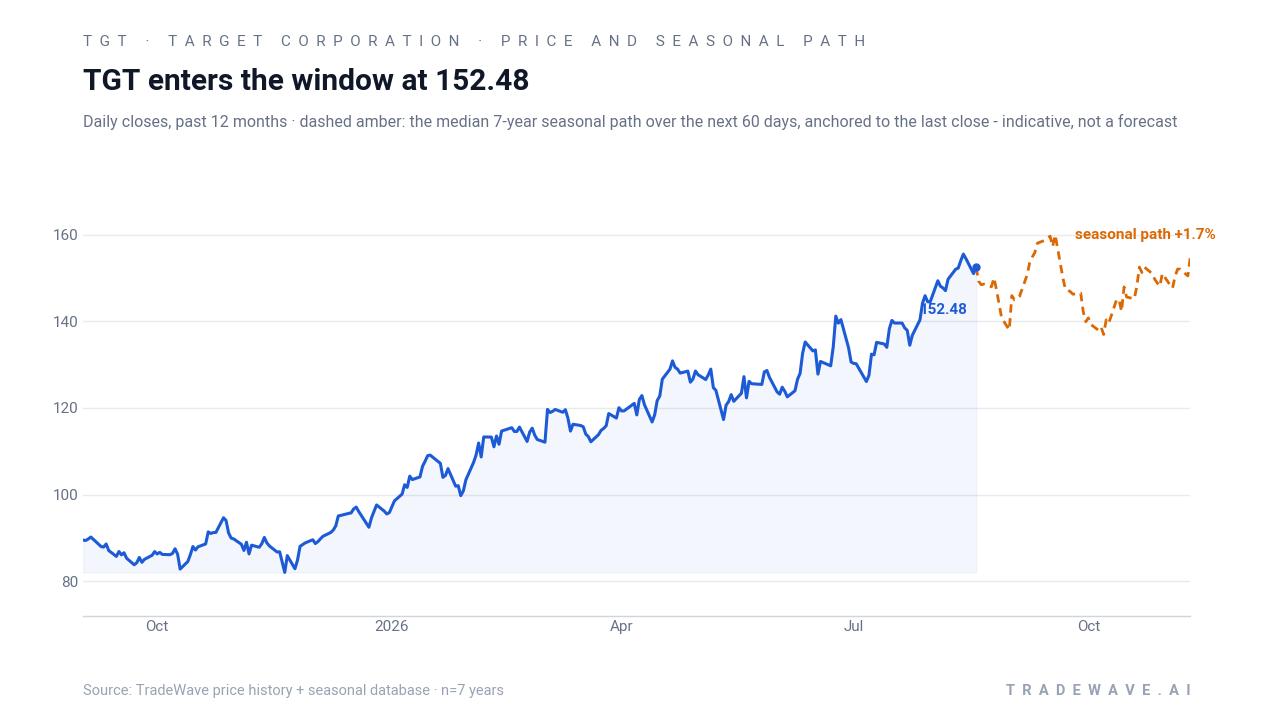
Target Corporation has risen in 7 of 7 midterm election years during the Aug 30 to Sep 10 window, averaging 4.26% gains for a long position. Shares finished the prior session at 159.00, up 4.3% on the day and about 1.6% above their 52-week high of 156.46, putting the stock into breakout territory just ahead of this historically strong slice of the calendar.
The pattern groups the last 7 midterm election years rather than consecutive calendar years, which matters because retail spending, policy uncertainty and rate expectations often rhyme across the same point in the presidential cycle. In midterm years, investors are typically digesting two years of policy moves and positioning for the pre-election year, a phase that has often been friendlier for risk assets.
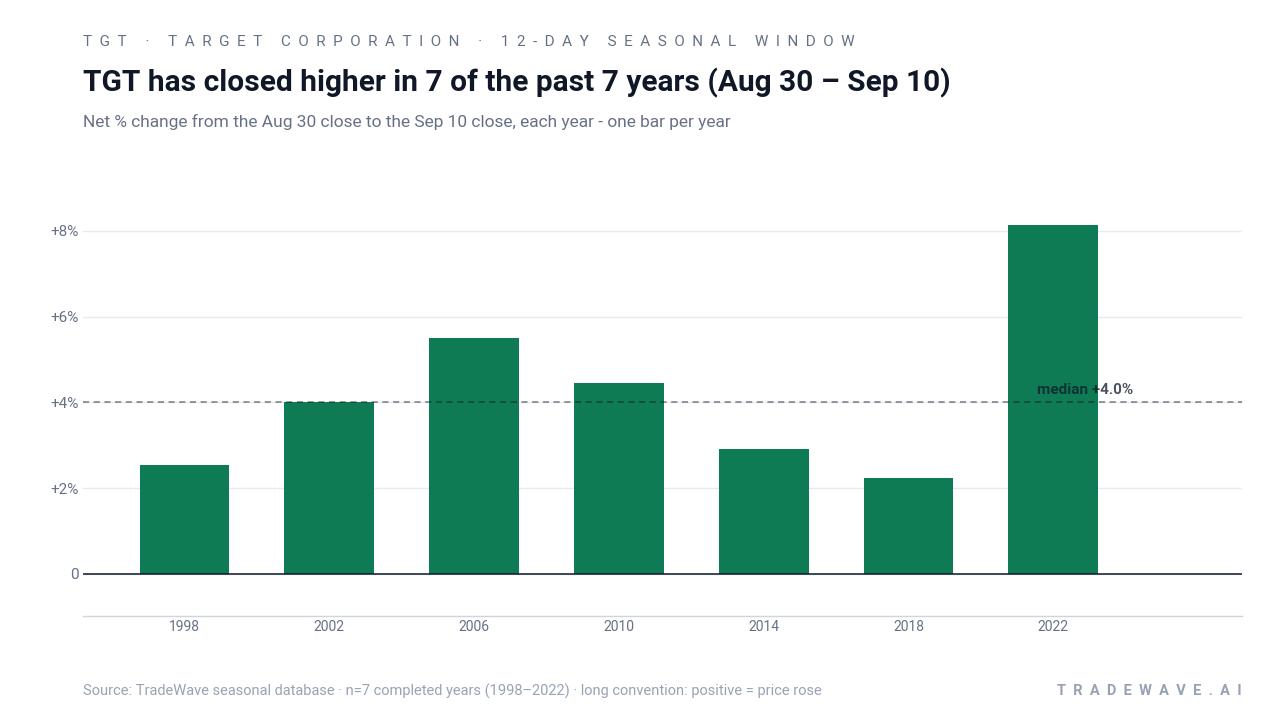
Across the seven midterm-year samples, the strongest late-summer run came in 2022, when the stock gained 8.13% from entry to exit in this 12-day window. The softest outcome was still a 2.23% gain in 2018, underscoring how consistently the TGT seasonal trend has leaned bullish in this specific stretch.
Average profit of 4.26% sits close to the median outcome of 4.01%, which suggests the distribution of returns has not been dominated by a single outlier year. The cumulative return chart for this Target Corporation trading window climbs to roughly 33% across the seven midterm election years, showing that repeating the same 12-day slice has historically compounded meaningfully.
A second view shows how far price has typically swung both in favor of and against the trade inside the window.
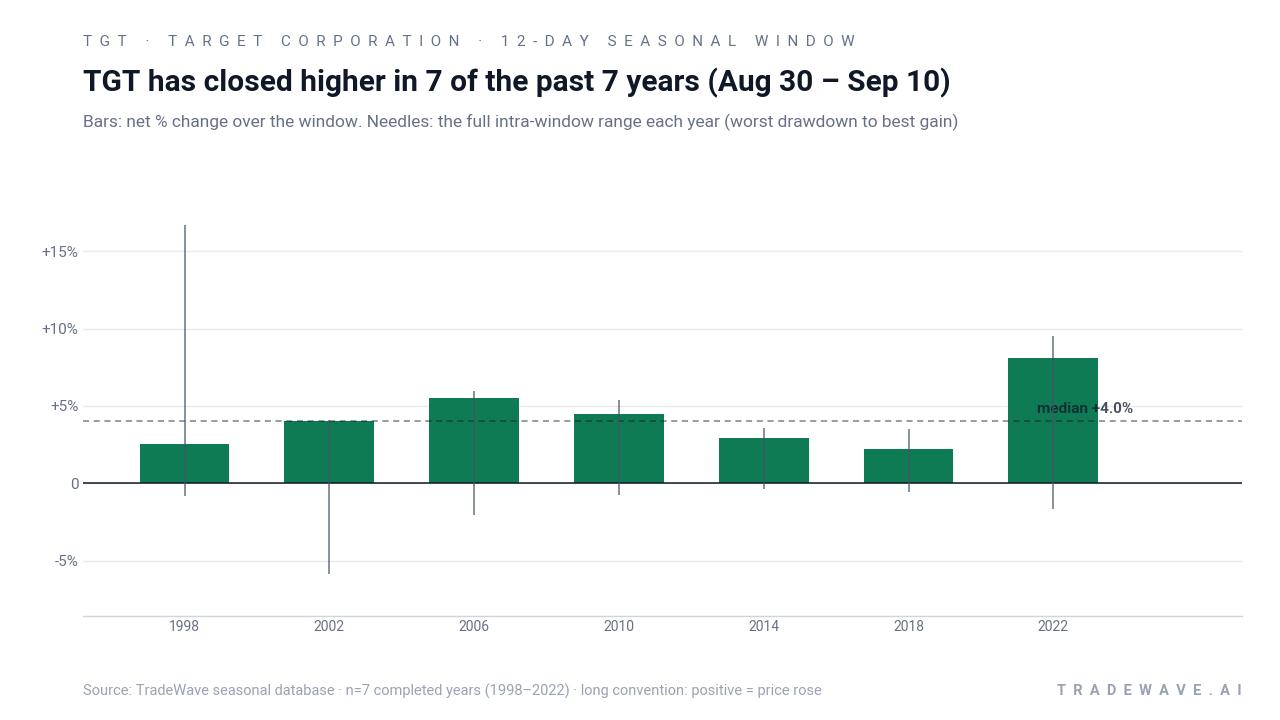
Intraperiod ranges have been wide enough to matter. In 1998, for example, the best point-to-peak move within the window reached 16.67%, while the worst drawdown from entry was a relatively modest 0.85% decline. In 2002, the maximum favorable move was 4.09%, but the worst drawdown reached 5.85%, showing that even a year that finished up 4.01% involved a meaningful dip along the way.
The maximum favorable excursion and maximum adverse excursion profile across years lines up with the TradeWave Ratio of 1.44, which signals that price has typically traveled a fair distance in the trade direction during the window. For a long pattern, that means rallies have tended to be more pronounced than pullbacks, but the 2002-style drawdown reminds traders that the path can be choppy even when the close-to-close result is positive.
Put together, the pattern is clear: this has been a bullish late-summer window for Target in midterm election years, with every sample year finishing higher and several delivering mid-single-digit gains in less than two weeks. History does not guarantee a repeat, but seven for seven is a record that stands out on the retail calendar.
Why does Target Corporation (TGT) follow this seasonal pattern?
One likely driver is the back-to-school spending cycle, which tends to peak in late August and early September and is a core category for Target’s stores. Analysts have also pointed to portfolio repositioning in the midterm election year as investors rotate into or out of consumer names ahead of the typically stronger pre-election year. The combination of seasonal consumer demand and election-cycle positioning may help explain why this specific 12-day window has leaned consistently positive for TGT.
History does not guarantee future results; adverse excursions within the window can be large even when the final outcome has been positive in prior years.
What is driving Target Corporation (TGT) today?
Target Corporation closed Thursday at 159.00, up 4.3% on the session after a strong Q2 2026 earnings report and raised full-year guidance, leaving the stock about 1.6% above its 52-week high of 156.46 and extending a roughly 10.1% gain over the past month. Management reported net sales of $26.5 billion, up about 5% year over year, with diluted EPS of $4.11 roughly doubling from a year earlier as tariff refunds and better traffic and digital trends lifted margins and profits.[1][3][4][5][6]
The company increased its full-year outlook, projecting around 5% net sales growth for fiscal 2026 and raising EPS guidance to a range of $9.90 to $10.90, while also nudging up the midpoint of its profit forecast excluding tariff benefits.[1][3] Coverage highlighted that tariff refunds delivered nearly $1 billion of margin tailwind in Q2, but also noted that underlying gross margin improved as merchandising resets, price investments and assortment refreshes in categories like beauty and grocery helped drive traffic.[1][4][5][6]
In the retail and consumer staples sector, Target’s moves come as big-box peers lean into value messaging and private-label offerings to keep budget-conscious shoppers engaged. Yahoo Finance and other outlets reported that Target’s back-to-school performance has been solid, with management pointing to stronger store traffic and digital growth as evidence that its turnaround efforts are gaining traction.[1][4][5][6] Earlier in August, Barchart flagged that analyst upgrades and price target changes had already helped push the stock higher, setting the stage for this week’s breakout.[7]
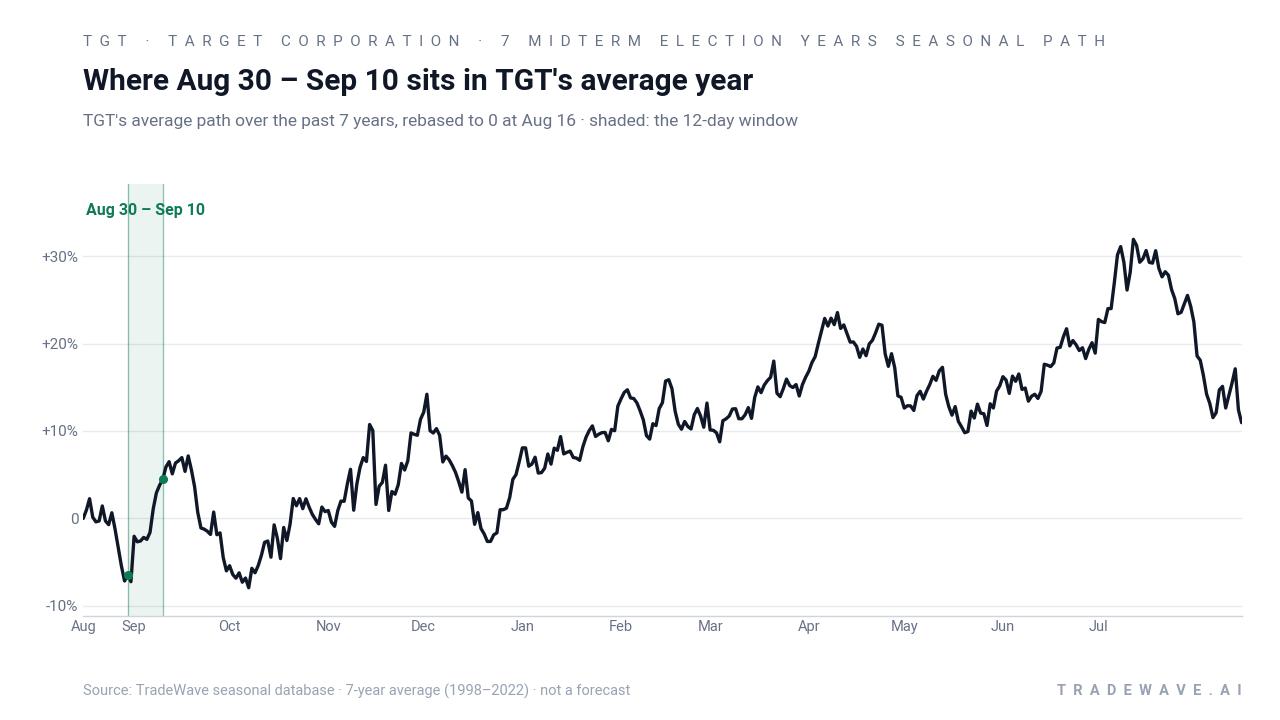
The chart below situates the latest move in its recent multi-month context alongside the historical seasonal projection.
What should traders watch as this Target Corporation (TGT) window approaches?
The next iteration of the Aug 30 to Sep 10 window opens in ten days, with TGT already trading above its prior 52-week high and sentiment buoyed by a clean earnings beat. Traders watching this historical seasonality will focus on whether the stock can hold above the breakout zone around 156 to 160 as the window begins, and whether intraday pullbacks resemble the relatively shallow drawdowns seen in most prior midterm-year samples.
On the fundamental side, any follow-up commentary from management on back-to-school trends, inventory levels and pricing strategy will matter, especially given how much of Q2’s margin strength came from one-off tariff refunds.[1][4][5][6] If traffic and digital growth stay firm into September, that would align with the historical pattern of late-summer strength; a sudden slowdown in discretionary categories would cut against it.
From a pattern-confirmation standpoint, behavior inside the window will be key. A steady grind higher with contained drawdowns would echo the typical historical path, while a sharp break back below the recent breakout zone would mark a clear departure from the TGT seasonal trend. Add it up: a stock in motion, a clean earnings story and a seven-for-seven midterm-year window converging into the same late-August trade calendar.
Sources
- Target Corporation (press release) - Target Corporation Reports Second Quarter Earnings
- Target Corporation (press release) - Target Corporation Reports First Quarter Earnings
- Seeking Alpha - Target projects around 5% FY2026 net sales growth as EPS guidance moves to $9.90-$10.90
- Yahoo Finance - Target delivers earnings beat, CEO 'encouraged' by turnaround traction
- Yahoo Finance (video) - Target earnings: Tariff refunds, back-to-school success drive stock
- Investing.com via Yahoo - Premarket movers: Moderna jumps after Phase 3 trial; Target slides
- Barchart - Why Target (TGT) Stock Is Trading Up Today
About this seasonal analysis
Seasonal pattern data is sourced from TradeWave.ai, which analyzes historical price behavior across annual calendar windows going back up to 30 years. Read the full data methodology or the book The 100-Year Pattern by Afshin Moshrefi (2026 edition). Past performance of seasonal patterns does not guarantee future results. This article is for informational purposes only and does not constitute investment advice.