10-for-10 Midterm Run: Analog Devices (ADI) Averages 35% Gains in This 261-Day Window
Analog Devices just stepped into a historically powerful 261-day seasonal window even as the stock trades well below its 52-week high after record results and strong guidance.
Price as of Aug 20, 2026: $370.24 (last close).

What is the seasonal pattern for Analog Devices (ADI)?
Analog Devices has risen in 10 of 10 midterm-election-year windows starting Aug 18, with an average gain of 35.23% in winning years.
- 10 for 10 in this window, with Analog Devices averaging 35.23% gains across all winning years.
- Seasonal window runs from Aug 18 through May 5, spanning 261 calendar days in midterm election years.
- Percent Profitable is 100%, with 10 winners and 0 losers across the last 10 midterm-election-year samples.
- Median profit of 36.13% and annualized return of 34.31% highlight a historically strong bullish bias.
- TradeWave Ratio of 1.82 suggests price has typically traveled meaningfully in the long direction within the window.
- Sharpe ratio of 1.94 indicates attractive risk-adjusted returns for this Analog Devices trading window in prior cycles.
According to historical data from TradeWave.ai, this stretch of the calendar has behaved very differently for Analog Devices in past midterm election years. The next section looks at how that election-cycle seasonality lines up with today’s setup.
How strong is this midterm-year seasonal window for Analog Devices (ADI)?
Analog Devices has posted gains in every one of the last 10 midterm-election-year windows starting Aug 18, averaging 35.23% per cycle over the 261-day stretch. Shares finished Thursday at $370.24, down 0.8% on the day and about 16.9% below the 52-week high of $445.91, even after a 60.1% surge year to date.
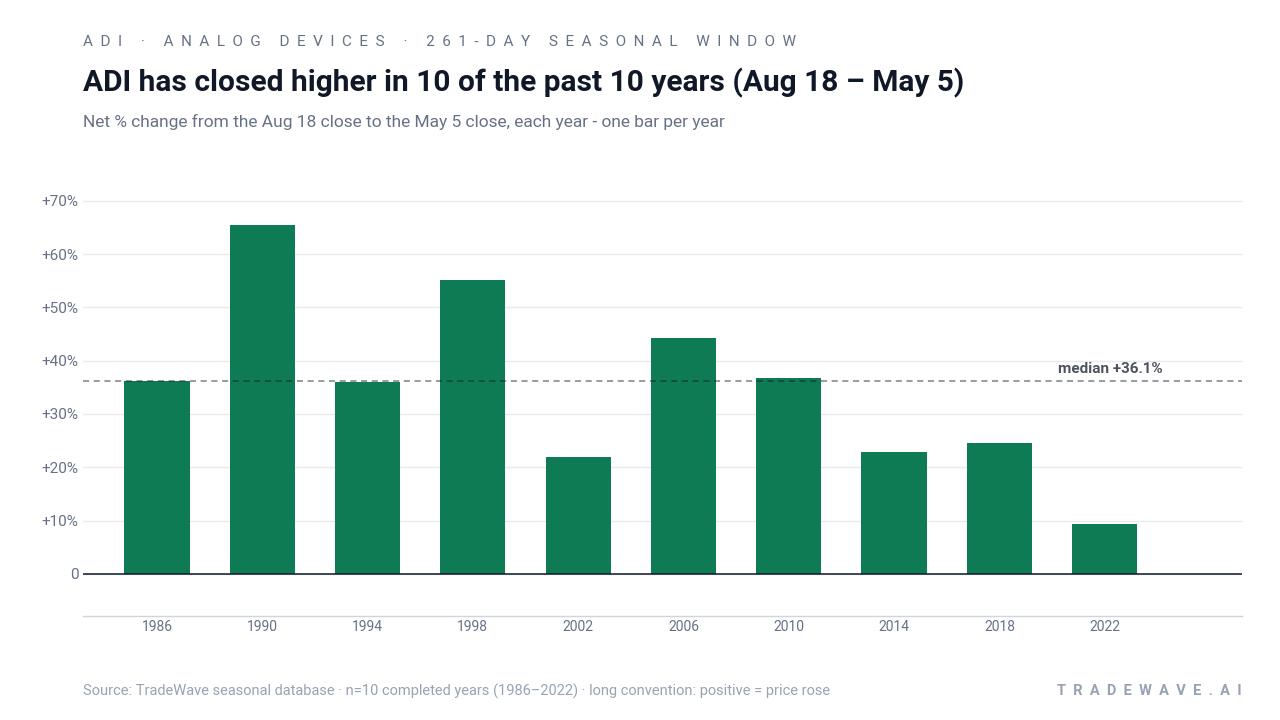
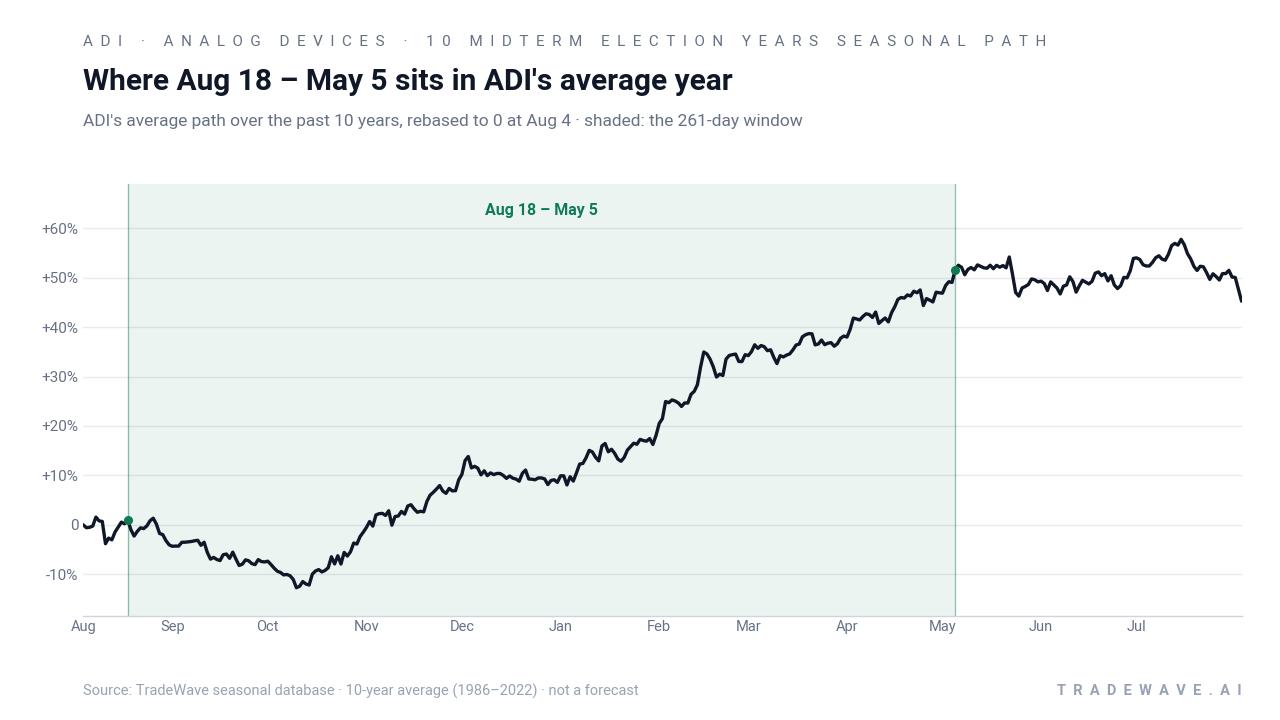
The presidential election cycle matters here because this pattern only looks at the last 10 midterm election years, a phase that often brings policy uncertainty early in the year and a more supportive backdrop as the calendar rolls toward the pre-election year. Grouping Analog Devices’ historical seasonality this way isolates how the stock has behaved when Washington is in the same part of the political and fiscal cycle as today.
This seasonal window is already underway, running from Aug 18 through May 5, and has historically been a very strong stretch for long positions in Analog Devices. The trade direction is explicitly long, and across the last 10 midterm-election-year samples the Percent Profitable is 100%, with 10 winners and 0 losers. Average profit of 35.23% means that, in prior cycles, a long held from the Aug 18 close to the May 5 close has delivered mid-double-digit gains on average.
Looking at individual years, the strongest midterm-year run came in 1990, when Analog Devices gained 65.39% over the window, while the softest outcome was 9.3% in 2022. In other words, even the weakest midterm-year iteration in this sample still finished positive for a long trade. Add it up: stacking those 10 windows compounds to a cumulative return of 1,810% across the sample.
A second view shows how far Analog Devices has typically swung up and down inside each of those winning windows.
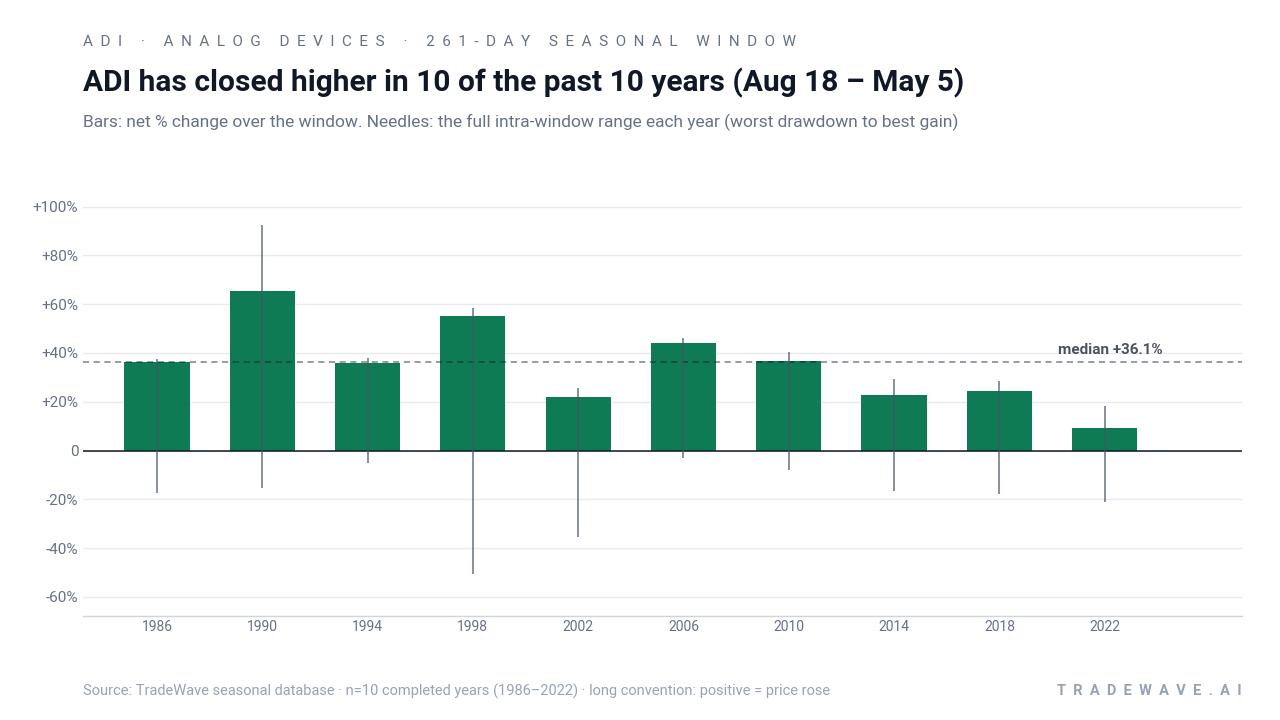
The maximum favorable move and maximum adverse move profile is a reminder that this has been a high-energy window, not a straight line. In 1998, for example, the stock’s best intraperiod run-up reached 58.25%, but the worst drawdown from entry was a deep 50.52% before the trade finished up 55.15%. In 2002, the best point-to-peak gain was 25.5% while the worst pullback was 35.43%, again ending with a 21.92% net gain by May 5.
Across the sample, the TradeWave Ratio of 1.82 indicates that price has typically traveled significantly in the long direction within the window, even beyond the final close-to-close result. The Sharpe ratio of 1.94, based on end-of-window outcomes, points to a favorable risk-adjusted profile for this Analog Devices seasonal trend, though the MAE spikes in years like 1998 and 2002 show that those gains have often come with sharp interim volatility.
The cumulative return chart for this Analog Devices trading window climbs steadily, with no major flat spots or reversals across the 10 midterm-election-year samples. That steady compounding suggests the pattern has not been driven by a single outlier year but by repeated positive outcomes. The pattern is clear: this window has favored longs in 10 of 10 years, with average gains north of 35%.
History does not guarantee future results; adverse excursions (the worst drawdowns within the window) can be large even in winning years.
Why does Analog Devices (ADI) follow this seasonal pattern?
One likely driver is the way Analog Devices’ earnings calendar and capital spending cycles line up with the midterm-to-pre-election phase, when corporate and government technology budgets often loosen. Analysts have also pointed to sector rotation into semiconductors during periods when policy uncertainty fades and growth visibility improves, which tends to happen as the pre-election year approaches.[3] This pattern may reflect institutional portfolio repositioning into high-quality chip names like Analog Devices as investors lean into AI and industrial automation themes ahead of the next presidential election year.[2]
What is driving Analog Devices (ADI) today?
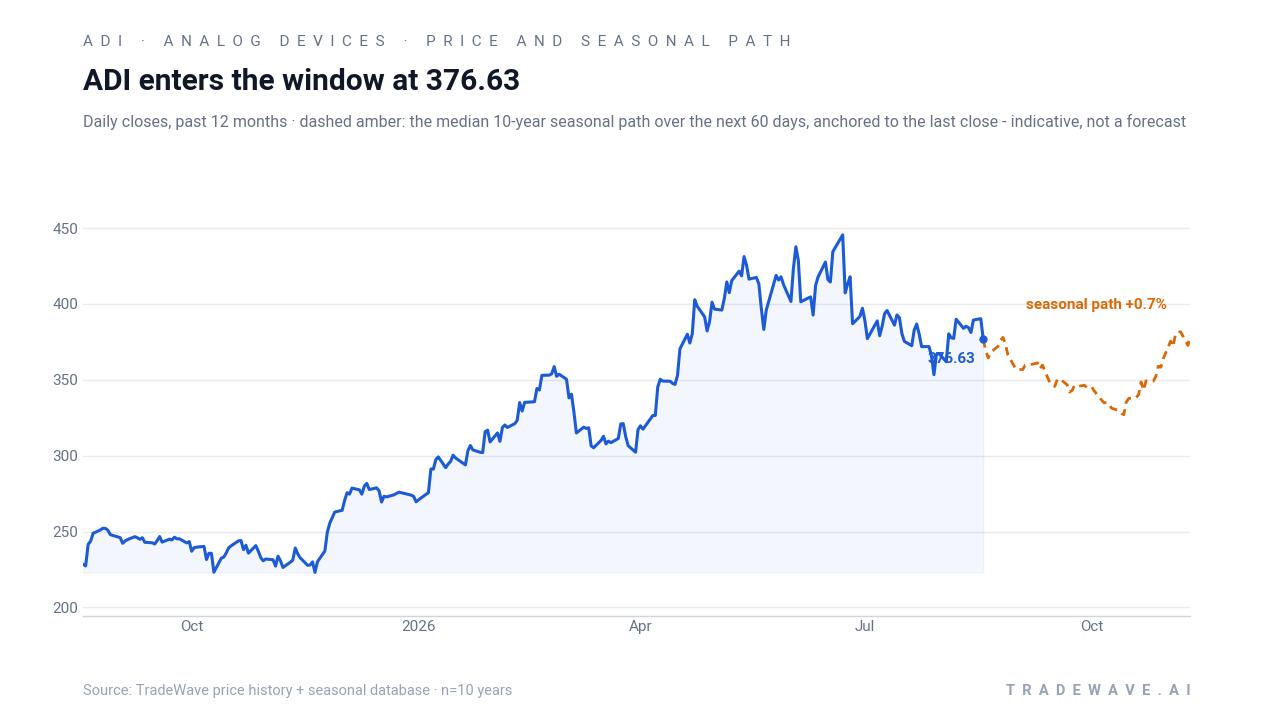
Analog Devices closed Thursday at $370.24, down 0.8% on the session, leaving the stock about 16.9% below its 52-week high of $445.91 but still up 60.1% year to date. The pullback comes just days after the company reported record fiscal third-quarter 2026 revenue of $4.022 billion, up 40% from a year earlier, with strong margin expansion and $1.7 billion returned to shareholders in the quarter.[5]
For the quarter ending Oct 31, 2026, management projected revenue of roughly $4.3 billion, plus or minus $100 million, alongside adjusted EPS guidance of $3.86 and GAAP EPS of $3.14, signaling confidence that demand from edge AI and industrial end markets can sustain elevated profitability.[5] Zacks’ July commentary noted that consensus expectations were already calling for quarterly EPS around $3.34 and revenue near $3.93 billion, as well as full-year EPS of $12.43 and revenue of $14.58 billion, underscoring how quickly estimates have been moving higher.[3]
Sector context remains supportive. Barchart’s coverage earlier this year highlighted how Analog Devices has outpaced both the S&P 500 and the technology sector over the past 12 months, helped by a broader semiconductor rebound tied to AI infrastructure and industrial automation demand.[4] That backdrop has fed into a “Moderate Buy” analyst consensus and a cited blended price target around $441 from MarketBeat and Barchart aggregates, reflecting constructive but not euphoric expectations for the stock.[1][2]
The chart below situates the latest pullback against the past year’s rally and the median seasonal path over the next two months.
In July, Zacks flagged Analog Devices after a session where the stock fell more than the broader market, noting that the name had already logged strong gains and was trading against elevated expectations.[3] Earlier in 2026, separate Yahoo Finance pieces highlighted insider selling totaling roughly $21 million in January and $16 million in May, with no offsetting insider purchases over the prior year, a pattern some investors read as management taking profits after a big run rather than a signal on fundamentals.[6][7]
Those cross-currents leave Analog Devices in an interesting spot as the midterm-year seasonal window gets going. The company is printing record revenue and guiding confidently, the stock has already delivered a powerful YTD rally, and yet it trades well below its 52-week high with some insider selling in the rear-view mirror. Against that backdrop, the historical seasonality from Aug 18 to May 5 becomes one more lens for traders to watch rather than a standalone call.
What should traders watch in this Analog Devices (ADI) seasonal window?
First, the earnings calendar. The guided Oct 31 quarter will be the next big test of whether edge AI and industrial demand can keep revenue near the projected $4.3 billion mark and support the high-teens to low-20s earnings growth profile that consensus has been building in.[3][5] Delivery in line with or ahead of that bar would be consistent with the historically strong midterm-year seasonal pattern, while a miss or cautious tone could be the kind of shock that has produced the large intraperiod drawdowns seen in past windows.
Second, price levels. On the upside, traders will be watching how the stock behaves if it pushes back toward the 50-day moving average around $389.69 and then the 52-week high near $445.91. A sustained move through those zones during the window would echo prior cycles where Analog Devices spent much of the Aug-to-May stretch grinding higher. On the downside, any slide that revisits the low $300s or undercuts recent swing lows would start to look more like the years where MAE spiked before the stock ultimately recovered by May.
Third, insider and positioning signals. While the January and May insider sales are several months old, traders will be alert for any fresh Form 4 activity that either extends that pattern or shows executives stepping back in on the buy side.[6][7] A shift toward net insider buying during a historically strong seasonal window would likely be read as a vote of confidence, while another wave of selling into strength could reinforce the idea that management sees the risk/reward as more balanced after the recent run.
Finally, the broader policy and macro calendar. Midterm election years often feature noisy debates over spending, regulation and industrial policy, all of which matter for a chipmaker tied to defense, industrial and communications end markets. As the calendar transitions toward the pre-election year, investors will be watching whether Washington’s tone on AI, semiconductor subsidies and export controls turns more market-friendly, which in prior cycles has lined up with stronger risk appetite for names like Analog Devices.[2][4] If the stock can navigate those catalysts while respecting its historical Aug 18 – May 5 seasonal trend, this window will stay on traders’ radar as one of the more reliable patterns in the semiconductor space.
Sources
- MarketBeat - Analog Devices Provides Much-Needed Pullback: How Low Can It Go?
- Barchart - Why Analysts Think Analog Devices Stock Can Hit $375 in 2026
- Zacks - Analog Devices (ADI) Declines More Than Market: Some Information for Investors
- Barchart - Analog Devices Stock: Analyst Estimates & Ratings
- Analog Devices Investor Relations (PR Newswire) - Analog Devices Reports Record Fiscal Third Quarter 2026
- Yahoo Finance - Analog Devices Insiders Sell US$21m Of Stock, Possibly Signalling Caution
- Yahoo Finance - Analog Devices Insiders Sold US$16m Of Shares Suggesting Hesitancy
About this seasonal analysis
Seasonal pattern data is sourced from TradeWave.ai, which analyzes historical price behavior across annual calendar windows going back up to 30 years. Read the full data methodology or the book The 100-Year Pattern by Afshin Moshrefi (2026 edition). Past performance of seasonal patterns does not guarantee future results. This article is for informational purposes only and does not constitute investment advice.