6-for-6 Midterm Run: S&P 500 Technology Sector SPDR (XLK) Averages 16.94% Gains Oct-Apr
S&P 500 Technology Sector SPDR is edging higher into late 2026 just as a historically powerful midterm-year seasonal window approaches, setting up a clash between rich valuations and a strong tech seasonal trend.

What is the seasonal pattern for S&P 500 Technology Sector SPDR (XLK)?
S&P 500 Technology Sector SPDR has risen in 6 of 6 midterm-year Oct 11–Apr 24 windows, with an average gain of 16.94% in winning years.
- 6 for 6 in this window, averaging 16.94% gains in winning years across the last 6 midterm election cycles.
- Percent Profitable is 100%, with 6 winners and 0 losers for this 196-day Oct 11–Apr 24 trading window.
- Trade Direction is long, with a TradeWave Ratio of 1.81 and a Sharpe ratio of 2.49 across the sample.
- Stacking the window across cycles compounds to a 154% cumulative return, or 16.82% annualized.
- Individual years have seen strong maximum favorable moves, but some windows still carried double-digit intraperiod drawdowns.
- The pattern is specific to the midterm election year phase, just before markets transition into the historically strong pre-election year.
According to historical data from TradeWave.ai, this midterm-year stretch for XLK has behaved very differently from an average six-month span, and the next iteration is about to open.
How has S&P 500 Technology Sector SPDR (XLK) traded in the Oct–Apr midterm window?
Across the last six midterm election years, S&P 500 Technology Sector SPDR has never posted a loss in the Oct 11 to Apr 24 window, averaging 16.94% gains for long positions. XLK last closed at 187.67, up 1.32% on the day and sitting about 5.3% below its 52-week high of 198.26. That combination of a strong historical seasonal tailwind and a market trading just off its highs is the backdrop as tech heads toward another late-year stretch that has repeatedly rewarded long exposure.
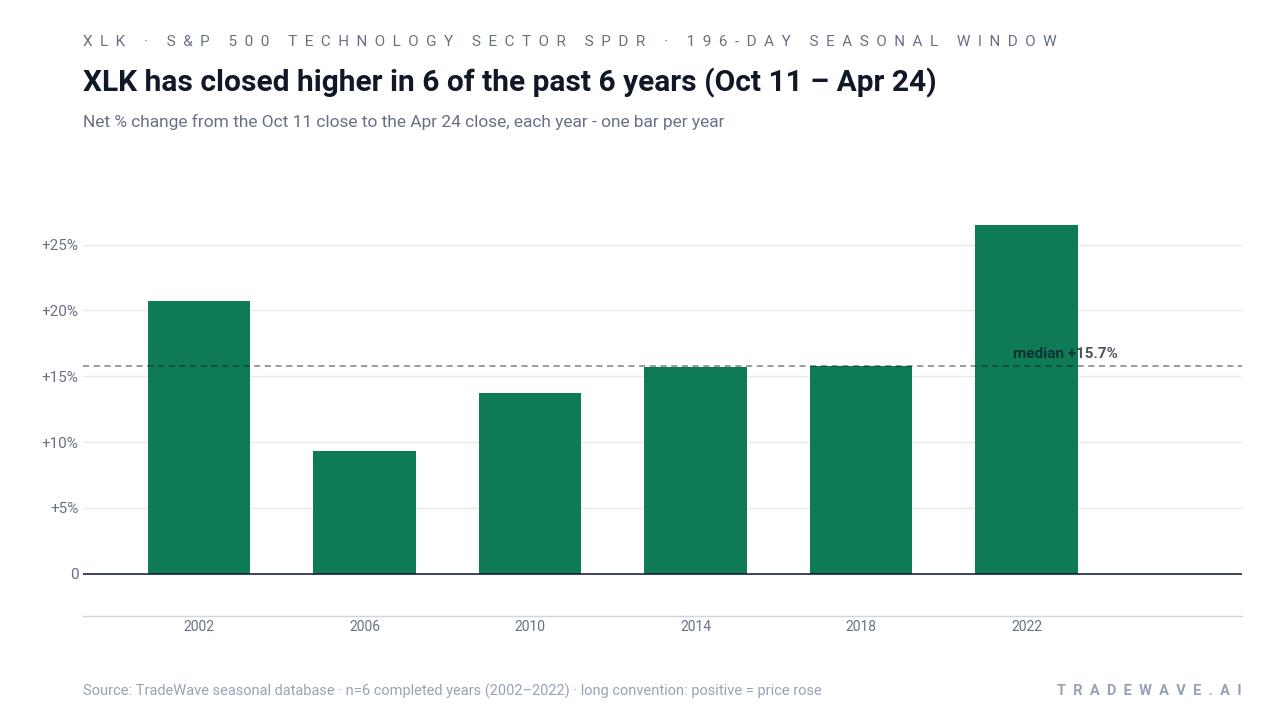
The pattern is built on the last 6 midterm election years, a phase where policy uncertainty tends to peak before easing into the pre-election year. Grouping by the presidential cycle matters here because tech leadership often tracks expectations for regulation, fiscal support and AI-related investment, which tend to follow election calendars more than simple calendar years.
Trade Direction for this setup is long, so positive returns are favorable years for the pattern. Percent Profitable is 100%, with 6 winners and 0 losers, which is rare for a 196-day stretch in a sector ETF. Average profit of 16.94% reflects the mean gain across those six completed windows, while the median outcome of 15.74% shows that results have clustered in the mid-teens rather than being driven by a single outlier.
The per-year record shows how that plays out in practice. The weakest midterm-year window in this sample was 2006, when XLK still gained 9.3% from Oct 11 to Apr 24. The strongest was 2022, with a 26.46% net return over the same dates, helped by a powerful rebound in large-cap tech after a rough first half of that year.
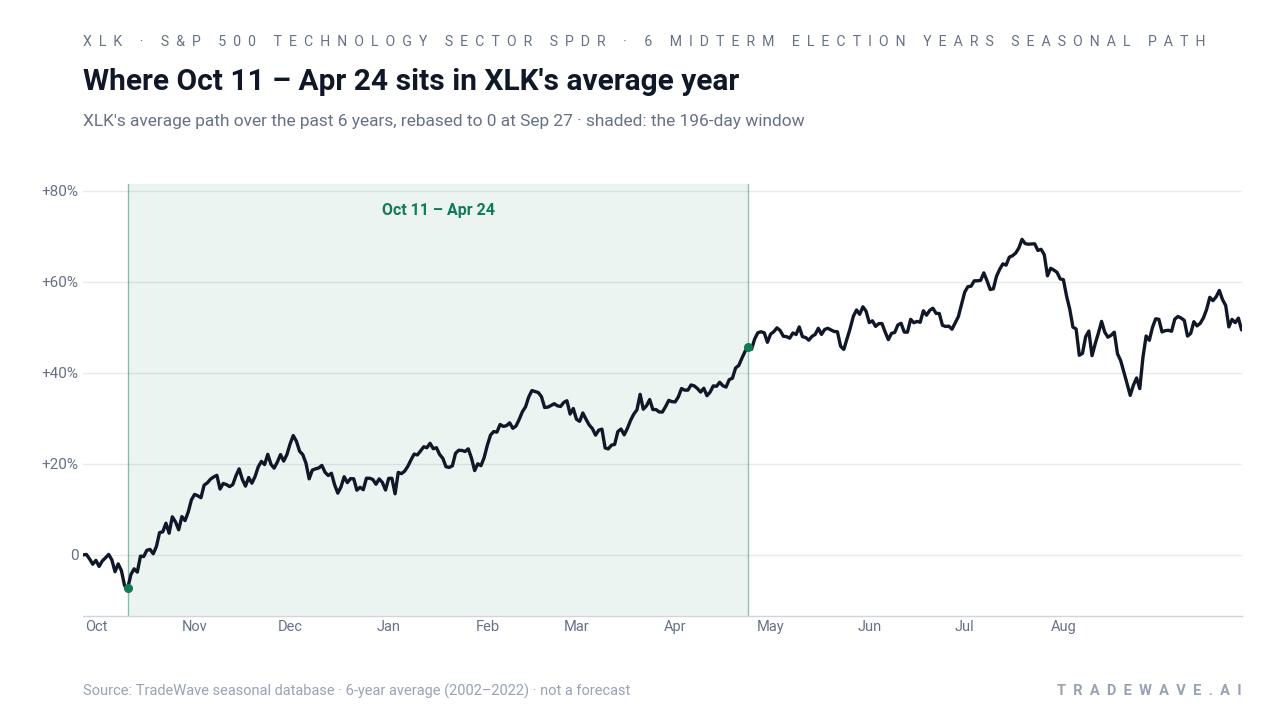
The historical seasonal average shows XLK typically grinding higher through much of this window, with gains building steadily rather than spiking in a single month. That fits the idea of a long seasonal regime rather than a short event trade, and it overlaps the broader midterm-to-pre-election pattern that has often been supportive for the S&P 500 as policy uncertainty fades.
Year-by-year ranges show how much XLK has swung inside the window before finishing higher.
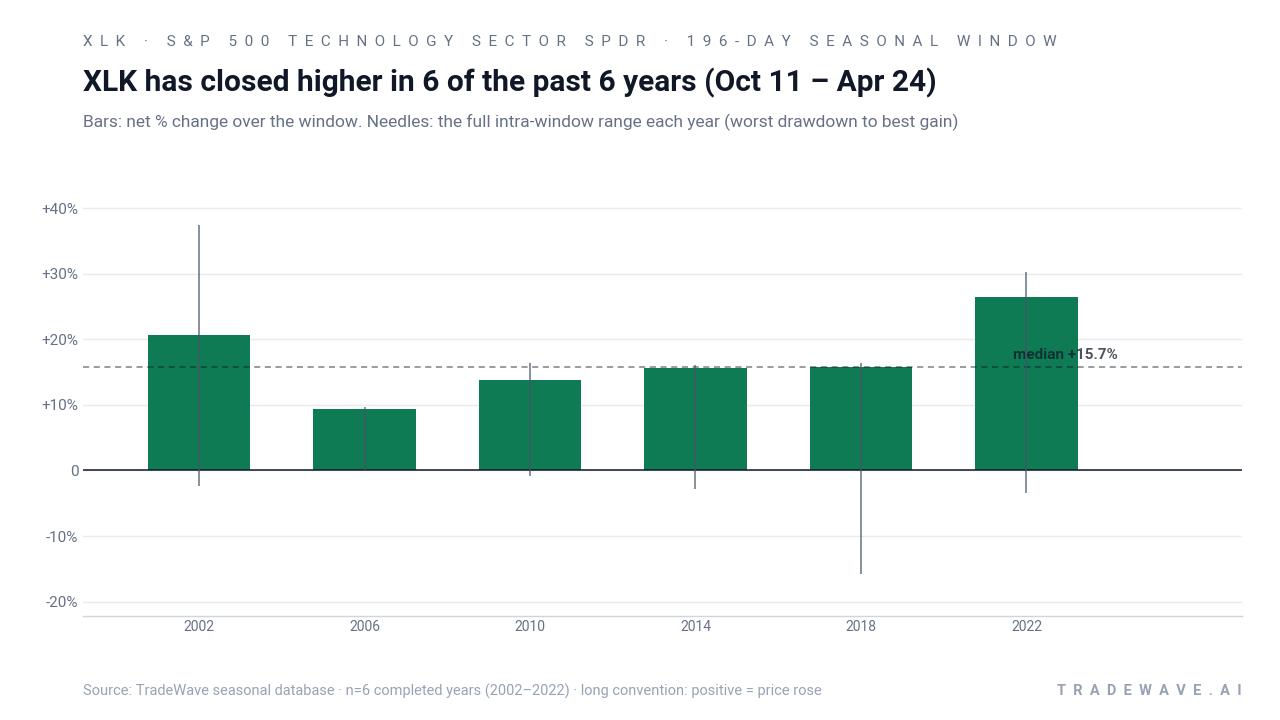
The combined net / maximum favorable move / maximum adverse move profile shows why this window has mattered for traders. In 2018, for example, XLK finished the window up 15.81% but endured a worst intraperiod drawdown of about 15.75% from entry, illustrating that even winning years can involve sharp air pockets. By contrast, 2006 saw a modest 9.3% gain with almost no adverse move, while 2022 combined a 26.46% net gain with a maximum favorable excursion above 30%, underscoring how strong years can run.
History does not guarantee future results; adverse excursions can be large even in winning windows, and traders can still be wrong-footed inside a historically strong pattern.
Why does S&P 500 Technology Sector SPDR (XLK) follow this seasonal pattern?
One likely driver is the way tech earnings, product launches and capital spending plans cluster around year-end and the first quarter, which often pulls forward demand for sector exposure. Analysts have also pointed to institutional portfolio rebalancing and sector rotation as funds shift into growth and AI themes once midterm-year policy risk starts to clear. The result is a window where flows, earnings news and macro expectations have repeatedly lined up in favor of large-cap technology, even if the path has been volatile.
What is driving S&P 500 Technology Sector SPDR (XLK) today?
XLK’s latest close at 187.67 leaves it modestly below its 52-week high of 198.26, after a 1.32% gain that keeps the ETF in a firm uptrend into the final stretch of the midterm election year. Fresh valuation work from GuruFocus flags XLK as roughly 32.5% overvalued on its GF Value framework, highlighting how far the sector has run relative to fundamentals even as traders focus on nearby pivot levels for potential breakouts or reversals.[2] A separate GuruFocus piece earlier in September also emphasized rich valuation and strong profitability metrics, reinforcing the idea that tech leadership is intact but priced for a lot to go right.[3]
The chart below shows how that move fits into XLK’s past year of trading, along with a historical seasonal projection for the next two months.
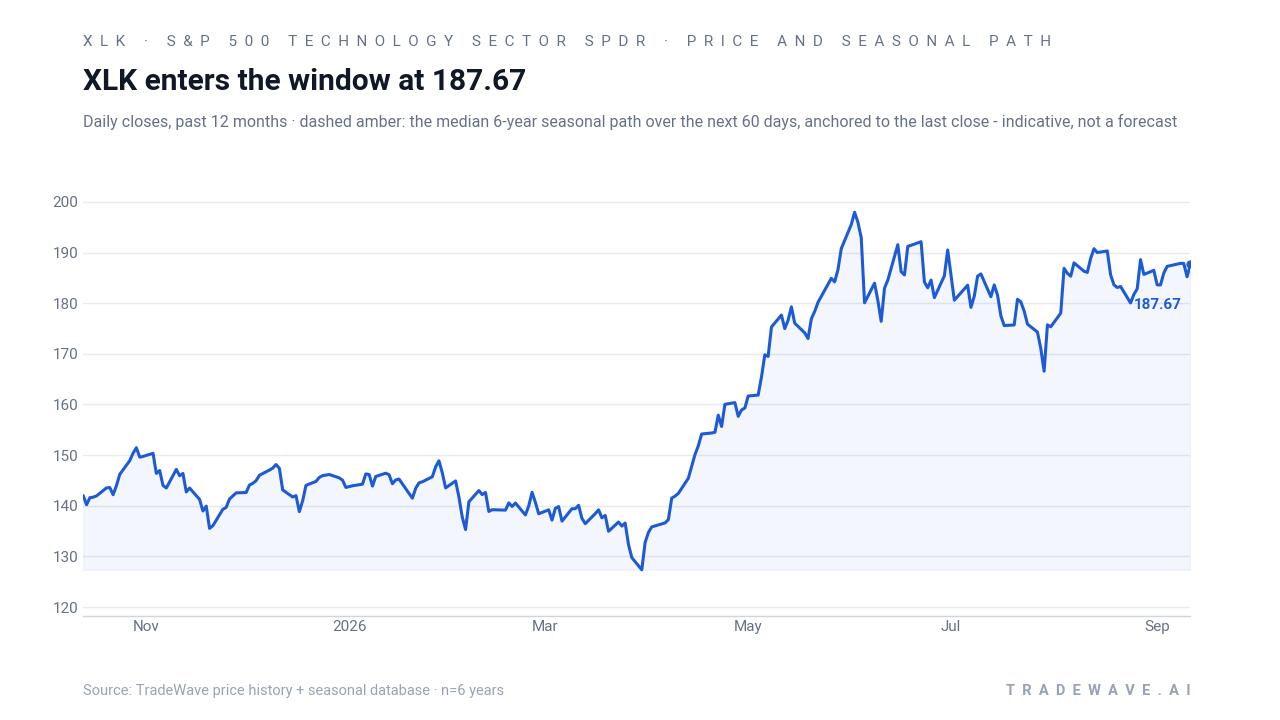
Macro commentary around the 2026 “sector derby” has framed XLK as a high-pedigree contender with strong growth and profitability but also elevated rate sensitivity and valuation risk, leaving room for sector rotation if bond yields back up or AI enthusiasm cools.[1][3] A June sector piece from Barchart highlighted how investors are already thinking about where to hide if the AI trade stumbles, with technology’s premium multiples a central part of that debate.[4] Against that backdrop, the upcoming seasonal window is less about calling a guaranteed rally and more about understanding how tech has historically behaved when policy uncertainty fades and investors reassess growth leadership heading into a pre-election year.
Sources
- Barchart - The S&P 500 Sector Derby of 2026: Betting on Winners in the Year of the Fire Horse
- GuruFocus - XLK Looks 32.5% Overvalued on GF Value™ as Traders Eye Key Pivot Levels
- GuruFocus - XLK Looks 34.0% Overvalued on GF Value™
- Barchart - When the AI Trade Collapses, These 3 S&P 500 Sectors Are Your Best Bet
About this seasonal analysis
Seasonal pattern data is sourced from TradeWave.ai, which analyzes historical price behavior across annual calendar windows going back up to 30 years. Read the full data methodology or the book The 100-Year Pattern by Afshin Moshrefi (2026 edition). Past performance of seasonal patterns does not guarantee future results. This article is for informational purposes only and does not constitute investment advice.