S&P 500 Financials Sector SPDR (XLF) Has Rallied in 6 of 6 Midterm Oct-Apr Windows
S&P 500 Financials Sector SPDR is up about 6% in 2026 and is heading toward an Oct 11–Apr 26 seasonal window that has never been negative in past midterm election years.

What is the seasonal pattern for S&P 500 Financials Sector SPDR (XLF)?
S&P 500 Financials Sector SPDR has risen in 6 of 6 midterm election years during the Oct 11–Apr 26 window, with an average gain of 9.2% in winning years.
- 6 for 6 in this window, with XLF averaging 9.2% gains in winning years across the last six midterm election years.
- The upcoming Oct 11–Apr 26 trading window spans 198 days and has been a consistently bullish seasonal stretch for financials.
- Percent Profitable is 100%, with 6 winners and 0 losers across the historical sample.
- Cumulative return from stacking this window across all six cycles is 69%, with a 9.17% annualized pace.
- Intraperiod swings have been meaningful, including a worst drawdown of -15.96% in 2018 even though that year still finished positive.
- Risk-adjusted performance is strong, with a Sharpe ratio of 2.39 and a TradeWave Ratio of 1.96 for this long setup.
According to historical data from TradeWave.ai, this midterm-to-pre-election stretch has behaved very differently from an average year for financials, and the next iteration is less than a month away.
How has S&P 500 Financials Sector SPDR (XLF) traded in the Oct–Apr midterm-year window?
The Oct 11–Apr 26 window has been quietly powerful for S&P 500 Financials Sector SPDR, with gains in every one of the last six midterm election years and a 9.2% average advance. Today XLF trades around 57.30, up about 6.18% year to date and not far from its recent record closing high set in late July 2026.[1][2][4]
Grouping the data by the presidential election cycle matters here because this window always lands in the late part of a midterm election year and runs deep into the following pre-election year, a phase that has often coincided with friendlier policy tone and improving risk appetite for cyclicals like banks and insurers.[2][4]
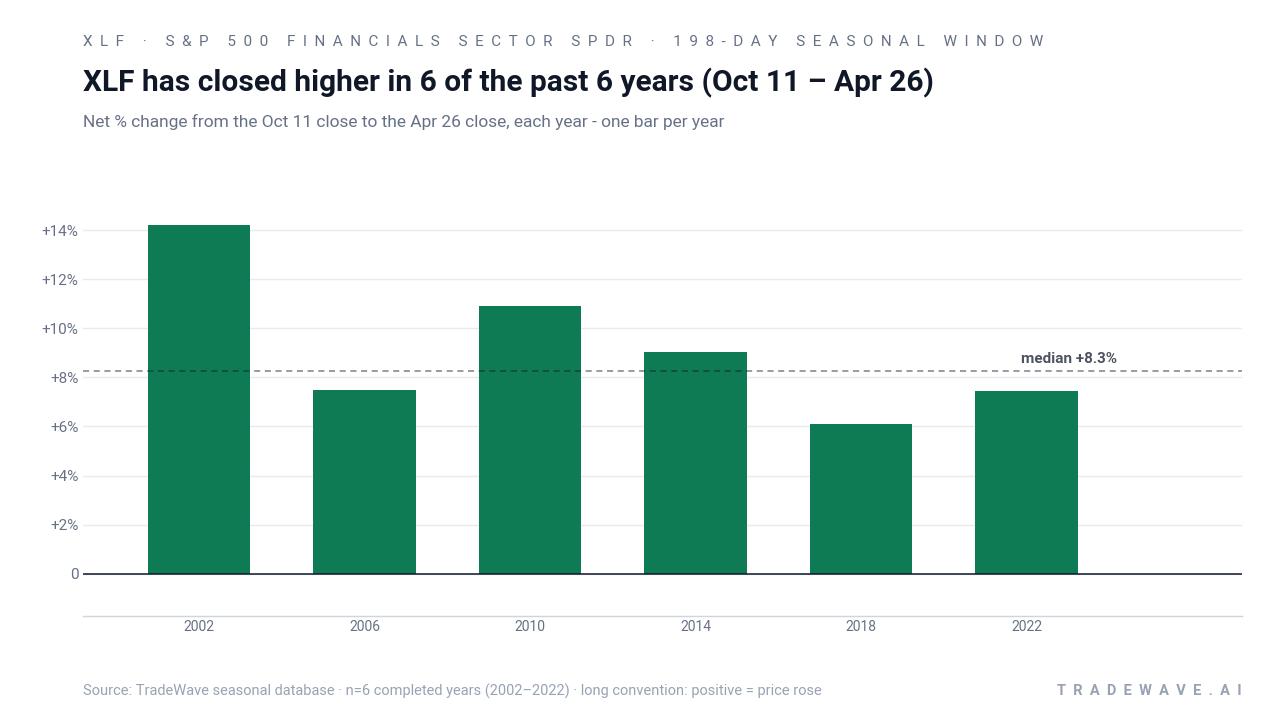
Across the six midterm election years in the sample, XLF’s Oct 11–Apr 26 performance has been uniformly positive, with net gains ranging from 6.12% in 2018 to 14.19% in 2002. The cumulative effect is striking: stacking those 198-day windows compounds to a 69% total return, or 9.17% annualized, for this long-only setup.
The per-year profile shows that the strongest upside excursions have not always lined up with the biggest final gains. In 2022, for example, XLF’s best intraperiod move reached 23.0% from the entry point, yet the window finished with a 7.46% net return as some of that strength faded before April 26. In 2010, the ETF logged a 17.59% peak run-up and still closed the window up 10.91%.
Drawdowns inside the window have been very real even in winning years. The 2018 stretch stands out: XLF ultimately gained 6.12% between Oct 11 and Apr 26, but at one point it was down as much as 15.96% from the entry price. Other years saw more modest worst-case dips, such as -2.07% in 2006 and -2.54% in 2022, underscoring that the path can be either smooth or choppy even when the destination has historically been higher.
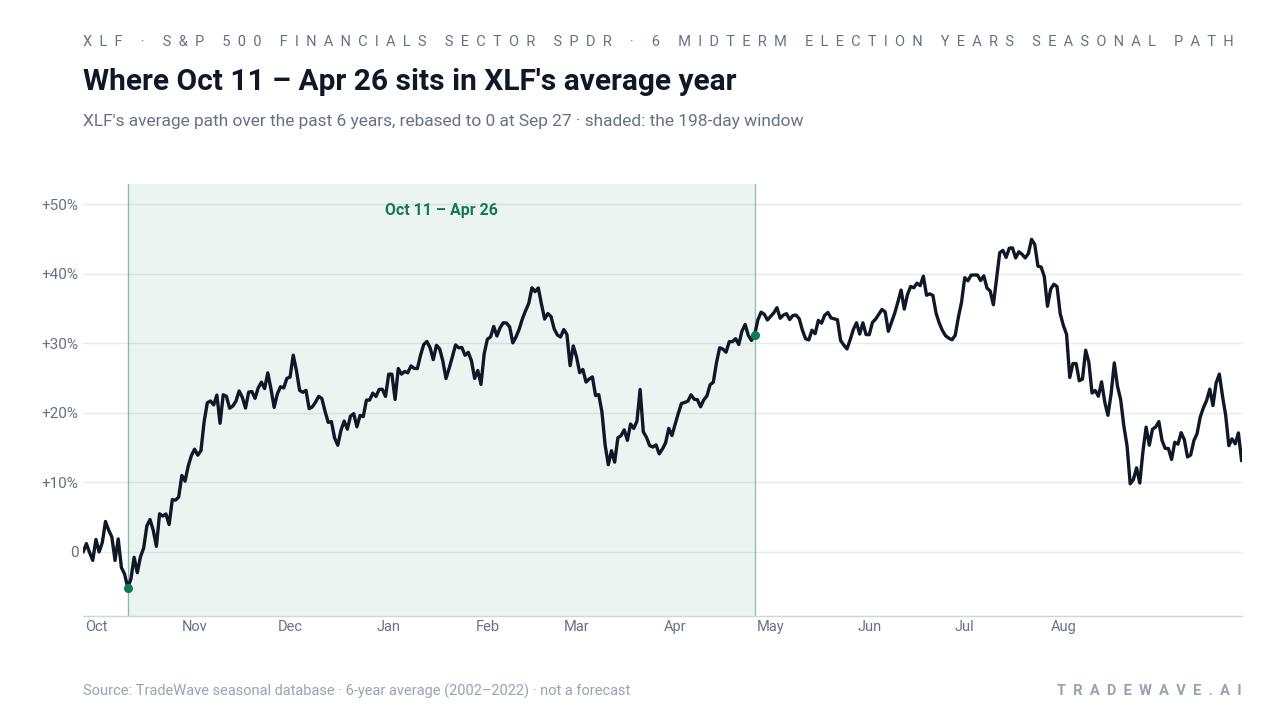
Year-by-year ranges show how much XLF has typically swung inside this window before settling at a higher close.
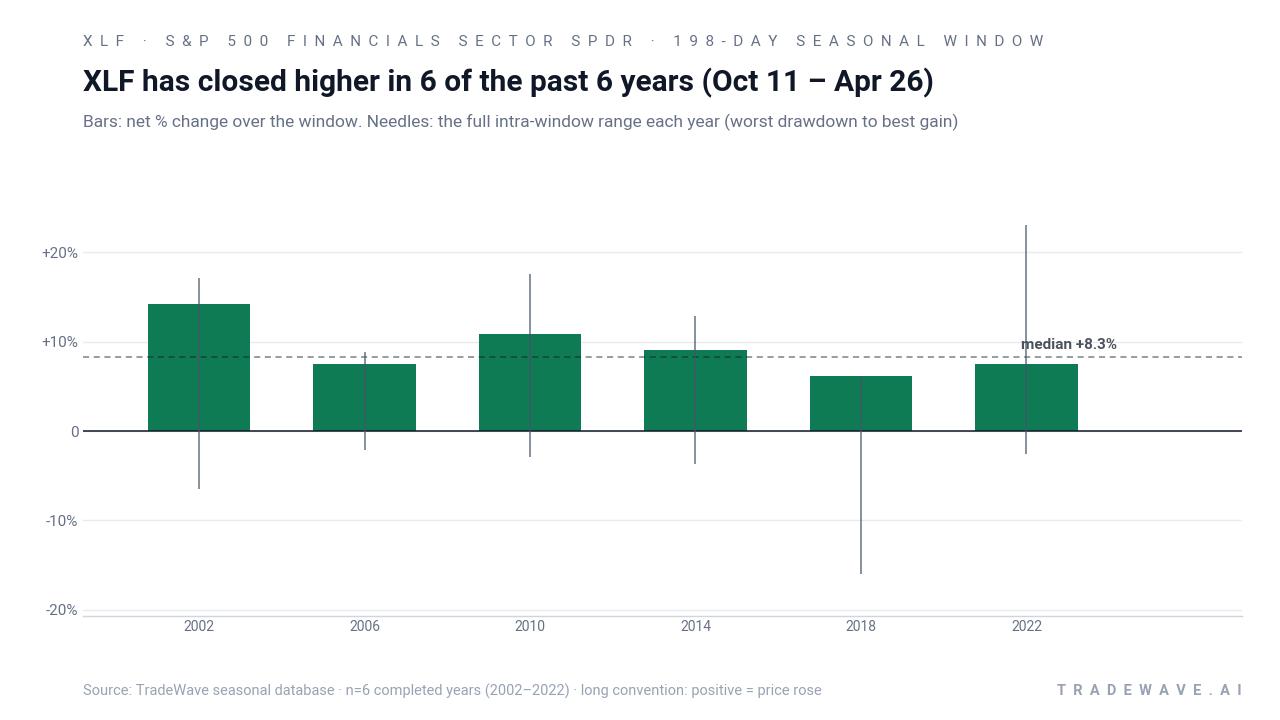
The stacked net / best-gain / worst-drawdown view shows a clear pattern: every bar ends above zero, but the needles stretch both higher and lower, reflecting a window where XLF has often traveled far in the trade direction while still subjecting holders to meaningful volatility. The combination of a 1.96 TradeWave Ratio and a 2.39 Sharpe ratio captures that mix of strong directional bias and non-trivial swings.
History does not guarantee future results; adverse excursions can be large even in winning windows, and a 100% hit rate across six cycles does not preclude a loss in the next one.
Why does S&P 500 Financials Sector SPDR (XLF) follow this seasonal pattern?
This pattern may reflect how the policy and earnings calendar lines up for financials between late in a midterm election year and the heart of the following pre-election year. One likely driver is that banks and insurers often report key quarters and update capital plans during this stretch, while regulatory and fiscal uncertainty tends to ease after midterm votes. Analysts have also pointed to institutional portfolio rebalancing and sector rotation into cyclicals as growth visibility improves, which can funnel flows into broad financials ETFs like XLF during this window.[2][4]
What is driving S&P 500 Financials Sector SPDR (XLF) today?
XLF sits near 57.30 after a modest pullback of about 1.38%, leaving the ETF up roughly 6.18% for 2026 and ahead by about 9.25% over the past year.[1][2] The fund notched a record closing high on Jul 28, 2026, helped by a 6.2% surge in July and a broader rebound in financials as earnings beat expectations and fears around private credit and AI-related disruption eased.[1][2]
Sector specialists say the rally has been underpinned by stronger-than-expected profitability and improving sentiment toward large banks and diversified financials, even as shifting rate-cut expectations have weighed on net interest margins at times.[2][4] Despite the gains, XLF still trades at a valuation discount of roughly 30% to the broader market by some measures, a gap that has drawn in value-oriented investors looking for late-cycle cyclicals with room to rerate.[2][4]
Concentration is a key feature of this ETF: nearly a quarter of assets sit in just two names, JPMorgan Chase and Berkshire Hathaway, and about 86.2% of the portfolio is allocated to financials, which means stock-specific moves in those giants can quickly ripple through the fund.[3][4] That structure has amplified both the upside during strong months like July and the downside during bouts of rate or credit anxiety, making the upcoming seasonal window particularly relevant for investors who use XLF as a proxy for the sector.
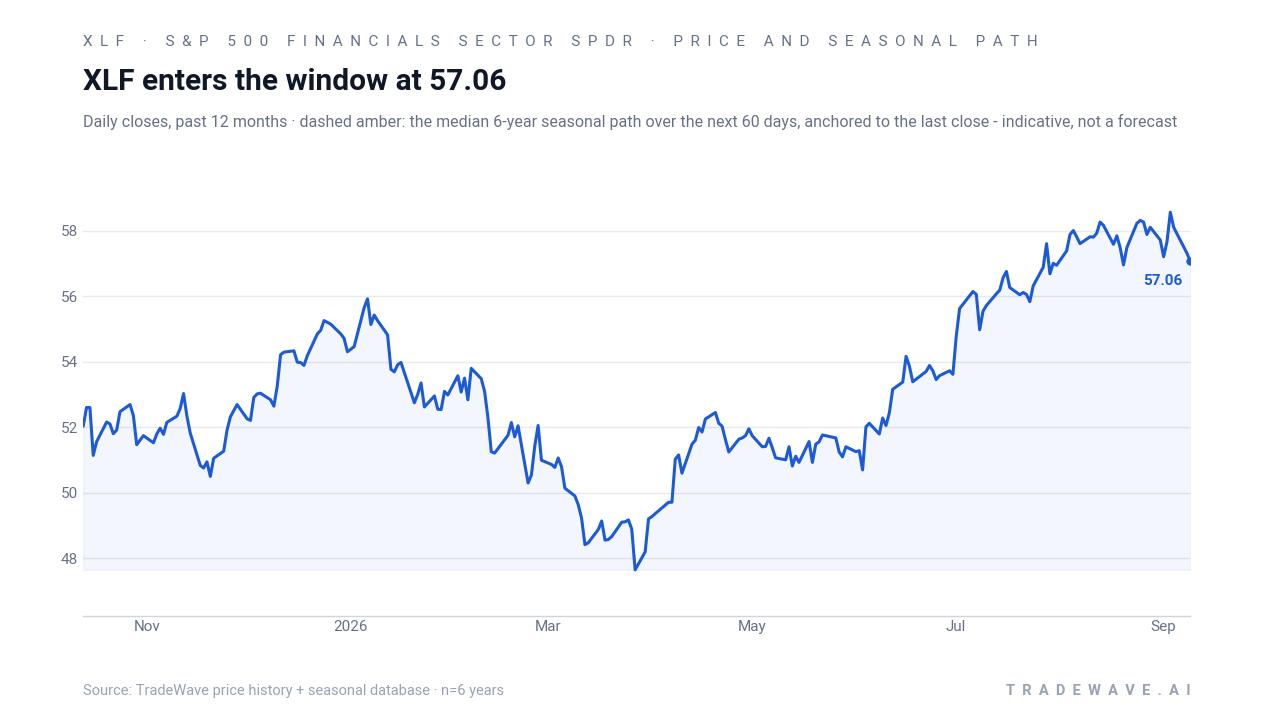
The chart below situates the latest move in its recent multi-month context and overlays the median seasonal path for the next 60 days.
What should traders watch as the Oct 11 window approaches?
First, the calendar: this 198-day stretch begins on Oct 11 and runs through Apr 26, overlapping the transition from a concluding midterm election year into the pre-election year, a phase that has historically been friendlier to risk assets and to financials in particular.[2][4] How XLF behaves into and through that handoff will show whether the current rally is tracking the historical seasonal trend or diverging from it.
Second, watch the path, not just the endpoint. Prior cycles show that XLF can experience double-digit drawdowns inside this window even when the final result is positive, as in 2018’s -15.96% intraperiod slide. If the ETF sees a sharp pullback after Oct 11 but holds above key support levels and then recovers into year-end, that would be consistent with the historical pattern of volatility followed by strength.
Third, keep an eye on macro and policy catalysts that cluster in this period, including bank earnings seasons, regulatory updates, and any shifts in the interest-rate outlook that could alter the sector’s margin and credit narrative.[1][4] A continuation of stronger earnings and stable credit trends would rhyme with prior winning years, while a surprise deterioration in those metrics could be the ingredient that finally breaks the 6-for-6 streak.
Sources
About this seasonal analysis
Seasonal pattern data is sourced from TradeWave.ai, which analyzes historical price behavior across annual calendar windows going back up to 30 years. Read the full data methodology or the book The 100-Year Pattern by Afshin Moshrefi (2026 edition). Past performance of seasonal patterns does not guarantee future results. This article is for informational purposes only and does not constitute investment advice.