S&P 500 SPDR (SPY) Has Rallied in 7 of 7 Midterm Oct-Jun Windows, Averaging 14.02% Gains
S&P 500 SPDR is hovering just below its 52-week high as it approaches an Oct 15 seasonal window that has delivered gains in every midterm election year in the dataset.

What is the seasonal pattern for S&P 500 SPDR (SPY)?
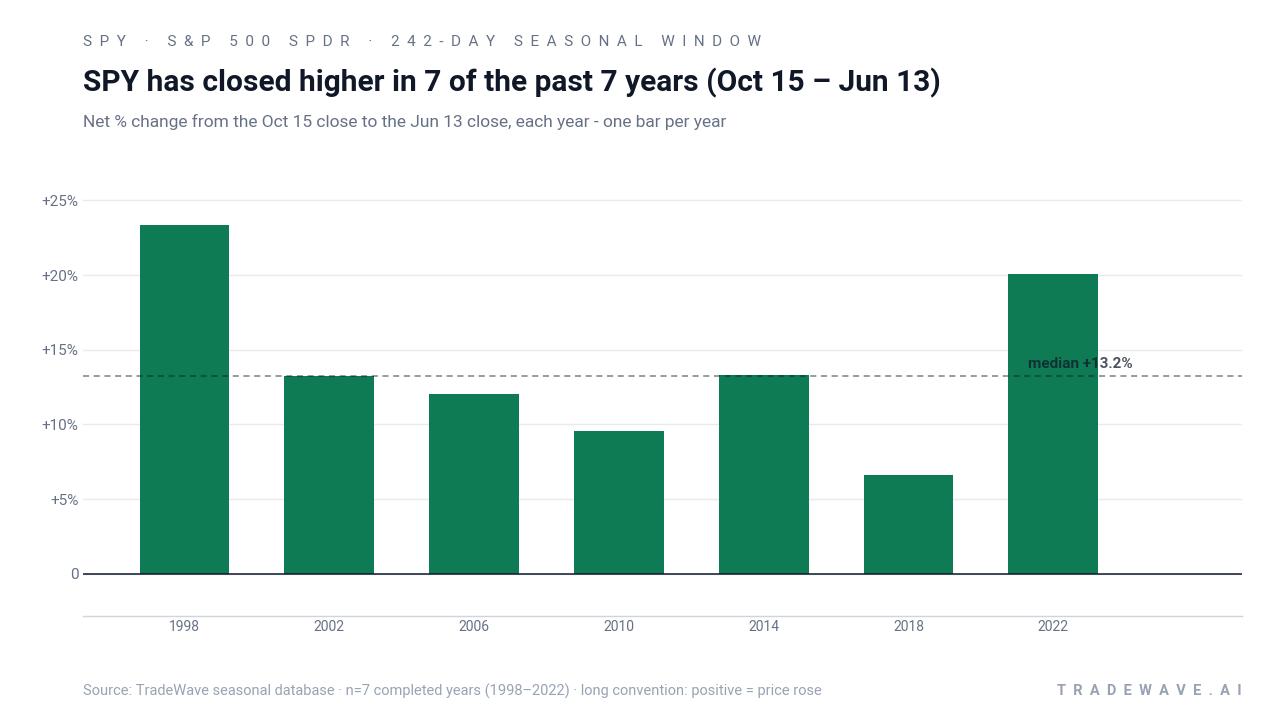
S&P 500 SPDR has risen in 7 of 7 midterm election years during the Oct 15 to Jun 13 window, with an average gain of 14.02% in winning years.
- 7 for 7 in this window, with S&P 500 SPDR averaging 14.02% gains in those winning years across the last 7 midterm election cycles.
- Seasonal window runs from Oct 15 through Jun 13, spanning 242 calendar days that historically favor long exposure in SPY.
- Percent Profitable is 100%, with 7 winners and 0 losers across the lookback sample.
- Annualized return for the pattern is 13.89%, with cumulative gains of 148% when the window is stacked across all seven years.
- The TradeWave Ratio of 2.14 signals that price has typically traveled meaningfully in the trade direction within the window, even before final outcomes are booked.
- Intraperiod swings have included sharp rallies and occasional double-digit drawdowns, underscoring that a strong seasonal edge has still come with real volatility.
According to historical data from TradeWave.ai, this midterm-to-pre-election stretch has behaved very differently from an average year for SPY, and the next iteration of that pattern is now on the calendar.
How has S&P 500 SPDR (SPY) traded in this Oct 15 to Jun 13 window?
The upcoming Oct 15 to Jun 13 window has been a perfect 7-for-7 winning streak for S&P 500 SPDR in past midterm election years, with average gains of 14.02% and no losing cycles. SPY last closed at 762.86, down 0.6% on the day and about 2.1% below its 52-week high of 779.37.[2] That combination of a strong historical seasonal trend and a market sitting near record territory gives this late-2026 setup unusual weight for anyone watching the presidential election cycle.
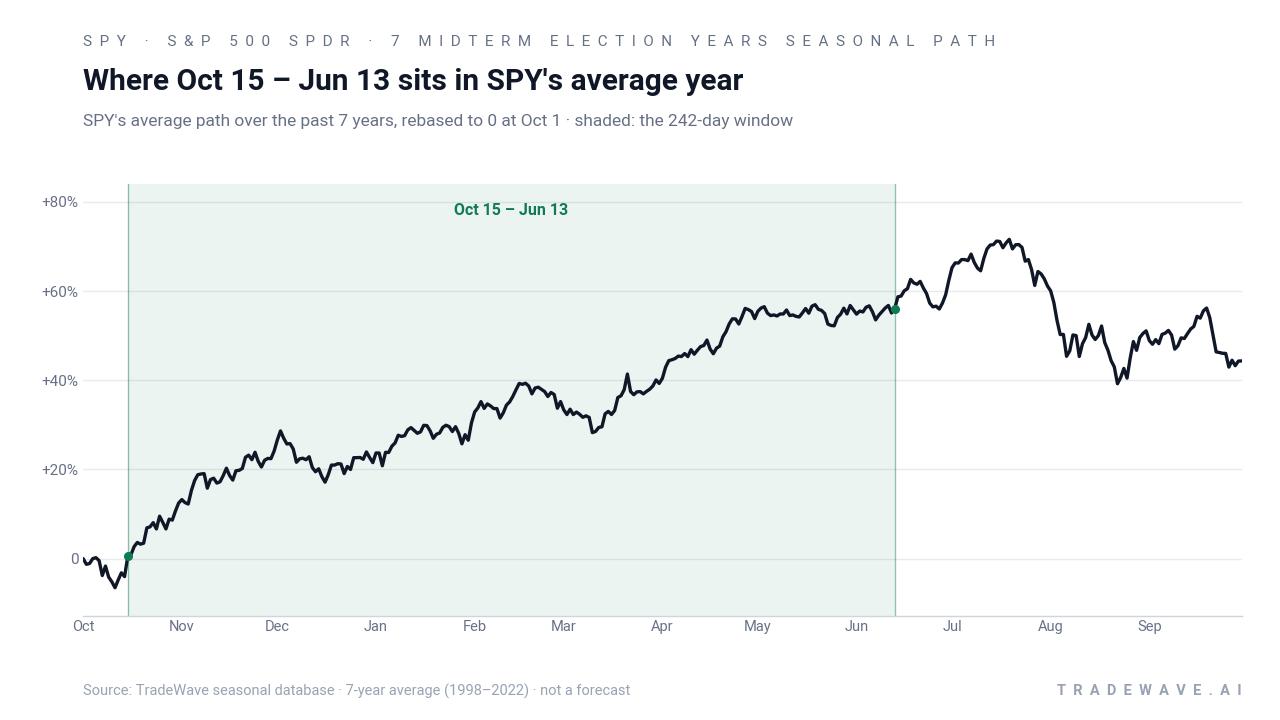
The election-cycle framing matters here. The lookback isolates the last seven midterm election years and tracks how SPY behaved from mid-October of those years into mid-June of the following pre-election year, a period when policy uncertainty tends to fade and fiscal and monetary levers often tilt more supportive of risk assets.
Within that group, SPY’s annualized return in the window clocks in at 13.89%, with a median gain of 13.25%. The weakest outcome was still a 6.62% advance in 2018, while the strongest was a 23.32% surge in the 1998–1999 stretch. Every one of those years rewarded long exposure over the full 242-day span, which is unusual consistency for a broad-market ETF.
Intraperiod swings have not been trivial. In 2002 and 2018, SPY ultimately finished the window higher but endured worst drawdowns of -10.07% and -14.31% from the entry point before recovering. By contrast, years like 1998, 2006 and 2022 saw maximum adverse moves of less than -1% while still delivering double-digit net gains, a profile that looks more like a grind higher than a roller coaster.
A second view combines net results with the full intraperiod range, from worst drawdown to best rally, for each year.
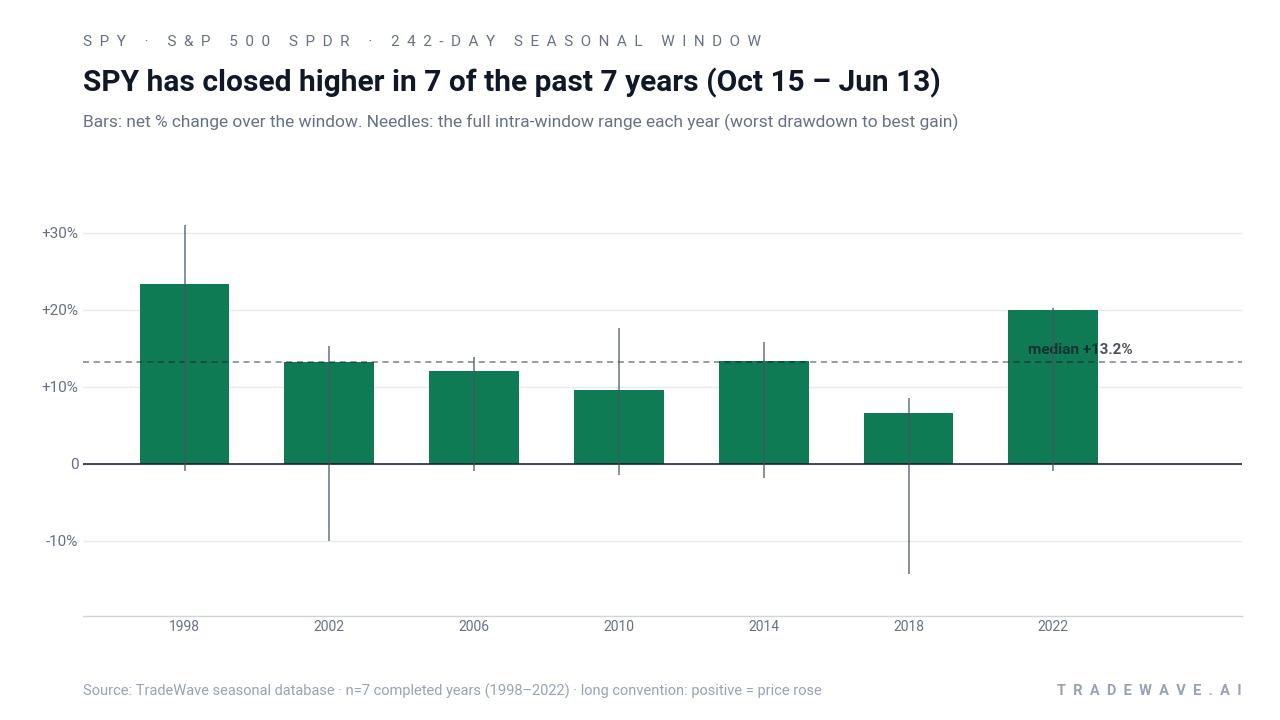
The bar-and-needle profile makes the trade-off clear. Maximum favorable excursions have often run into the mid-teens or higher, while maximum adverse excursions have ranged from shallow pullbacks to double-digit drawdowns. That mix is consistent with a long-biased but still volatile regime, not a straight line higher.
Stacking the window across all seven midterm cycles compounds to a 148% cumulative gain, which is what you would have earned by repeatedly holding SPY only during this Oct 15 to Jun 13 slice and sitting out the rest of the calendar. Add it up: seven cycles, no losses, and a long-run return profile that rivals many full-cycle buy-and-hold strategies.
History does not guarantee future results; adverse excursions (MAE) can be large even in winning windows.
Why does S&P 500 SPDR (SPY) follow this seasonal pattern?
One likely driver is the presidential election calendar itself. Midterm-year autumn often marks the point when policy risk peaks and then starts to recede, while the following pre-election spring has historically coincided with friendlier fiscal stances and improving risk appetite. Analysts have also pointed to institutional rebalancing, year-end tax positioning and the heavy concentration of earnings seasons inside this window as forces that can funnel flows into broad index products like SPY.
What is driving S&P 500 SPDR (SPY) today?
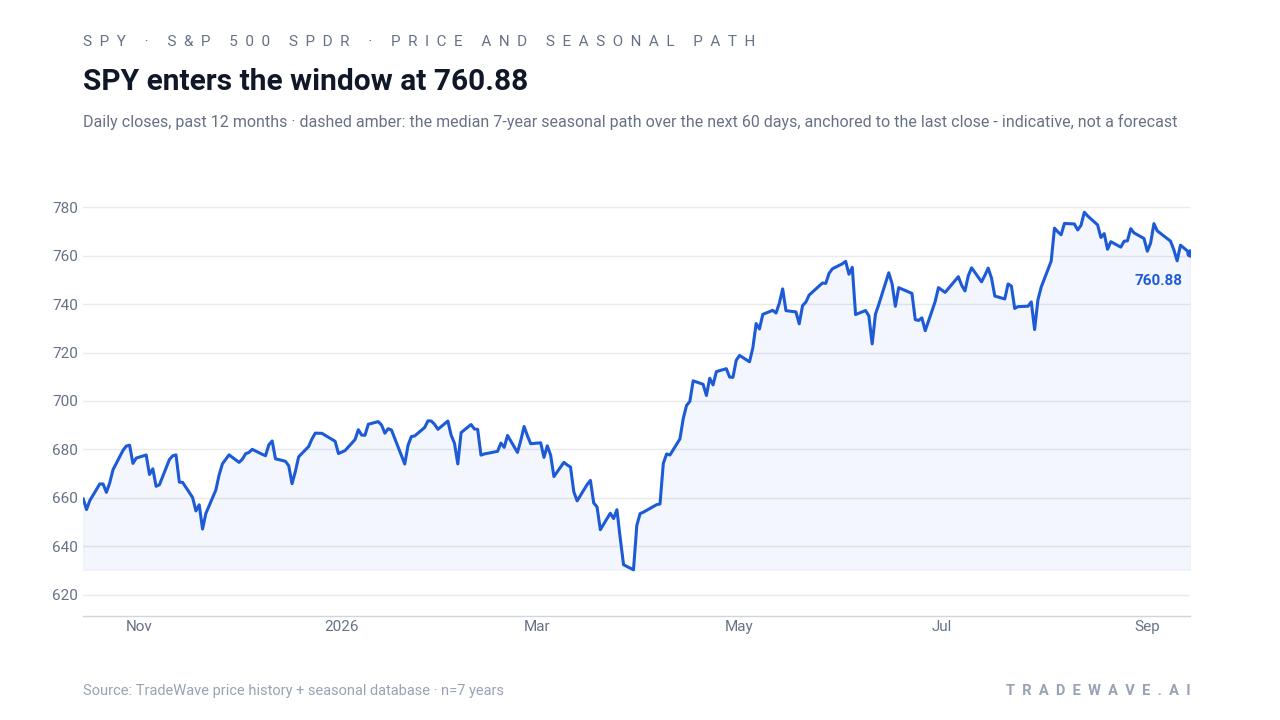
SPY’s latest close at 762.86 leaves it modestly off its 52-week high of 779.37, a roughly 2.1% gap that keeps the ETF in firmly bullish territory while signaling some consolidation after a strong run.[2] Technical dashboards still flag an uptrend, with SPY trading slightly above its 50-day moving average of 758.94 and sitting on elevated 20-day average volume of about 38 million shares, a backdrop that has kept short-term traders focused on support and resistance bands rather than deep pullbacks.[2][5][8]
Under the surface, breadth has swung between narrow leadership and broader participation in recent months, with several reports noting periods when only a handful of mega caps carried the index before breadth later improved.[2] That ebb and flow has mattered for SPY because the ETF is market-cap weighted, so leadership concentration can mask weakness in the average stock until volatility returns.
Macro remains the wild card. In Mar 2026, stronger-than-expected non-farm payrolls and sticky inflation revived debate about how quickly the Federal Reserve could pivot to rate cuts, a discussion that still hangs over valuations for the index today.[6] With unemployment around 4.1% and growth data mixed, traders are weighing whether the soft-landing narrative can coexist with SPY’s elevated level as the market heads into the seasonally important late-October pivot.
The chart below situates the latest move in its recent multi-month context and overlays the median seasonal path for the next 60 days.
What should traders watch as this SPY seasonal window approaches?
First, the calendar. The 242-day window begins on Oct 15 and runs through Jun 13, overlapping the transition from the concluding midterm election year into the pre-election year, a phase that has historically been one of the strongest stretches for the S&P 500 in this dataset. How SPY behaves into that start date will shape whether the pattern kicks in from a position of strength or after a shakeout.
Second, levels. On the upside, traders are watching the 52-week high near 779 as a key reference; a decisive break above that zone ahead of or early in the window would align with the historical long bias. On the downside, the 50-day moving average around 759 and any prior swing lows on heavy volume will be watched for signs that volatility is starting to challenge the trend.[2][5][8]
Third, macro and policy catalysts. Upcoming inflation prints, labor data and any shifts in Fed communication will feed directly into rate expectations, which in turn drive index multiples.[6] A backdrop of stable or easing policy anxiety has historically been friendlier to the kind of steady grind higher that shows up in the seasonal trend chart.
Finally, behavior inside the window will be the real test. If SPY enters Oct 15 near highs and then spends the following months making higher lows with pullbacks contained to single-digit drawdowns, that would rhyme with the stronger historical years. A deeper, faster selloff early in the window would not invalidate the pattern, but it would echo 2002 and 2018, when investors had to sit through double-digit adverse moves before the seasonal tailwind ultimately reasserted itself.
Sources
- Yahoo Finance - State Street SPDR S&P 500 ETF Trust (SPY) - Yahoo Finance
- ChartMill - SPY Stock Price, Quote & Chart | ChartMill
- SEC (State Street) - SPDR S&P 500 ETF TRUST
- MarketWatch - SPY | State Street SPDR S&P 500 ETF Trust Overview
- Barchart - SPY Barchart Opinion for SPDR S&P 500 ETF - Barchart.com
- Yahoo Finance (Markets article) - S&P 500 Is Sitting 6% Below Its January Record. Is Now the Time to Add to Your SPY Position?
- MarketBeat - SPDR S&P 500 ETF Trust (SPY) Short Interest & Short Float
- ChartMill - SPY Technical Analysis | Trend, Signals & Chart Patterns
About this seasonal analysis
Seasonal pattern data is sourced from TradeWave.ai, which analyzes historical price behavior across annual calendar windows going back up to 30 years. Read the full data methodology or the book The 100-Year Pattern by Afshin Moshrefi (2026 edition). Past performance of seasonal patterns does not guarantee future results. This article is for informational purposes only and does not constitute investment advice.