S&P 500 Technology Sector SPDR (XLK) Has Rallied in Every Oct 11-Apr 24 Midterm Window So Far
S&P 500 Technology Sector SPDR is edging higher ahead of an Oct 11 seasonal window that has been quietly powerful for tech in past midterm election years, even as valuations and sector rotation keep traders cautious.

What is the seasonal pattern for S&P 500 Technology Sector SPDR (XLK)?
S&P 500 Technology Sector SPDR has risen in 6 of 6 midterm-election-year Oct 11–Apr 24 windows, with an average gain of 16.94% in winning years.
- 6 for 6 in this window, with XLK averaging 16.94% gains across all completed Oct 11–Apr 24 midterm-election-year stretches.
- Seasonal direction is bullish: Percent Profitable is 100.0%, with 6 winners and 0 losers in the sample.
- Average winner profit of 16.94% stacks into a 154.17% cumulative return when the window is repeated across the six midterm election years.
- The TradeWave Ratio of 1.81 suggests price has typically traveled meaningfully in the long direction within the window, beyond just the final close.
- A Sharpe ratio of 2.49 for this window points to strong risk-adjusted returns relative to the volatility of outcomes.
- Individual years have still seen sharp intraperiod swings, including a worst drawdown of -15.75% in 2018 before finishing higher.
According to historical data from TradeWave.ai, this midterm-election-year window for XLK has behaved very differently from an average six-month stretch, and the next iteration is about to open.
How has S&P 500 Technology Sector SPDR (XLK) traded in the Oct 11–Apr 24 window?
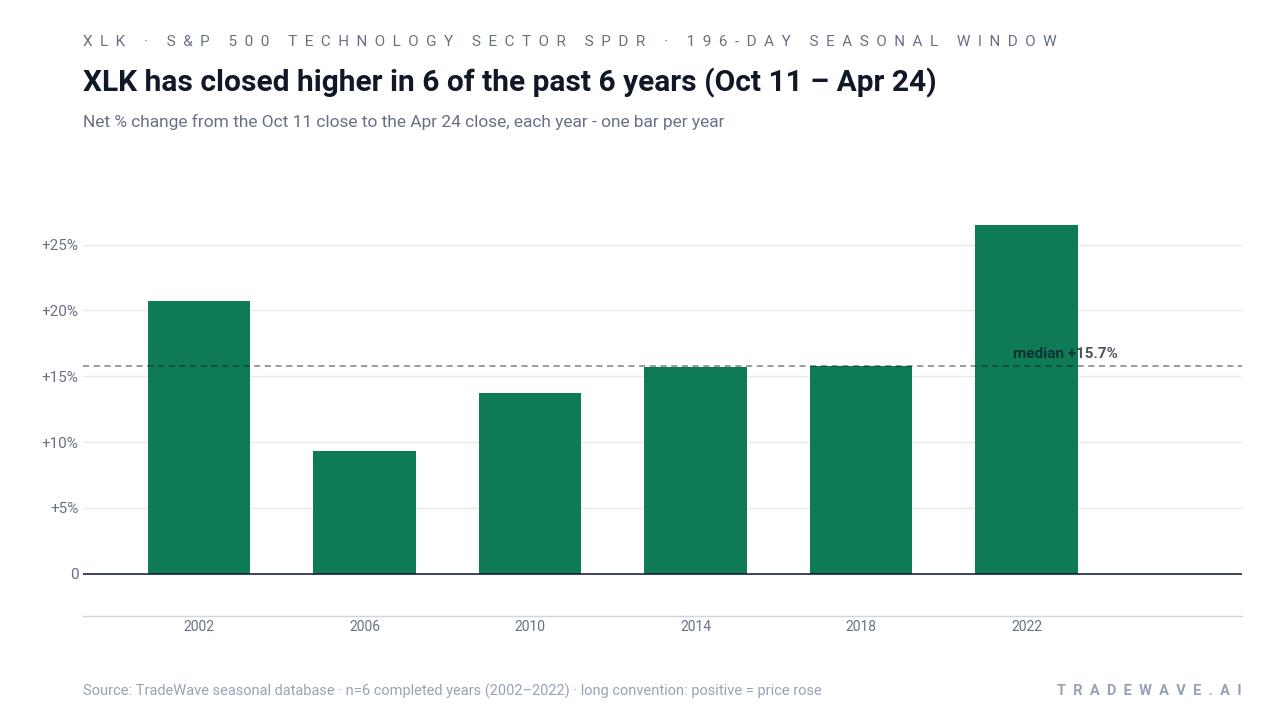
S&P 500 Technology Sector SPDR has closed higher in every single Oct 11–Apr 24 window across the last six midterm election years, averaging a 16.94% gain with no losing cycles. The ETF finished the prior session at 189.60, leaving it about 4.1% below its 52-week high of roughly 197.80 and well above its 50-day moving average near 182.88. That combination of a strong historical seasonal trend and a price still shy of the highs is the backdrop as tech heads toward another late-year stretch that has repeatedly favored the bulls.
The presidential election cycle matters here because this pattern only looks at midterm election years, which often feature policy uncertainty early on and a more constructive risk tone as markets pivot toward the coming pre-election year. Pattern phase equals the midterm election year, and calendar phase is also the midterm election year, but in the late part of that year as investors start to discount the pre-election backdrop. This Oct 11–Apr 24 stretch also overlaps the broader midterm-to-pre-election “100-Year Pattern” regime that has historically been one of the strongest spans for the S&P 500 and its heavyweight tech components.
Trade direction for this setup is long, and the historical record has been clean. Percent Profitable sits at 100.0%, with 6 winners and 0 losers across the midterm-election-year sample. Average profit of 16.94% means the typical year in this window has delivered a mid-teens gain from the Oct 11 close to the Apr 24 close, and because there are no losing years in the sample, that figure is identical whether you look at winners only or all years together. The cumulative return from stacking those six windows is 154.17%, which shows how powerful this specific slice of the calendar has been when repeated across cycles.
Under the surface, the volatility profile has been manageable but not trivial. Maximum favorable moves have reached as high as 37.35% in 2002 and 30.24% in 2022, showing that in strong years XLK has often pushed well beyond its final gain before the window closed. On the downside, the worst intraperiod drawdown was a -15.75% slide in 2018 before the ETF still finished the window up 15.81%, while other years saw much shallower adverse moves, including essentially no downside in 2006. That mix of sizable upside excursions and occasional double-digit pullbacks is what the TradeWave Ratio of 1.81 and Sharpe ratio of 2.49 are summarizing in a single set of statistics.
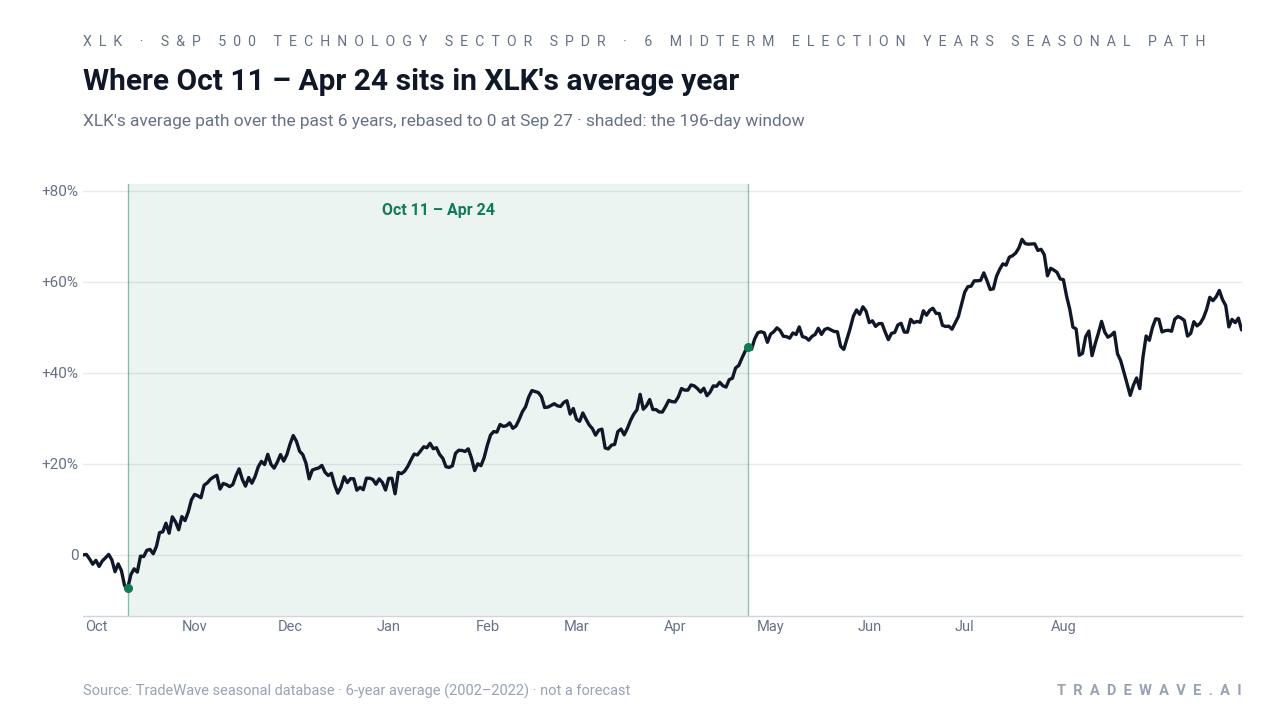
The historical seasonal average path suggests that strength in this window has not been a one-off spike. Instead, XLK has tended to climb through much of the 196-day stretch, with gains often accelerating as the calendar moves from the late midterm election year into the early pre-election year. That fits the broader pattern of investors leaning back into growth and technology exposure once midterm policy risk is largely priced and the next presidential race comes into view.
Yearly net returns and intraperiod swings show how much room XLK has had to run and how deep pullbacks have been before those gains locked in.
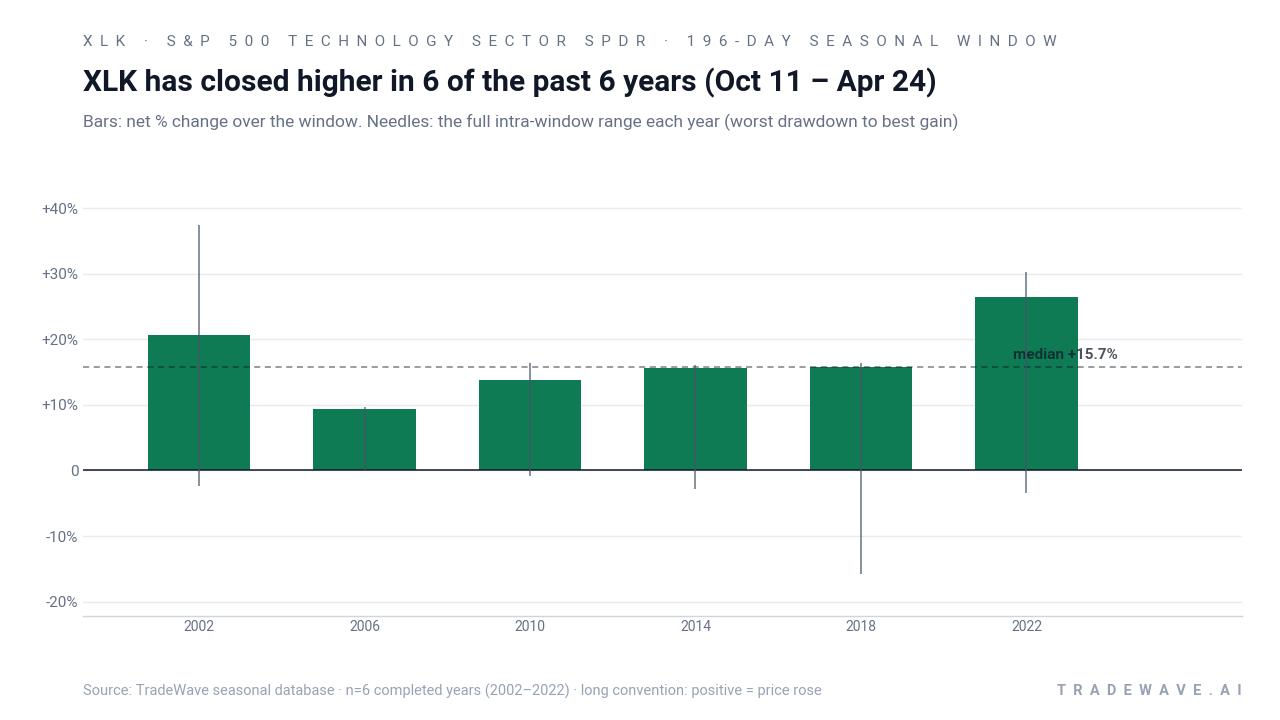
Looking at individual years, 2022 stands out as the strongest net result with a 26.46% gain, while 2006 was the softest at 9.3%, yet still positive. The bar-and-needle profile shows that even in the better years, XLK often experienced meaningful swings between its worst drawdown and best rally inside the window, which is consistent with a high-beta sector digesting macro headlines while still trending higher over the full period. Add it up: six for six, mid-teens average gains, and a track record of rewarding long exposure in this specific midterm-to-pre-election stretch, albeit with enough volatility to shake out weak hands along the way.
History does not guarantee future results; adverse excursions (MAE) can be large even in winning windows, and traders should size risk accordingly.
Why does S&P 500 Technology Sector SPDR (XLK) follow this seasonal pattern?
One likely driver is the way the presidential election cycle shapes risk appetite, with investors often rotating back into growth and technology as midterm uncertainty fades and the pre-election year’s historically supportive backdrop approaches. Analysts have also pointed to the clustering of big-cap tech earnings, product launches, and capital spending plans across this late-year and early-year span, which can reinforce momentum in sector leaders that dominate XLK’s holdings.[3] The pattern may also reflect institutional portfolio rebalancing and sector rotation, as managers lean into tech’s structural growth story once policy and rate fears ease.
What is driving S&P 500 Technology Sector SPDR (XLK) today?
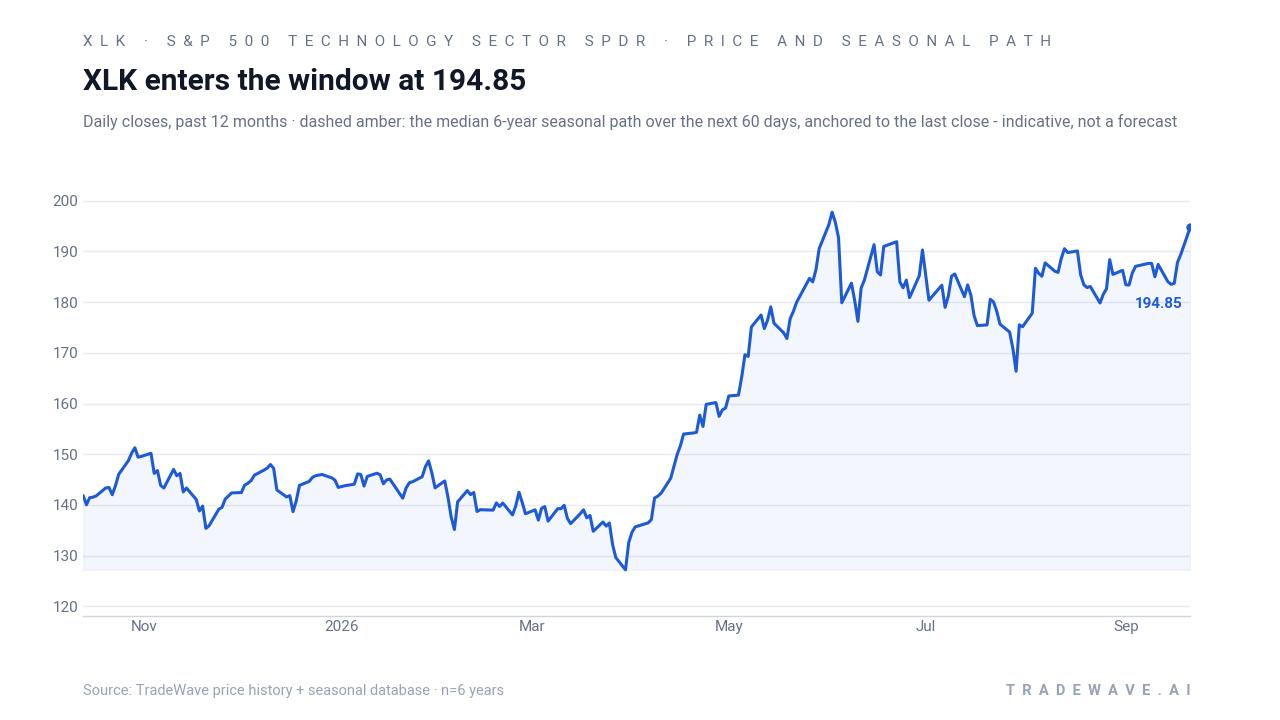
S&P 500 Technology Sector SPDR last traded around 189.60, up about 0.82% on the day, extending a roughly 6.54% gain over the past month and trading comfortably above its 50-day moving average near 182.88. That leaves the ETF still below its 52-week high near 197.80 but far from the 52-week low around 66.19, underscoring how dominant the technology sector has been in this cycle.
In Feb 2026, one sector “derby” analysis argued that XLK’s pedigree was strong but flagged it as an unlikely winner in the year’s sector race because of valuation concerns, even as tech remained a core leadership group.[1] In Jun 2026, another piece highlighted modest intraday gains for XLK while suggesting that more defensive sectors could benefit if the artificial-intelligence trade lost steam, again underscoring how much macro sentiment and positioning are tied to this ETF’s heavyweights.[2] A Dec 2025 overview of tech ETFs also stressed XLK’s concentration in mega-cap names, which amplifies both upside and downside when market narratives around growth, rates, or regulation shift.[3]
The chart below situates the latest move in its recent multi-month context and overlays the median historical seasonal path for the next 60 days.
What should traders watch as XLK approaches this seasonal window?
First, the calendar: the 196-day window opens on Oct 11 and runs through Apr 24, covering the final stretch of the midterm election year and the first months of the pre-election year. Historically, this has been a sweet spot for XLK, with 6 winners and 0 losers and a 16.94% average gain, but the path has included drawdowns as deep as -15.75% before recovering. How XLK behaves into and through that start date will show whether current strength is already front-running the pattern or leaving room for the typical late-year grind higher.
Second, macro and policy catalysts will matter. The technology sector’s leadership and valuation premium have been recurring themes, with prior commentary warning that rich multiples could limit upside if growth expectations or AI enthusiasm cool.[1][2][3] Any shift in rate expectations, regulatory headlines around big tech, or earnings surprises from XLK’s largest holdings could either reinforce the historical seasonal tailwind or overwhelm it.
Third, traders should monitor volatility inside the window, not just the end result. Past cycles show that even winning years have seen sizable swings between maximum favorable and maximum adverse moves, so behavior around pullbacks will be key. If dips during the window are shallow and quickly bought, that would rhyme with the stronger historical years like 2002 and 2022; if drawdowns deepen and stay unresolved, it would mark a departure from the clean six-for-six record.
Finally, because XLK is a core proxy for U.S. large-cap technology, its behavior in this historically strong midterm-to-pre-election window will feed directly into broader index sentiment. Traders watching this XLK seasonal trend will be looking for confirmation that tech can again carry the tape through the election-cycle handoff, or early signs that this time the pattern is breaking.
Sources
About this seasonal analysis
Seasonal pattern data is sourced from TradeWave.ai, which analyzes historical price behavior across annual calendar windows going back up to 30 years. Read the full data methodology or the book The 100-Year Pattern by Afshin Moshrefi (2026 edition). Past performance of seasonal patterns does not guarantee future results. This article is for informational purposes only and does not constitute investment advice.