Six-for-Six Midterm Run: S&P 500 Financials Sector SPDR (XLF) Averages 9.06% Gains
S&P 500 Financials Sector SPDR is sitting about 4.7% below its 52-week high as it heads toward an Oct 20 seasonal window that has never produced a loss in the midterm election years studied.
What is the seasonal pattern for S&P 500 Financials Sector SPDR (XLF)?
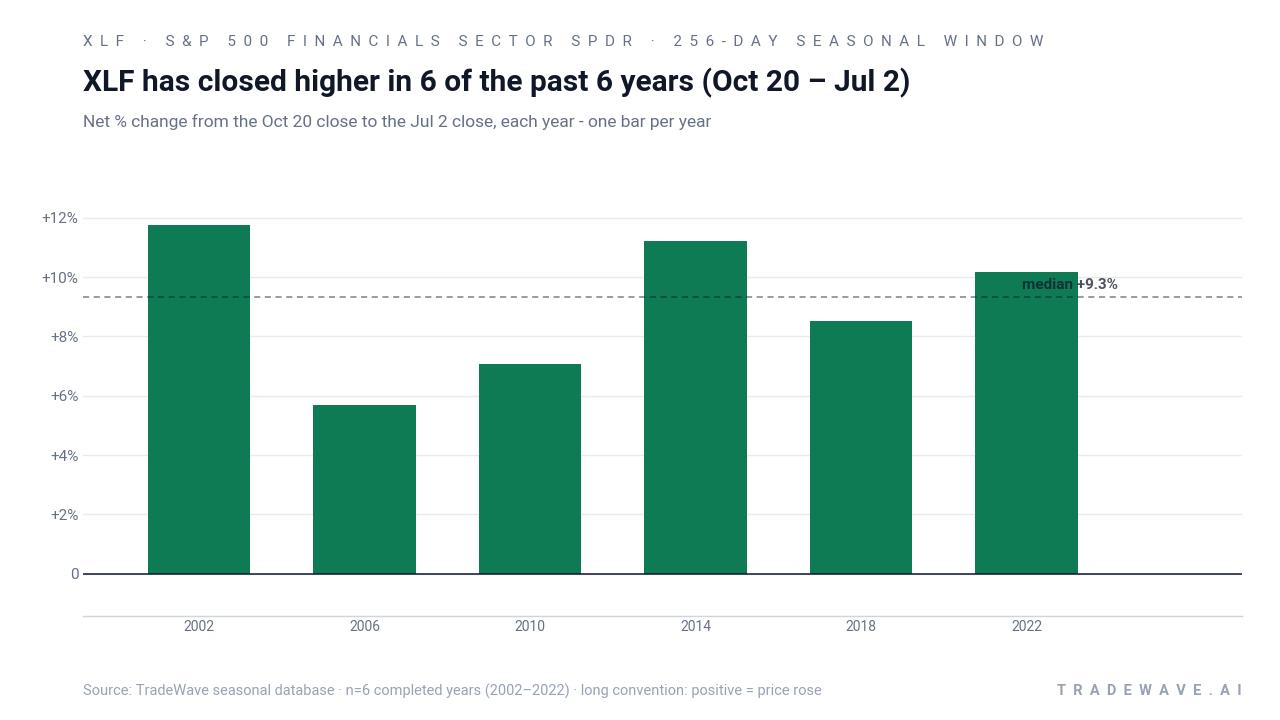
S&P 500 Financials Sector SPDR has risen in 6 of 6 midterm-year Oct 20 to Jul 2 windows, with an average gain of 9.06% in winning years.
- 6 for 6 in this window, with XLF averaging 9.06% gains across all six midterm election years in the sample.
- Seasonal window runs from Oct 20 through Jul 2, spanning 256 calendar days and covering the late midterm year into the pre-election year.
- Percent Profitable is 100.0%, with 6 winners and 0 losers for the long trade direction.
- Average winner gain is 9.06%, with a median outcome of 9.34%, and a cumulative compounded return of 68.09% across the six cycles.
- Intraperiod swings have been meaningful, with individual years showing worst drawdowns as deep as about 15% even though they finished higher.
- Risk-adjusted performance is strong, with a Sharpe ratio of 2.62 and a TradeWave Ratio of 2.76 for this specific XLF seasonal trend.
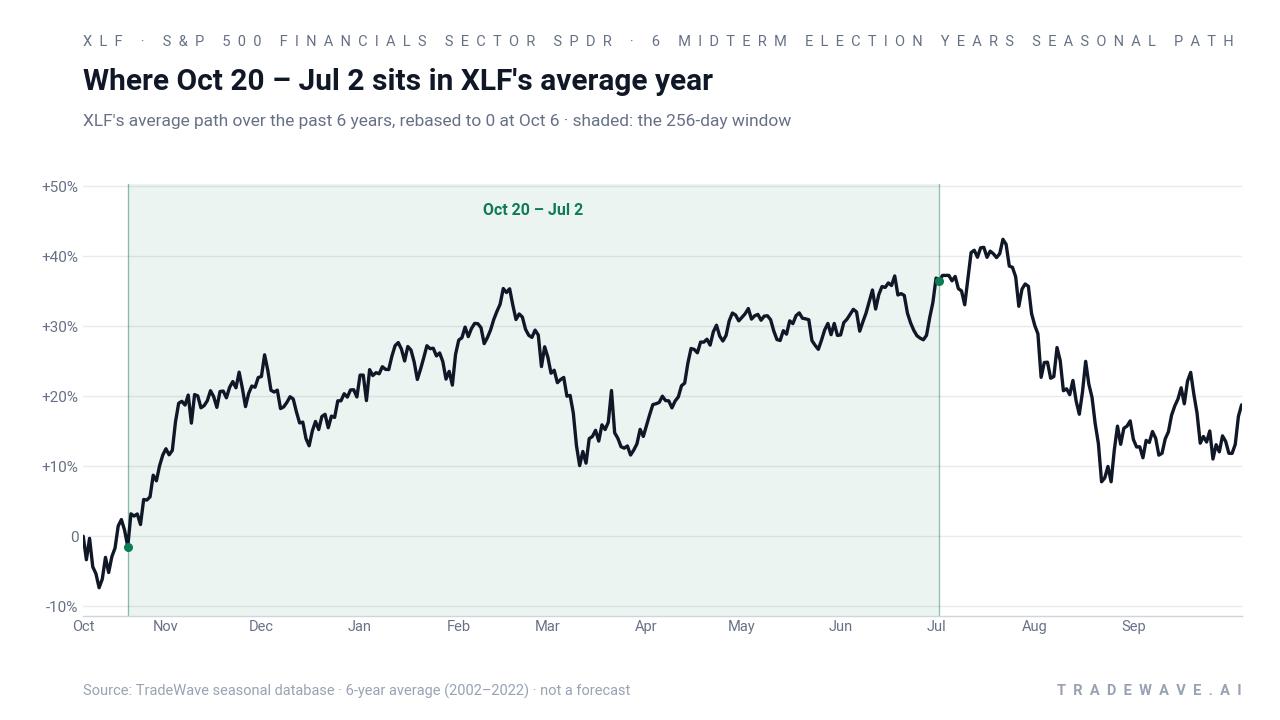
According to historical data from TradeWave.ai, this midterm-year stretch for XLF has behaved very differently from an average calendar period, with a distinct late-year to mid-year bias that traders often overlook.
How has S&P 500 Financials Sector SPDR (XLF) traded in the Oct 20 to Jul 2 window?
S&P 500 Financials Sector SPDR has closed higher in every single Oct 20 to Jul 2 window across the last six midterm election years, averaging 9.06% gains for the long side. At Friday’s close of 55.86, XLF sits about 4.7% below its 52-week high of 58.60 and roughly 18.0% above its 52-week low, leaving it closer to the top of its recent range as this historically strong regime approaches.
The presidential election cycle matters here because this pattern only looks at the last six midterm election years, a phase that often features tighter financial conditions and shifting expectations for regulation and fiscal policy. Grouping by that phase filters out noise from other parts of the cycle and focuses on how financials have behaved when Washington is in the middle of a term and markets are already looking ahead to the pre-election year.
This seasonal window begins on Oct 20 and spans 256 days, carrying XLF from the concluding midterm election year into the heart of the pre-election year. The trade direction is long, and across the six midterm-year samples the Percent Profitable is 100.0%, with 6 winners and 0 losers. Average profit across all years is 9.06%, with a median outcome of 9.34%, so the typical year has delivered a mid‑single to low‑double‑digit gain rather than a single outlier skewing the numbers.
Looking at individual years, 2002 and 2014 stand out with net returns of 11.74% and 11.21% respectively, while 2006 is the softest at 5.69%. Even in that weaker year, the long trade still finished positive. On the downside, the worst intraperiod drawdowns have been meaningful: in 2002 XLF fell as much as about 15.69% below the entry at one point, and in 2018 the worst pullback reached roughly 14.99% before the ETF recovered to finish the window up 8.51%. That mix of steady final gains and sometimes sharp mid-window dips is a key feature of this XLF seasonal trend.
The maximum favorable moves inside the window have also been sizable. In 2010, for example, XLF’s best run-up from the entry reached 18.15%, while 2022 saw a peak gain of 19.46% before settling at a 10.16% net return. That gap between the best intraperiod level and the final close shows why the TradeWave Ratio of 2.76 matters: it captures how far price typically travels in the trade direction within the window, not just where it ends.
The next view combines yearly net results with the full intraperiod range, from worst drawdown to best rally.
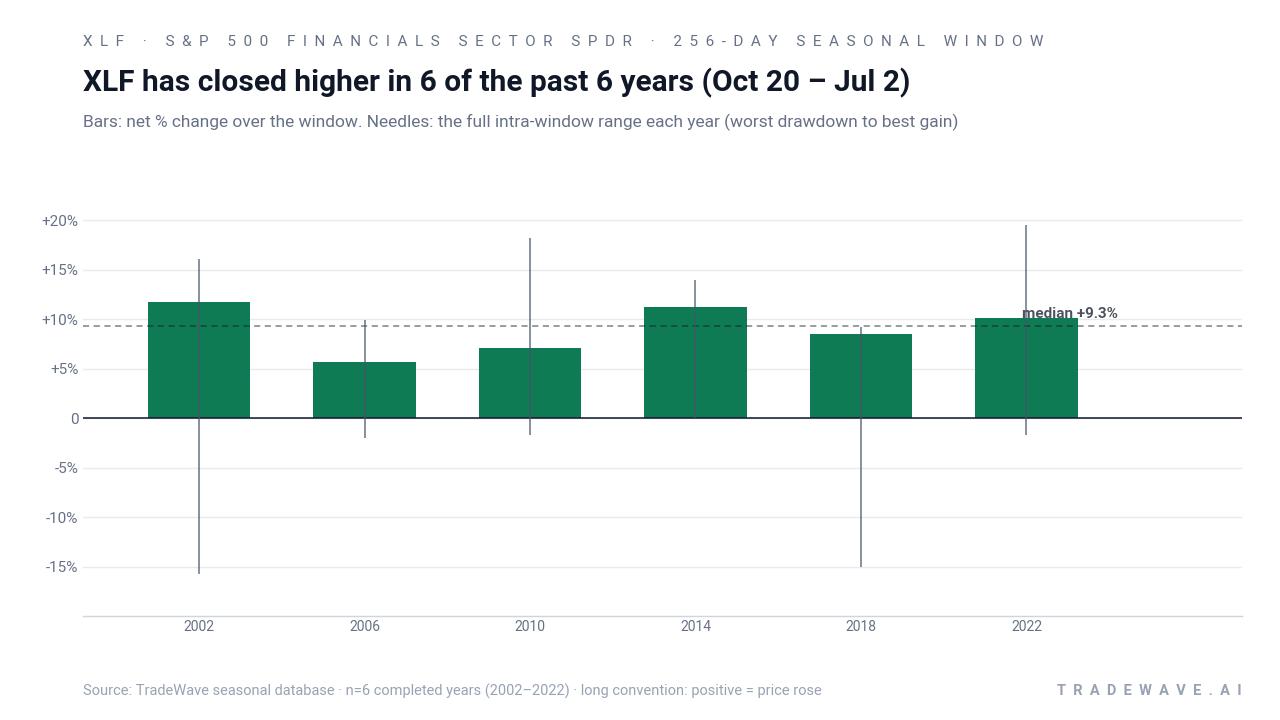
The stacked net, best‑gain and worst‑drawdown profile underlines the trade-off. Upside potential has been meaningful in every sample year, but the MAE needles show that XLF has often tested traders’ patience with mid-window pullbacks before finishing higher. Add it up: six straight winning windows, 68.09% cumulative gains, and a Sharpe ratio of 2.62, but with intraperiod swings that can easily run into double digits.
History does not guarantee future results; adverse excursions can be large even in winning windows, and past seasonal behavior may not repeat.
Why does S&P 500 Financials Sector SPDR (XLF) follow this seasonal pattern?
This XLF seasonal pattern likely reflects a mix of earnings clustering, policy expectations and portfolio rebalancing around the midterm-to-pre-election transition. Large banks and insurers report key quarters and update guidance through this stretch, while investors digest any midterm election policy shifts and position for the historically stronger pre-election year. Institutional allocators also tend to rebalance and rotate sector exposure around year-end and into the new year, which can funnel flows into financials when risk appetite improves.
What is driving S&P 500 Financials Sector SPDR (XLF) today?
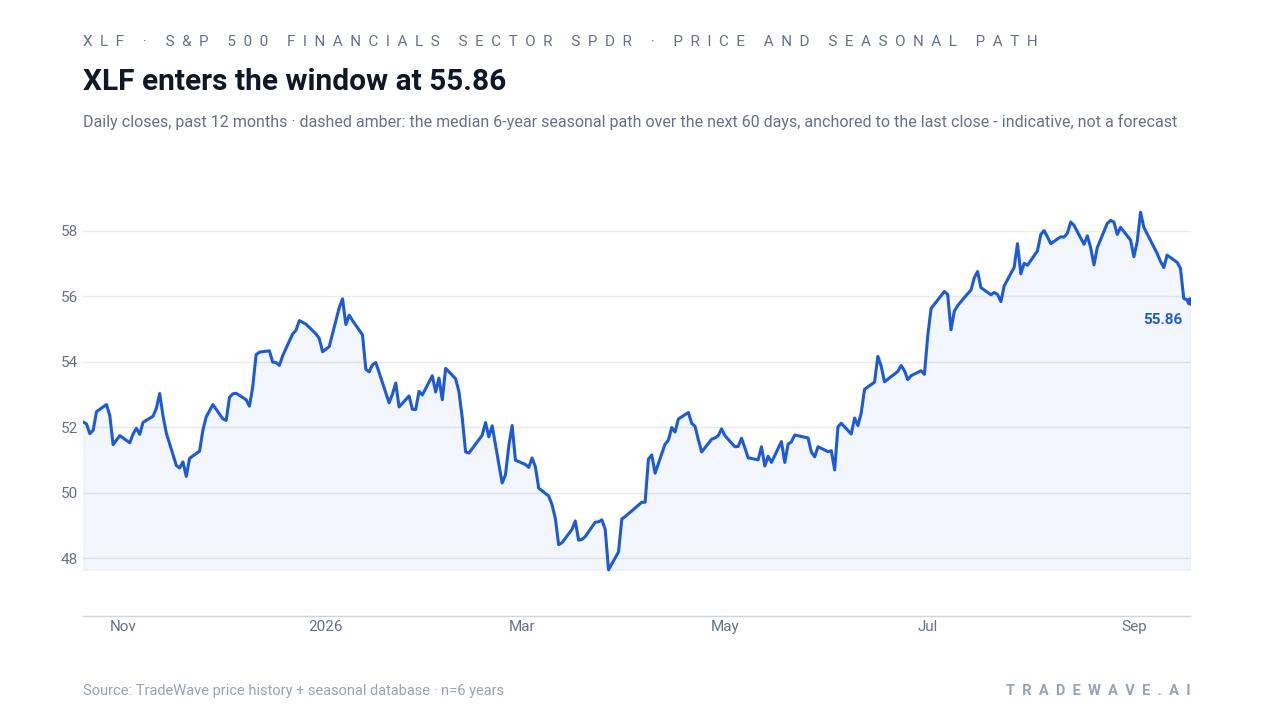
XLF finished the prior session at 55.86, down 0.04% on the day, leaving it about 4.7% below its 52-week high of 58.60 and roughly 18.0% above its 52-week low near 47.34. The ETF’s 50-day moving average sits at 57.18, so the fund is trading modestly below its short-term trend line, while the 20-day average volume of about 30.7 million shares points to deep liquidity even as flows have cooled from earlier in the year.
Macro expectations around interest rates remain the main driver for the financials sector. When markets lean toward faster or deeper rate cuts, bank net interest margins compress, which has weighed on XLF relative to the broader S&P 500 as investors reassess profitability for lenders and diversified financials.[3] At the same time, XLF is a concentrated bet on a handful of giants: roughly a quarter of its assets sit in just two names, JPMorgan Chase and Berkshire Hathaway, and the top 10 holdings account for more than half of the fund.[3] That concentration means single-stock moves in those bellwethers can dominate the ETF’s day-to-day behavior even when the broader sector is quiet.
Sector specialists also point to XLF’s role as a pure-play financials vehicle, with exposure overwhelmingly tied to banks, insurers, asset managers and exchanges rather than diversified “financial-like” businesses.[2] In May 2026, Zacks highlighted that focus as a way for investors to express a view on the rate and credit cycle without mixing in unrelated sectors.[2] In February 2026, Yahoo Finance flagged how that same structure can amplify both upside and downside when macro narratives around rates, regulation or credit quality shift quickly.[3]
The chart below situates the latest move in its recent multi-month context alongside the historical 60-day seasonal projection.
What should traders watch as the Oct 20 seasonal window approaches?
First, the calendar. The Oct 20 start date lands as the midterm election year is wrapping up and markets pivot toward the pre-election year, a phase that has historically been friendlier to risk assets and to financials in particular. How XLF behaves into that date will shape whether the ETF enters the window from a position of strength near its 52-week high or from a pullback closer to its 50-day moving average.
Second, the policy and rate backdrop. Any shift in expectations for the pace of rate cuts, changes in regulatory tone, or signs of credit stress could either reinforce or fight the historical seasonal tailwind. Traders will be watching large-bank earnings calls and macro data on inflation and growth for clues about net interest margins and loan demand, both of which feed directly into XLF’s earnings sensitivity.[3]
Third, the intraperiod volatility profile. The historical MAE and MFE pattern shows that even in winning years XLF has often swung sharply within the window, with some cycles seeing mid-teens drawdowns before recovering to finish higher. If the ETF again experiences deep but temporary pullbacks after Oct 20, that would rhyme with the past six midterm-year windows; a smooth, low-volatility grind higher would mark a departure from the usual script.
Finally, concentration risk. Because XLF’s top holdings carry outsized weight, traders should monitor how JPMorgan, Berkshire and other heavyweights trade around earnings, capital-return announcements and regulatory headlines.[2][3] Strong leadership from those names into and through the Oct 20 to Jul 2 window would align with the bullish historical seasonality, while persistent weakness or idiosyncratic shocks at the top of the portfolio could blunt or even override the pattern.
Sources
- GuruFocus.com - State Street Financial Select Sector SPDR ETF (XLF) Stock Price, Holdings, Dividend Yield - GuruFocus.com
- Zacks.com - Should You Invest in the State Street Financial Select Sector SPDR ETF (XLF)? - May 20, 2026 - Zacks.com
- Yahoo Finance - The XLF Financial Sector ETF Puts 25% of Your Money in Just Two Stocks
- Barchart.com - When the AI Trade Collapses, These 3 S&P 500 Sectors Are Your Best Bet
About this seasonal analysis
Seasonal pattern data is sourced from TradeWave.ai, which analyzes historical price behavior across annual calendar windows going back up to 30 years. Read the full data methodology or the book The 100-Year Pattern by Afshin Moshrefi (2026 edition). Past performance of seasonal patterns does not guarantee future results. This article is for informational purposes only and does not constitute investment advice.