Six-for-six midterm streak: Nasdaq QQQ Invesco ETF (QQQ) Averages 17.42% Gains in This 196-Day Run
Nasdaq QQQ Invesco ETF is wrapping up the midterm election year with a historically powerful 196-day window that has never posted a loss in this phase, even as options-driven swings keep tech traders on edge.

What is the seasonal pattern for Nasdaq QQQ Invesco ETF (QQQ)?
Nasdaq QQQ Invesco ETF has risen in 6 of 6 midterm-election-year Oct 11–Apr 24 windows, with an average gain of 17.42% in winning years.
- 6 for 6 in this window, averaging 17.42% gains in winning years across the last six midterm election cycles.
- Seasonal window runs from Oct 11 through Apr 24, spanning 196 calendar days in the late part of the midterm election year into the following spring.
- Percent Profitable is 100.0%, with 6 winners and 0 losers in the historical sample.
- Median profit of 18.77% shows that typical outcomes have been solidly double-digit, not just skewed by one outlier year.
- TradeWave Ratio of 2.16 and a Sharpe ratio of 2.97 point to strong upside travel in the trade direction with favorable risk-adjusted returns.
- Intraperiod drawdowns have still been meaningful in some years, including a worst-case adverse move of -15.17% in 2018 before the window finished higher.
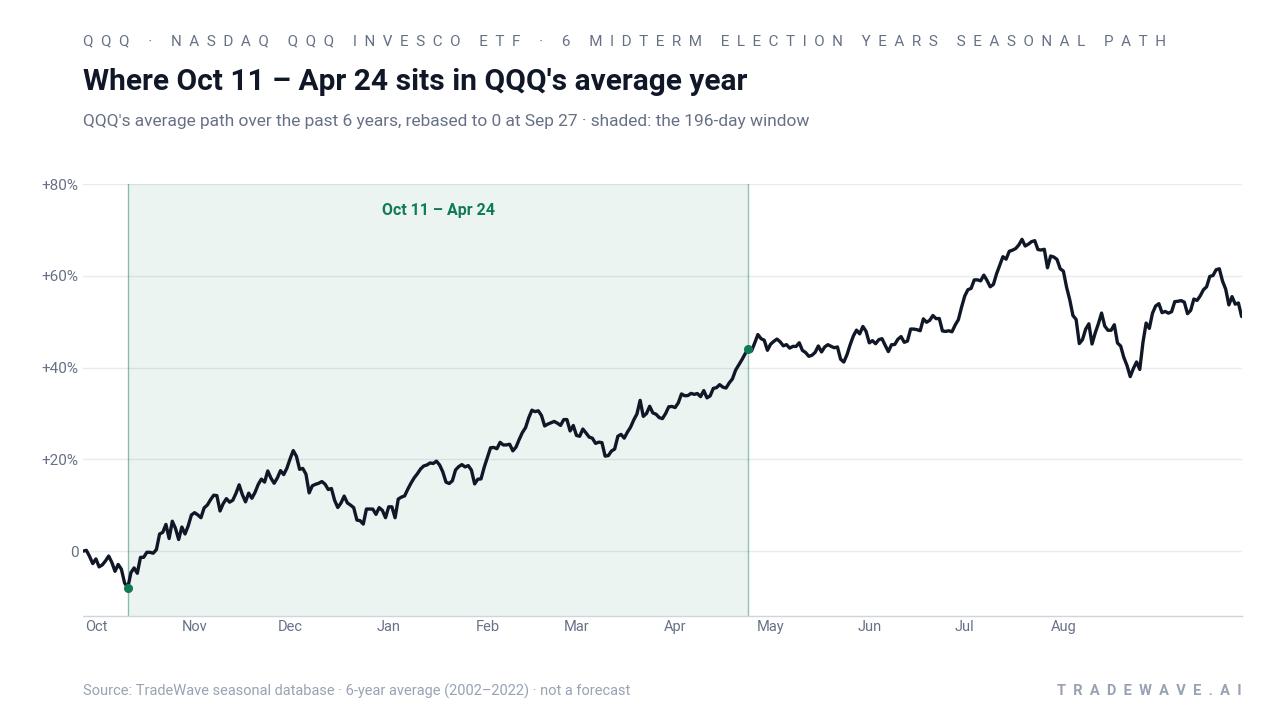
According to historical data from TradeWave.ai, this late midterm-election stretch has behaved very differently from an average six-month span for QQQ, with a distinct pattern that most traders never see on a standard chart.
How has Nasdaq QQQ Invesco ETF (QQQ) traded in the Oct 11–Apr 24 window?
Nasdaq QQQ Invesco ETF has finished higher in every single Oct 11–Apr 24 window across the last six midterm election years, averaging 17.42% gains with no losing cycles. The current quote context is elevated after a long tech-led run, leaving QQQ closer to its 52-week high of 747.00 than its 52-week low of 554.38 even after recent consolidation. That combination of a strong historical seasonal trend and a stretched long-term range makes this upcoming 196-day window one of the more closely watched QQQ seasonal regimes on the calendar.
Because this pattern is grouped by the presidential election cycle, it captures only midterm election years, not a random mix of decades. That matters for QQQ, which tracks the Nasdaq-100 and tends to be highly sensitive to policy, regulation and liquidity shifts that cluster around the middle of a presidential term when Washington often pivots from early-term agenda fights toward positioning for the next campaign.[3]
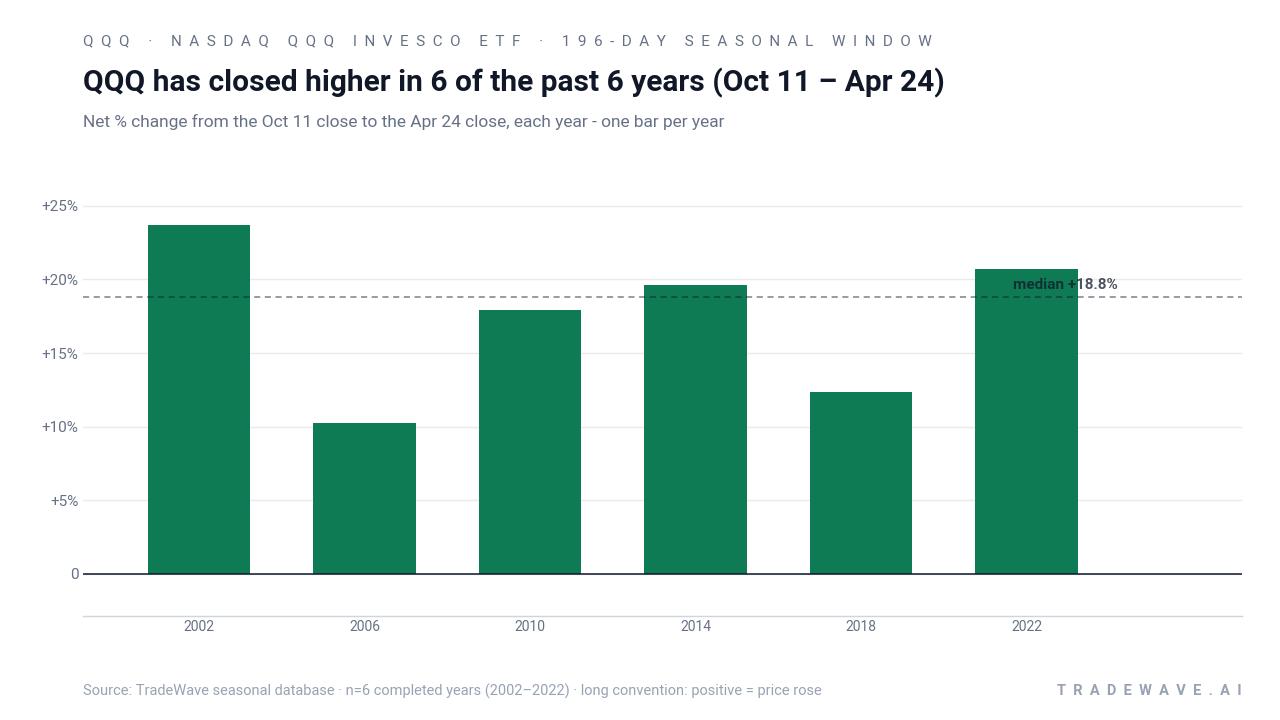
Across the six completed midterm-election-year samples from 2002 through 2022, every Oct 11–Apr 24 stretch produced a positive net return for a long QQQ position. The strongest year in this pattern was 2022, when QQQ gained 20.72% over the window, while the softest was 2006 with a still-positive 10.22% move. The median outcome of 18.77% shows that the typical result has been closer to the high end of that range than the low end, which is unusual for a broad equity ETF over roughly six months.
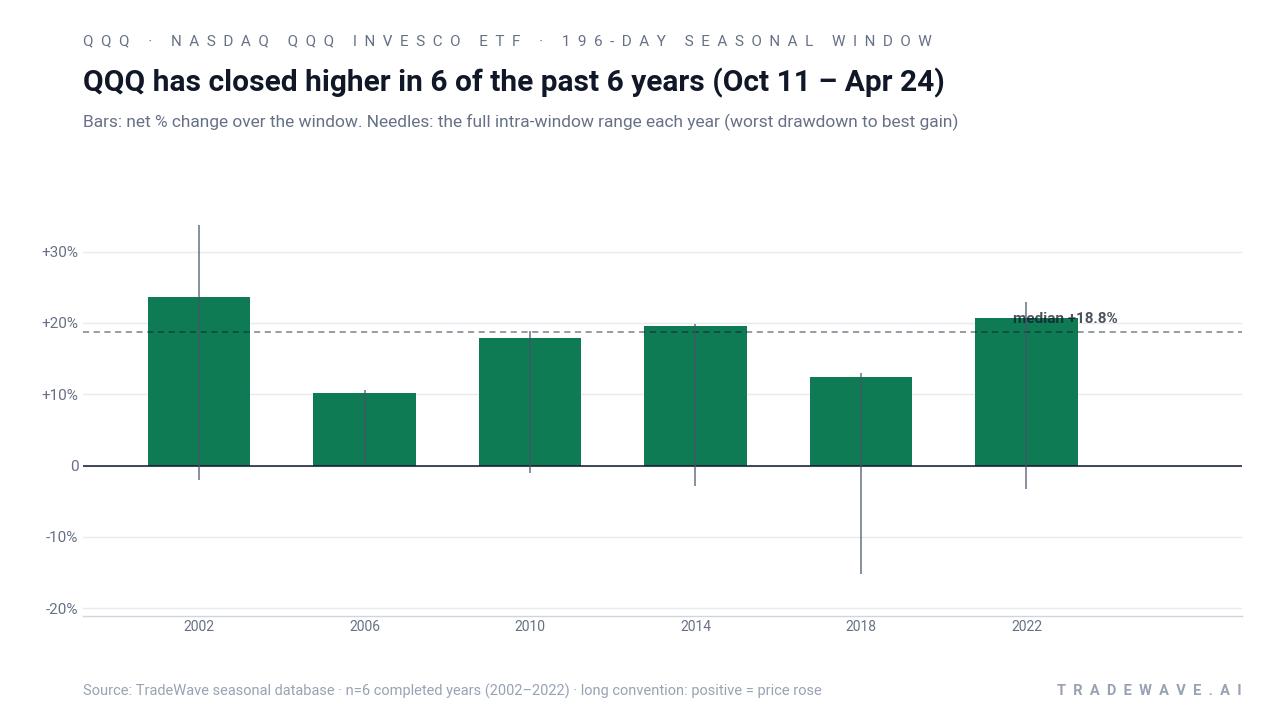
Intraperiod swings have not been one-way. The maximum favorable move, or best point-to-peak run-up within the window, reached as high as 33.66% in 2002 and 22.89% in 2022, showing that in strong years QQQ has often overshot the final close before giving some gains back. On the downside, the maximum adverse move, or worst drawdown from the entry, has ranged from essentially flat in 2006 to a sharp -15.17% in 2018, when QQQ suffered a deep pullback before recovering to finish the window up 12.38%. That profile fits a “grind higher with occasional air pockets” description rather than a smooth climb.
Year-by-year ranges show how much QQQ has typically traveled both up and down inside this window.
The cumulative chart for this pattern compounds those six midterm-election-year windows into a 160.87% total gain, which is what you would have earned by holding QQQ only during this 196-day slice each cycle and sitting out the rest of the time. Add it up: six seasonal windows, all winners, and a cumulative return that rivals a full-cycle buy-and-hold strategy. History does not guarantee a repeat, but the consistency across two decades of midterm years is hard to ignore.
History does not guarantee future results, and even in this strong window QQQ has seen double-digit adverse moves within the period before recovering.
Why does Nasdaq QQQ Invesco ETF (QQQ) follow this seasonal pattern?
One likely driver is the way the tech-heavy Nasdaq-100 reacts to the policy and liquidity backdrop that often improves from late in the midterm election year into the following spring, as Washington gridlock firms up and the Federal Reserve’s path is clearer.[3] Analysts have also pointed to institutional portfolio rebalancing and year-end tax planning, which can push money back into growth and technology after earlier midterm-year volatility. This Oct-to-Apr window may also reflect the clustering of big-cap tech earnings and product cycles, which tend to front-load good news into the winter and early spring.
What is driving Nasdaq QQQ Invesco ETF (QQQ) today?
QQQ is trading near the upper end of its 52-week range between 554.38 and 747.00, reflecting a powerful tech-led advance that has left the ETF heavily owned across both retail and institutional portfolios.[3] Options market structure has become a key short-term driver: in mid-August, QQQ “gamma flipped” near the 725 level, putting market makers in a negative gamma regime where they tend to sell into declines and buy into rallies, amplifying intraday swings around key strikes.[1] At the same time, QQQ’s role as the flagship Nasdaq-100 tracker means it sits at the center of a web of overlapping products, from lower-fee clones to index options, which can concentrate flows and make any volatility episode in QQQ ripple quickly across broader equity ETFs.[3]
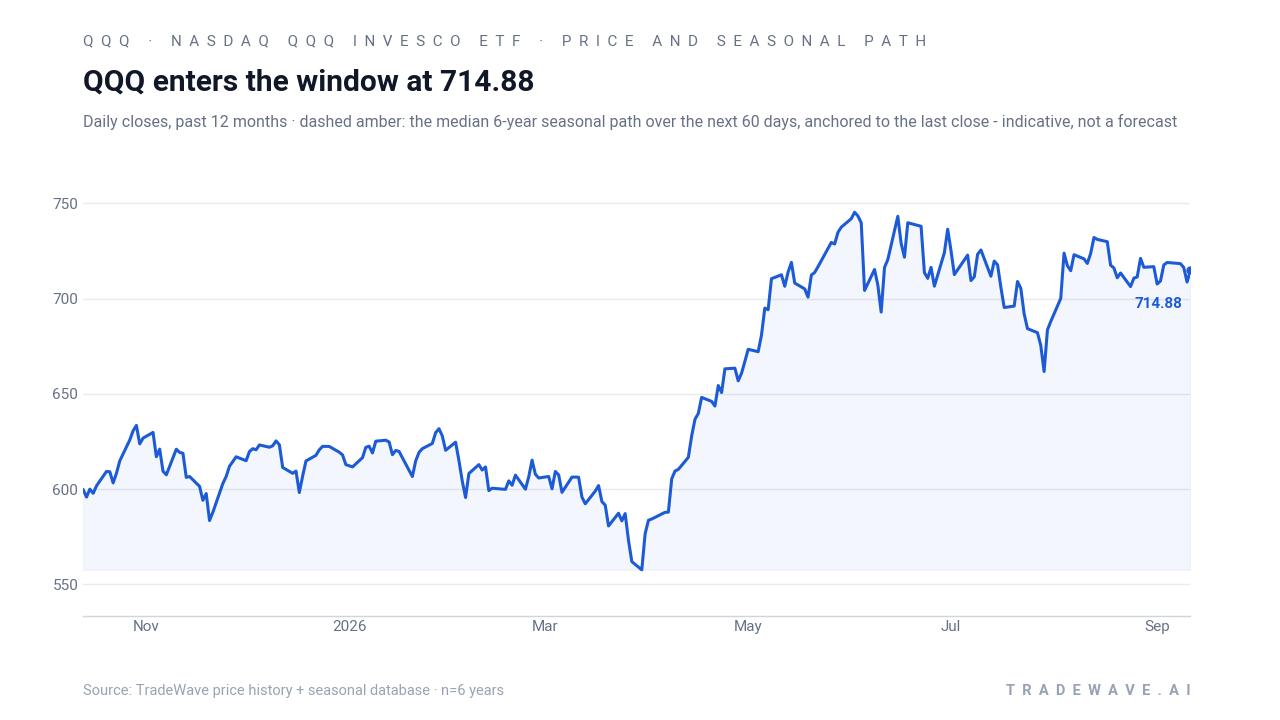
The chart below shows QQQ’s past year of trading alongside a 60-day seasonal projection based on prior midterm-election-year behavior.
Macro stories around QQQ extend beyond pure price action. In July 2026, discussion of a potential SpaceX IPO and its inclusion in the Nasdaq-100 raised questions about how a large, volatile private-company listing could affect QQQ’s risk profile and sector mix, especially if it lands among the ETF’s top holdings.[2] Another theme is concentration: research has highlighted that many of QQQ’s biggest positions also dominate broad-market funds like VTI, leaving investors who own both with more tech exposure than they might realize and tying QQQ’s fate even more tightly to a handful of mega-cap names.[2] Against that backdrop, the historically strong Oct 11–Apr 24 seasonal window arrives just as policy, liquidity and product-structure stories converge on the same tech-heavy corner of the market.
Sources
- Yahoo Finance (Barchart content) - QQQ Just 'Gamma Flipped' as Market Makers Were Forced to Sell. Here’s What Our Top Chart Expert is Tracking Next.
- Yahoo Finance - With the SpaceX IPO Reshaping the Nasdaq, Is QQQ Still a Smart Investment Right Now?
- Nasdaq - Preferences Revealed: How Investors Are Choosing Nasdaq-100 Index® Options (NDX®) for Exposure and Risk Management
About this seasonal analysis
Seasonal pattern data is sourced from TradeWave.ai, which analyzes historical price behavior across annual calendar windows going back up to 30 years. Read the full data methodology or the book The 100-Year Pattern by Afshin Moshrefi (2026 edition). Past performance of seasonal patterns does not guarantee future results. This article is for informational purposes only and does not constitute investment advice.