6-for-6 Midterm Streak: S&P 500 Financials Sector SPDR (XLF) Averages 8.78% Gains Oct-Apr
S&P 500 Financials Sector SPDR is nearing a historically strong Oct 12 to Apr 26 trading window, with the ETF hovering just below its 52-week high as investors weigh the next move in rates.

What is the seasonal pattern for S&P 500 Financials Sector SPDR (XLF)?
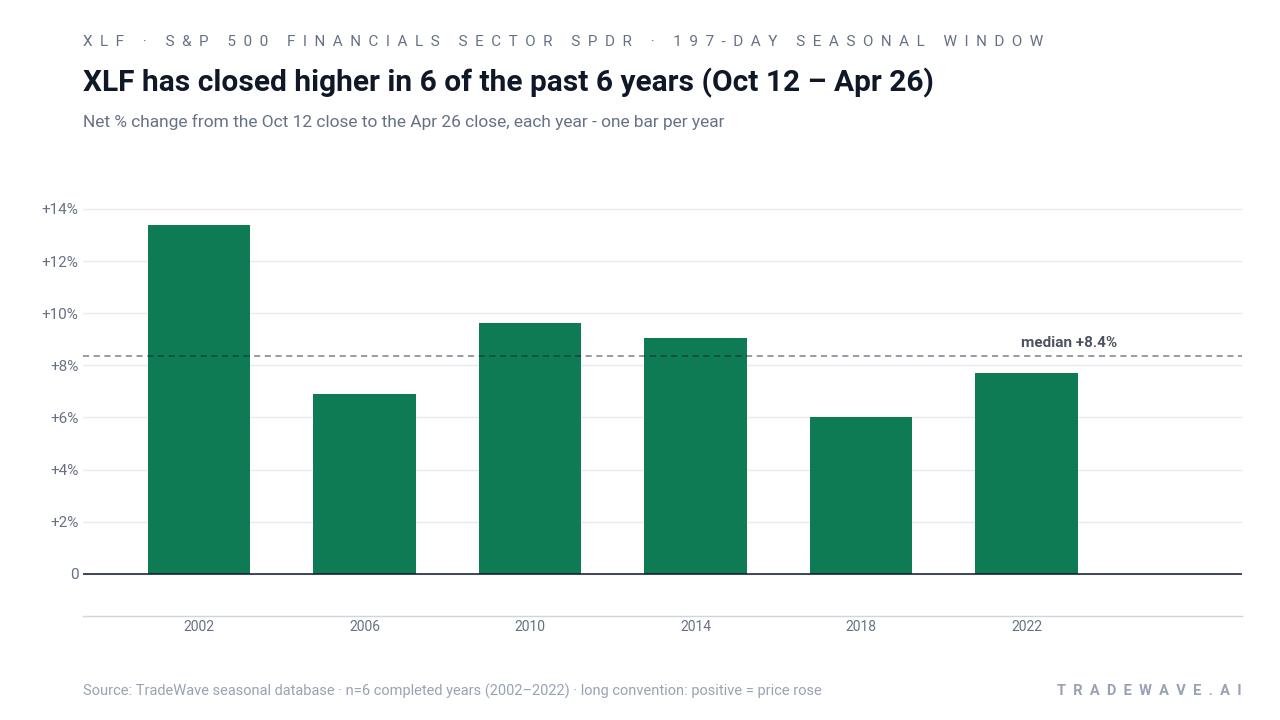
S&P 500 Financials Sector SPDR has risen in 6 of 6 midterm-year Oct 12 to Apr 26 windows, with an average gain of 8.78% in winning years.
- 6 for 6 in this window, with XLF averaging 8.78% gains in winning years across the last six midterm election cycles.
- The upcoming seasonal window starts Oct 12 and runs 197 days through Apr 26, covering the handoff from the midterm election year into the pre-election year.
- Percent Profitable is 100%, with 6 winners and 0 losers in the historical sample.
- Annualized return across these windows is 8.75%, with a cumulative gain of 65% when the pattern is stacked over all six years.
- The strongest year in the sample saw a 13.37% net gain, while the weakest still finished up 6.0%, underscoring a tight cluster of positive outcomes.
- Intraperiod swings have been meaningful, with some years experiencing double-digit drawdowns before finishing higher, so the ride has not been smooth even in a bullish seasonal trend.
According to historical data from TradeWave.ai, this midterm-year stretch for financials has behaved very differently from an average six-month span. The next section walks through how that pattern has played out for XLF in prior cycles.
How has S&P 500 Financials Sector SPDR (XLF) traded in the Oct 12 to Apr 26 window?
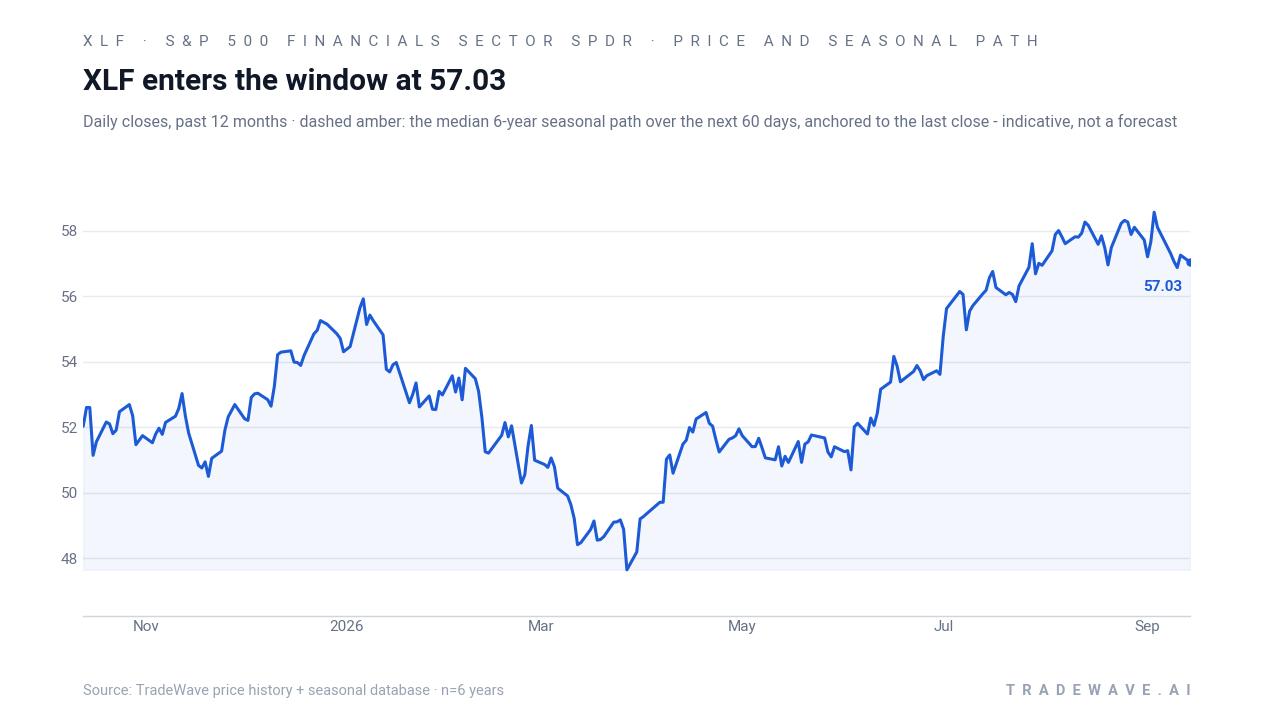
The Oct 12 to Apr 26 window has been quietly powerful for S&P 500 Financials Sector SPDR in midterm election years, delivering gains in every one of the last six cycles and compounding to a 65% cumulative return. XLF last traded at 57.25, up 0.67% on the day and about 2.3% below its 52-week high of 58.60, leaving it near the top of its recent range as this historically strong stretch approaches.
Grouping the data by the presidential election cycle matters here because this window always straddles the end of a midterm election year and the start of the pre-election year, a phase that has often coincided with shifting policy expectations and sector rotation. For financials, that means the pattern is capturing how banks and insurers have historically traded as Washington moves from midterm gridlock toward a more stimulus-friendly pre-election stance.
Across the six completed midterm-year windows since 2002, the trade direction has been long, and every single iteration finished positive. The average gain of 8.78% sits close to the median profit of 8.38%, which tells you the outcomes have clustered rather than being skewed by one outlier year. Annualized, that works out to an 8.75% return for this specific 197-day slice of the calendar, with a Sharpe ratio of 2.53 that signals unusually strong risk-adjusted performance for a sector ETF.
The per-year breakdown shows how consistent that XLF seasonal trend has been. The strongest year in the sample was 2002, when the ETF gained 13.37% between the Oct 12 entry and the Apr 26 exit. The softest outcome was 2018, which still delivered a 6.0% net gain despite a volatile backdrop for global risk assets. Add it up and stacking those six windows compounds to a 65% cumulative return, even though they are spread across very different macro regimes.
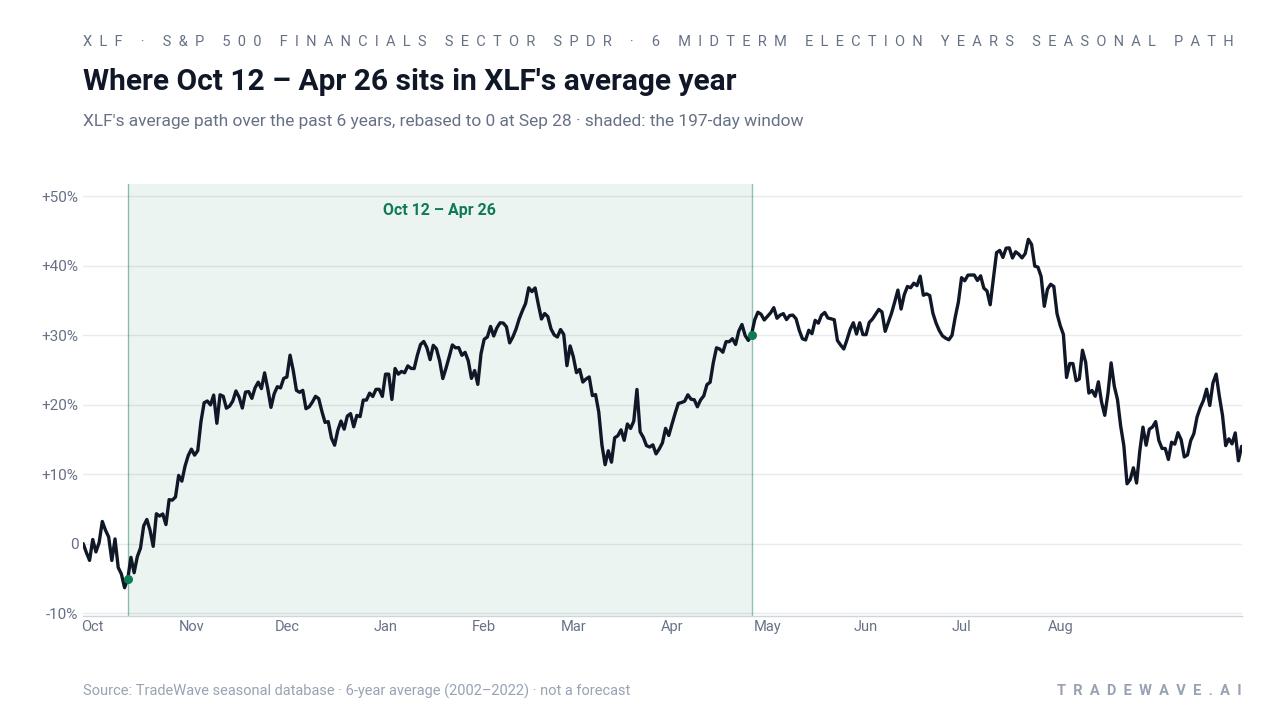
A second view looks at how far XLF has typically swung inside the window before settling at its final result.
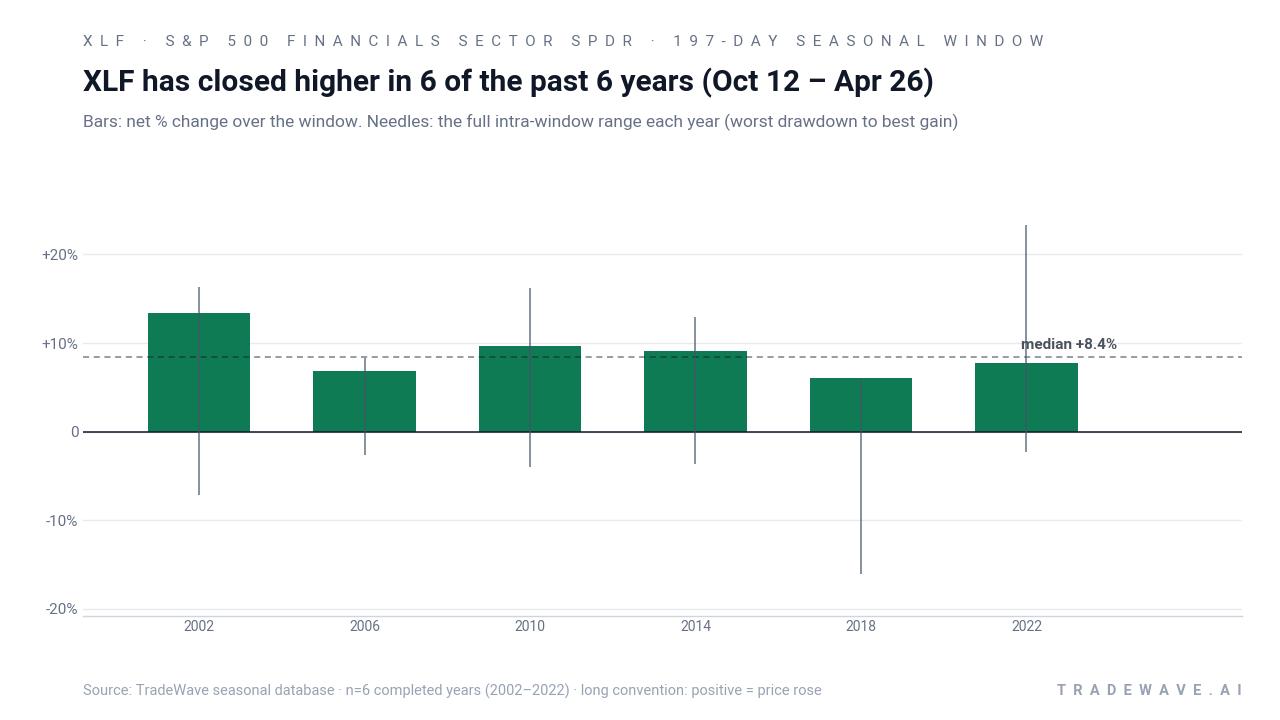
The intraperiod profile is where the risk shows up. Maximum favorable moves have been large in several years, with XLF’s best point-to-peak rally inside the window reaching 23.28% in 2022, while the worst drawdowns have at times been sharp, including a 16.05% slide at one point in 2018 before the ETF recovered. That combination of sizable maximum favorable excursion and meaningful maximum adverse excursion means the window has historically rewarded patience but has not been a straight line.
Put simply, the pattern is clear: in the last six midterm election years, this Oct 12 to Apr 26 window has favored long exposure in XLF every single time, with solid average gains but enough volatility inside the range to test conviction.
Why does S&P 500 Financials Sector SPDR (XLF) follow this seasonal pattern?
One likely driver is the way the earnings calendar and policy cycle line up for big banks and insurers, with Q4 and Q1 results often resetting expectations on credit quality, loan growth, and capital returns. Analysts have also pointed to institutional portfolio rebalancing and sector rotation around year-end, when investors shift between growth-heavy trades and more cyclical or value-oriented sectors like financials.[1] In midterm election years specifically, this pattern may reflect markets pricing in a more supportive or predictable policy backdrop as the calendar turns toward the pre-election year, which has historically been friendlier to risk assets.
History does not guarantee future results; adverse excursions (MAE) can be large even in winning windows.
What is driving S&P 500 Financials Sector SPDR (XLF) today?
XLF’s latest move leaves it trading at 57.25, up 0.67% on the session and roughly 2.3% below its 52-week high of 58.60, with the ETF also sitting just above its 50-day moving average of 57.14. The fund remains heavily tilted toward large U.S. financial institutions, with roughly $58 billion in assets, a 1.40% dividend yield, and a low 0.08% expense ratio that has helped cement it as the default megabank proxy for many investors.[3]
Macro drivers are still dominated by the interest-rate and inflation backdrop. Elevated net interest margins have supported bank earnings, but sticky short-term rates and commercial real estate exposure remain key headwinds, leaving financials sensitive to any shift in the Federal Reserve’s path. A June 2026 Barchart column argued that if the AI trade cools and rates drift lower, financials via XLF could benefit as loan performance improves and investors rotate toward more defensive, cash-generating sectors.[1]
Positioning data is thin, but short-interest tracking sites continue to monitor XLF as a liquid way to express sector-level views. A late-August 2026 Fintel update highlighted the ETF within its short-interest scoring framework, underscoring that traders are using the fund both for hedging and for directional bets on the financials complex.[2]
The chart below situates the latest move in its recent multi-month context alongside the median seasonal path.
What should traders watch as the XLF seasonal window approaches?
First, the calendar. The 197-day XLF seasonal window tied to the last six midterm election years begins on Oct 12 and runs through Apr 26, overlapping the transition from the concluding midterm election year into the pre-election year. Historically, that has been a constructive phase for financials in this specific window, with 6 winners and 0 losers and average gains near 9%.
Second, the policy and data backdrop. Watch upcoming inflation prints, Fed communications, and any signs of stress in commercial real estate, since lower-rate expectations and stable credit quality have historically been supportive for the sector.[1] If the market starts to price a gentler rate path into year-end, that would align with the bullish XLF seasonal trend; a renewed backup in yields or fresh credit concerns would cut the other way.
Third, price levels. On the upside, traders will be watching whether XLF can retest and break above the 52-week high near 58.60 as the window opens, while the 50-day moving average around 57.14 and the 52-week low near 47.34 mark key downside reference points. Behavior around those levels in the first weeks of the window will help confirm whether this cycle is tracking the historical pattern or diverging from it.
Finally, positioning and sentiment. Short-interest and ETF flow data around XLF will be important tells: if hedging demand fades and flows turn positive into the window, that would echo prior midterm-year cycles where financials climbed steadily off autumn bases.[2] If instead shorts build and flows stay cautious even as the seasonal window opens, traders will know this iteration is facing a tougher macro tape than the historical average.
Sources
About this seasonal analysis
Seasonal pattern data is sourced from TradeWave.ai, which analyzes historical price behavior across annual calendar windows going back up to 30 years. Read the full data methodology or the book The 100-Year Pattern by Afshin Moshrefi (2026 edition). Past performance of seasonal patterns does not guarantee future results. This article is for informational purposes only and does not constitute investment advice.