S&P 500 Technology Sector SPDR (XLK) Has Rallied in 6 of 6 Midterm Oct-May Windows
S&P 500 Technology Sector SPDR is heading toward a historically strong 191-day midterm-year seasonal window just as tech momentum and AI spending reshape the sector’s outlook.

What is the seasonal pattern for S&P 500 Technology Sector SPDR (XLK)?
S&P 500 Technology Sector SPDR has risen in 6 of 6 midterm-election-year Oct 25–May 3 windows, with an average gain of 12.02% in winning years.
- 6 for 6 in this window, with XLK posting gains every time and averaging 12.02% per cycle.
- The upcoming seasonal window runs from Oct 25, 2026 through May 3, 2027, spanning 191 calendar days in the midterm-to-pre-election transition.
- Percent Profitable is 100.0%, with 6 winners and 0 losers across the last six midterm election years.
- Average profit of 12.02% in winning years stacks to a 97.28% cumulative gain when the window is repeated across all six cycles.
- The TradeWave Ratio of 2.66 signals that price has typically traveled meaningfully in the long direction within the window, while the Sharpe ratio of 3.87 points to unusually strong risk-adjusted returns.
- Intraperiod swings have been real, with some years showing double-digit drawdowns before finishing higher, so the ride has not been smooth even in a perfect win record.
According to historical data from TradeWave.ai, this specific Oct 25 to May 3 stretch in midterm election years has behaved very differently from an average tech-market season, and the next iteration is now on the calendar.
How has S&P 500 Technology Sector SPDR (XLK) traded in this Oct–May window?
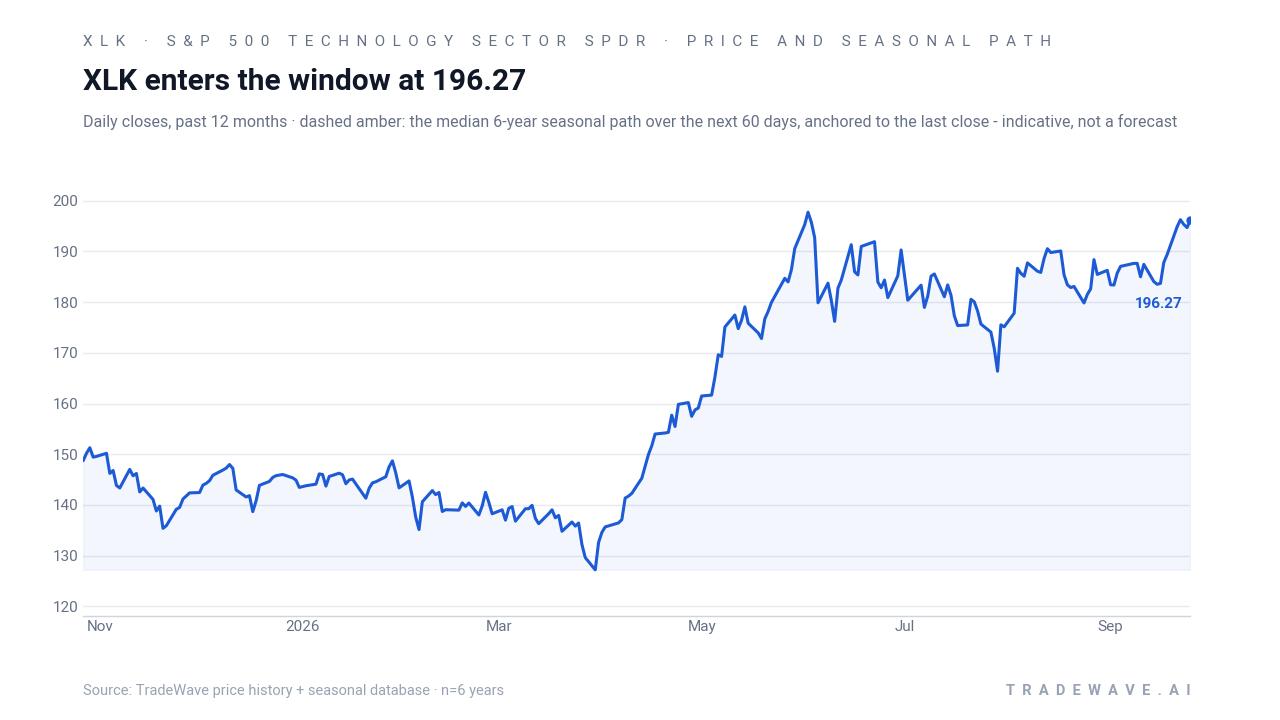
S&P 500 Technology Sector SPDR has booked gains in every single Oct 25 to May 3 midterm-year window across the last six cycles, averaging 12.02% per run. The ETF most recently entered this regime at 196.27, with the next 191-day stretch set to begin on Oct 25, 2026 and carry into early May 2027. That combination of a clean win streak, double-digit average gains and a long window makes this one of the more striking XLK seasonal trends on the calendar.
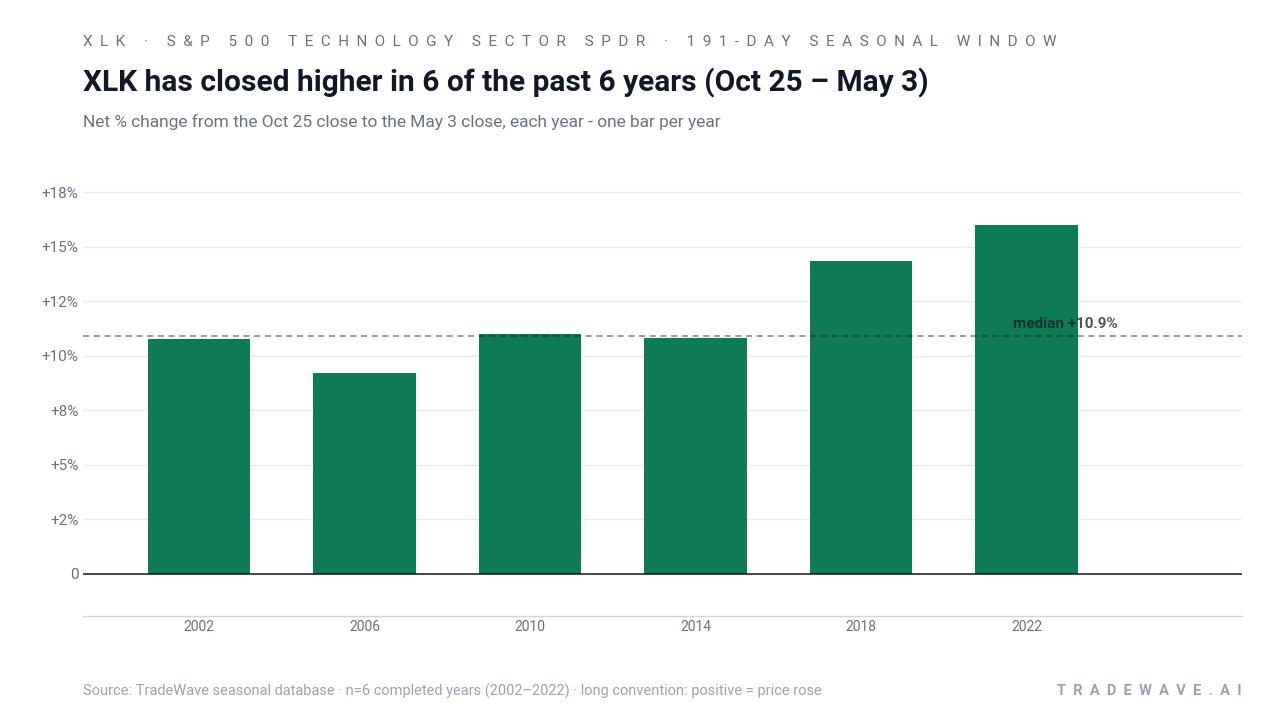
Because this pattern is grouped by the presidential election cycle, it only looks at midterm election years, then tracks XLK from late October of that year into early May of the following pre-election year. That matters for tech because policy risk, regulation and fiscal stance tend to shift meaningfully between the midterm and the year before the presidential election, often changing how investors treat growth and AI-heavy sectors.
Across the six completed midterm-year samples since 2002, the trade direction for this window is firmly long. Percent Profitable sits at 100.0%, with 6 winners and 0 losers, and the average profit of 12.02% lines up closely with the 10.9% median, which suggests the wins have been relatively clustered rather than driven by a single outlier year. The cumulative return from stacking this same 191-day window across all six cycles reaches 97.28%, effectively doubling capital if the pattern were repeated without interruption.
The per-year breakdown shows how that plays out in practice. The weakest outcome in the sample was a still-solid 9.21% gain in 2006, while the strongest was a 15.98% rise in 2022. In between, years like 2010 and 2014 delivered around 11% gains, and 2018 printed a 14.33% advance despite a rough patch inside the window. For a broad tech ETF, that is a tight cluster of double-digit wins across very different macro backdrops.
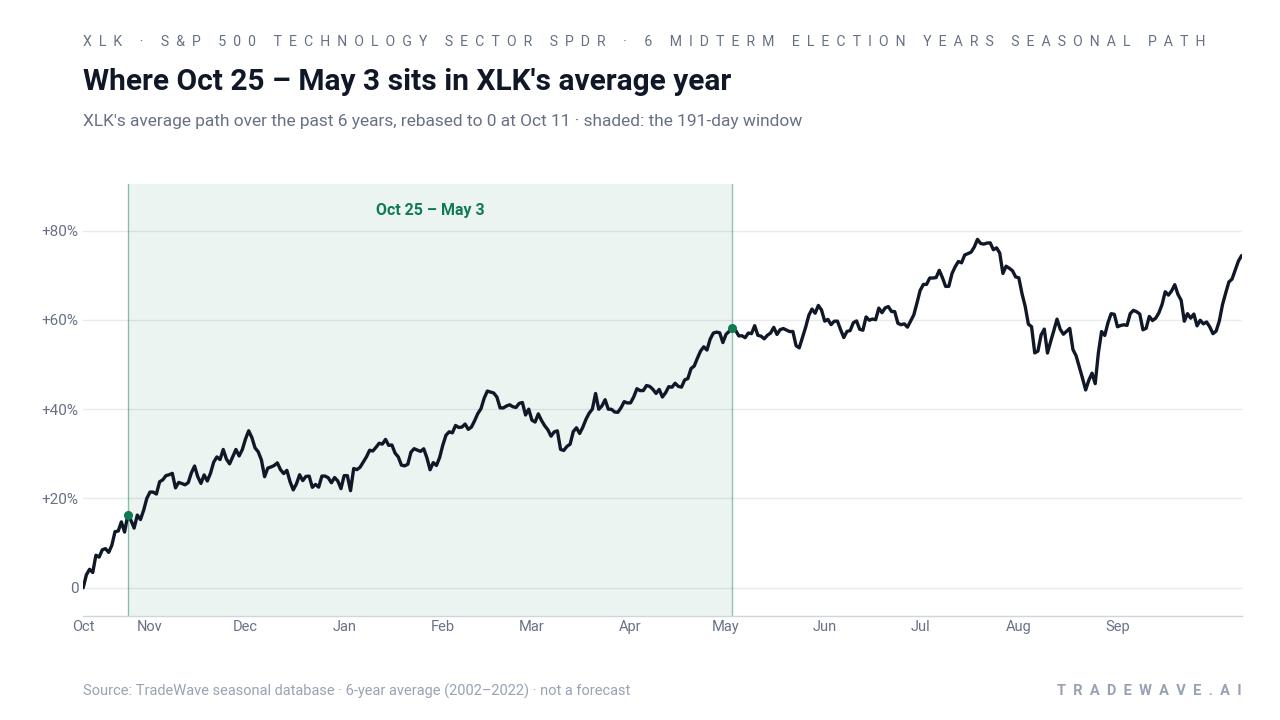
Year-by-year ranges highlight how much XLK has typically swung inside the window before locking in those gains.
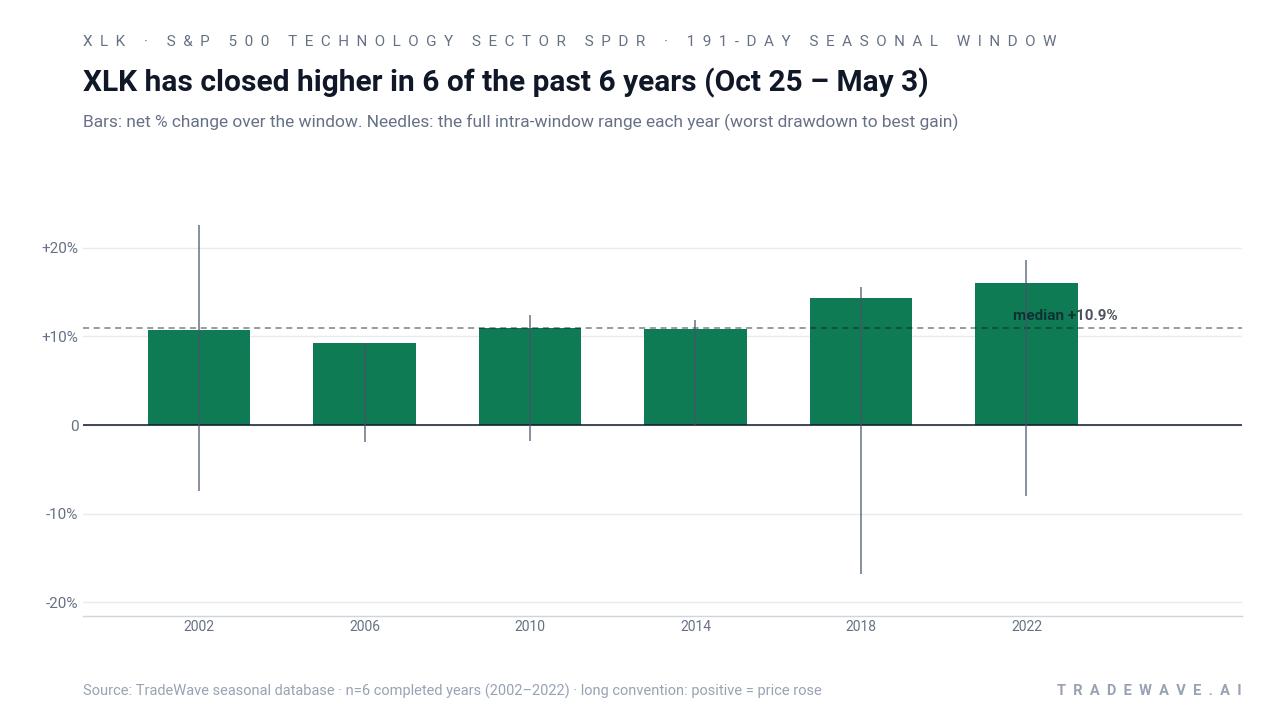
Intraperiod volatility is the catch. Maximum favorable excursions, the best point-to-peak moves within each window, have run as high as 22.51% in 2002 and 18.64% in 2022, showing that XLK has often overshot the final gain before settling back. On the downside, maximum adverse excursions have reached as deep as a 16.78% drawdown in 2018 and around 7% to 8% in 2002 and 2022, underscoring that even winning seasons have included sharp pullbacks.
The TradeWave Ratio of 2.66 captures that tendency for XLK to travel a meaningful distance in the trade direction during the window, while the Sharpe ratio of 3.87 indicates that, based on end-of-window outcomes, the reward per unit of volatility has been unusually strong. Put differently, the swings have been real, but the closing bell has historically favored longs in this midterm-year slice of the calendar.
Layered on top of that, the 191-day window sits inside the broader midterm-to-pre-election regime that has often been supportive for U.S. equities. For a tech-heavy ETF like XLK, that has meant a backdrop where policy uncertainty from the midterm fades, fiscal and regulatory signals for the next administration start to clarify, and investors have historically been more willing to pay up for growth and AI exposure.
Stack it all together and the message is simple: six for six, double-digit average gains, and a long window that has repeatedly rewarded long exposure, albeit with drawdowns that can sting along the way.
History does not guarantee future results; adverse excursions (MAE) can be large even in winning windows.
Why does S&P 500 Technology Sector SPDR (XLK) follow this seasonal pattern?
One likely driver is the way the tech earnings calendar and guidance cycle line up with the midterm-to-pre-election transition, with many large-cap names updating AI and cloud spending plans between late October and early spring. Analysts have also pointed to institutional portfolio rebalancing and sector rotation, as investors shift toward growth and technology once midterm political risk clears and the policy path into the presidential election year becomes more visible. This XLK seasonal pattern may reflect that combination of improving earnings visibility, renewed risk appetite and a policy backdrop that has historically been friendlier to high-beta tech exposure in this phase of the cycle.
What is driving S&P 500 Technology Sector SPDR (XLK) today?
XLK comes into this late-September setup after a strong run, with the ETF recently trading near the upper end of its 12-month range and posting a 4.3% gain over the past month. Coverage earlier in 2026 highlighted a rebound in technology names powered by heavy AI investment and solid corporate earnings, which helped push XLK to a new 52-week high in May and reinforced a bullish technical backdrop for the fund.[2] Sector commentary has also emphasized renewed appetite for chips, AI infrastructure and software, all of which sit at the core of XLK’s portfolio.[1]
Beyond price action, one structural tailwind has been insider behavior at XLK’s underlying companies. Reporting in 2026 pointed to a record number of tech insiders buying shares in their own firms, a signal of executive confidence that has often coincided with stronger sector performance in past cycles.[1] Combined with a “Buy” consensus rating from ETF analysts at Zacks, that backdrop has kept XLK in focus for investors looking for broad-based exposure to the technology trade.[2]
The chart below situates the latest move in its recent multi-month context and overlays the median seasonal path for the next 60 days.
What should traders watch as XLK approaches this seasonal window?
First, the calendar. The next iteration of this 191-day window begins on Oct 25, 2026, so the coming weeks are about positioning rather than immediate seasonality. How XLK behaves into that start date will shape how investors interpret any early drawdowns or rallies once the window opens.
Second, the policy and macro backdrop. This stretch closes out the midterm election year and runs deep into the year before the presidential election, a phase that has often featured clearer fiscal and regulatory signals for Big Tech. Any shifts in AI-related regulation, antitrust enforcement or tax policy could either reinforce or blunt the historical seasonal tailwind for XLK.
Third, sector-level catalysts. Earnings updates from mega-cap constituents, guidance on AI and cloud capex, and any signs of slowing demand in chips or software will matter more than usual given the ETF’s historical tendency to trend during this window.[1][2] Traders will be watching whether strong reports cluster early in the window, as they have in several past cycles, or whether macro headwinds delay the typical pattern.
Finally, insider and positioning signals. If the 2026 wave of insider buying across XLK’s underlying companies continues or accelerates into the window, that would echo the confidence backdrop seen earlier in the year and could support the historical bullish bias.[1] A reversal in insider activity, or a sharp cooling in tech ETF flows, would be an early sign that this cycle might diverge from the six-for-six record, especially given the sizable intraperiod drawdowns that have accompanied prior wins.
Sources
About this seasonal analysis
Seasonal pattern data is sourced from TradeWave.ai, which analyzes historical price behavior across annual calendar windows going back up to 30 years. Read the full data methodology or the book The 100-Year Pattern by Afshin Moshrefi (2026 edition). Past performance of seasonal patterns does not guarantee future results. This article is for informational purposes only and does not constitute investment advice.