S&P 500 Financials Sector SPDR (XLF) Has Risen in 6 of 6 Midterm Oct-Jul Windows
S&P 500 Financials Sector SPDR is heading toward a historically strong Oct 20 to Jul 2 trading window, even as the ETF sits about 4.7% below its 52-week high and financials digest a choppy year.

What is the seasonal pattern for S&P 500 Financials Sector SPDR (XLF)?
S&P 500 Financials Sector SPDR has risen in 6 of 6 midterm-year Oct 20 to Jul 2 windows, with an average gain of 9.06% in winning years.
- 6 for 6 in this window, with XLF averaging 9.06% gains across all completed midterm-year cycles.
- Seasonal direction is long for the 256-day stretch starting Oct 20 and running through Jul 2.
- Percent Profitable is 100.0%, with 6 winners and 0 losers in the historical sample.
- Annualized return across these windows is 9.04%, with a Sharpe ratio of 2.62 based on end-of-window outcomes.
- The TradeWave Ratio of 2.76 suggests price has typically traveled meaningfully in the long direction within the window, not just at the close.
- Individual years have seen sizable intraperiod swings, including adverse moves near 15% in some cycles, even though every window finished higher.
According to historical data from TradeWave.ai, this midterm-year stretch has behaved very differently from an average calendar year for financials. The next section walks through what that pattern has looked like for XLF across prior cycles.
How has S&P 500 Financials Sector SPDR (XLF) traded in the Oct 20 to Jul 2 window?
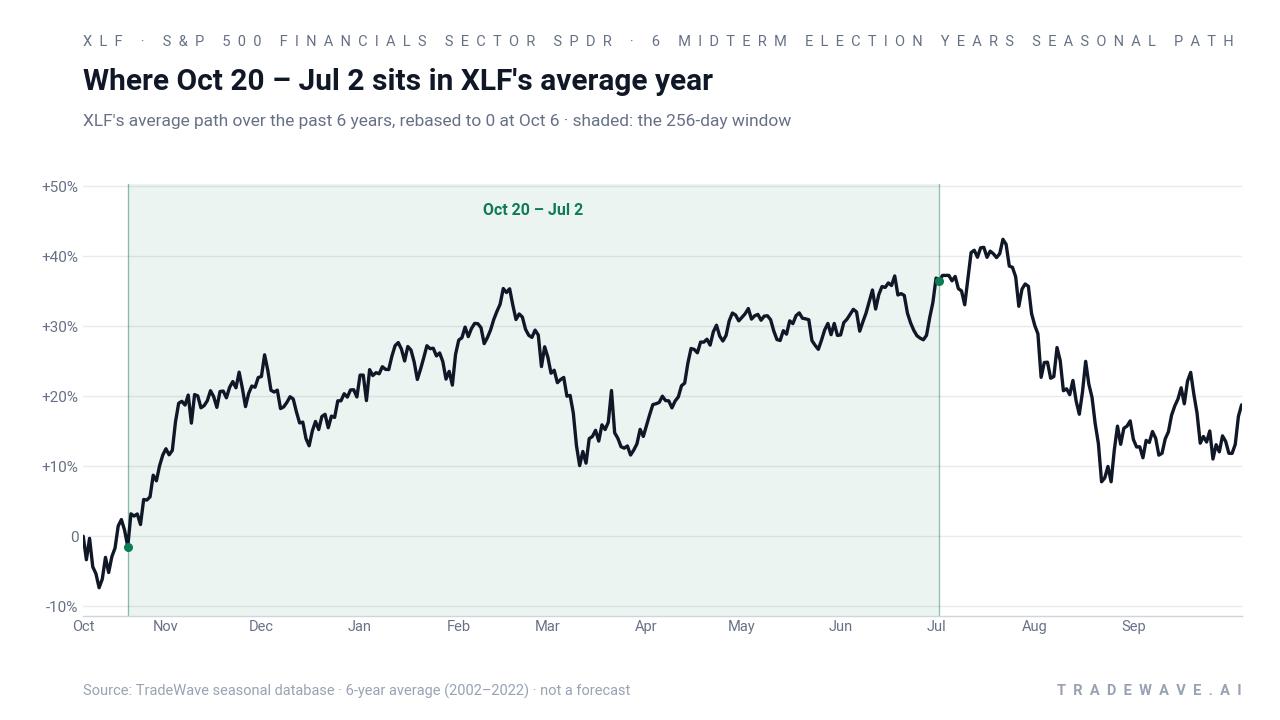
Grouping by the presidential election cycle, this pattern looks at the last 6 midterm election years and how financials behaved from Oct 20 into the following summer. S&P 500 Financials Sector SPDR has risen in all 6 of those Oct 20 to Jul 2 windows, averaging 9.06% gains with no losing years in the sample. That record sits in the background as markets wrap up the midterm election year and prepare to transition into the historically more risk-on pre-election year.
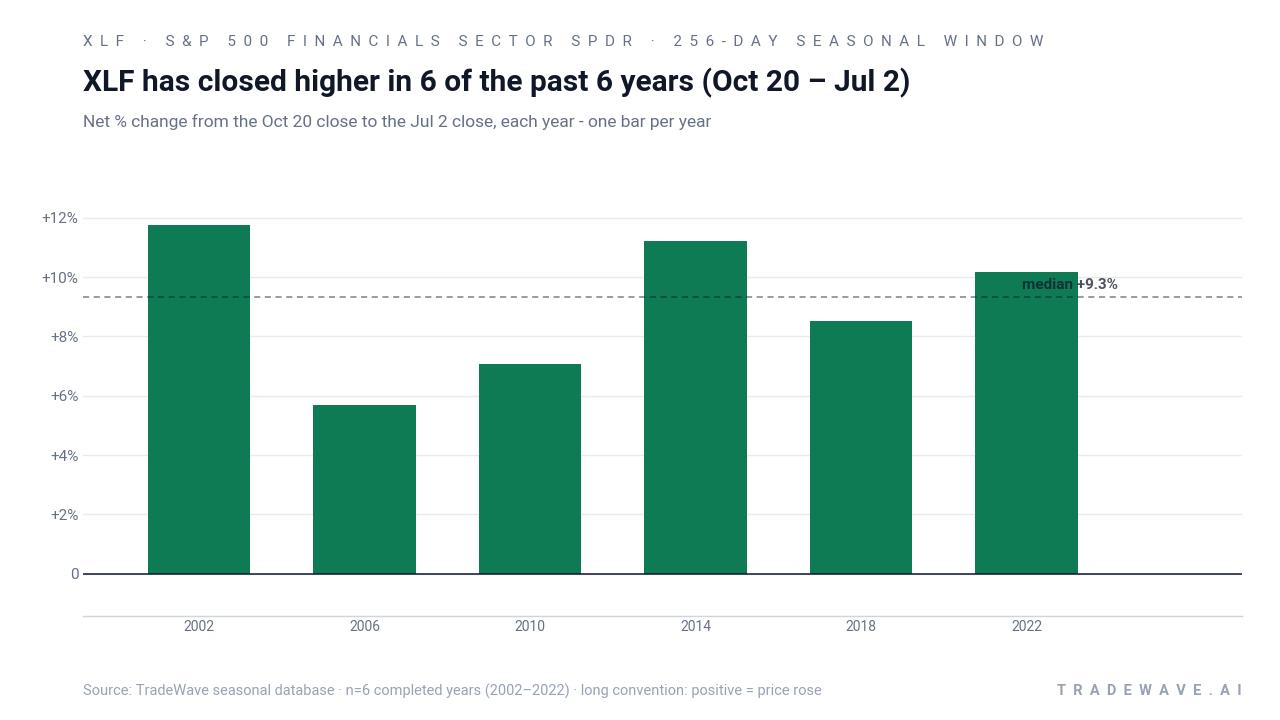
Across the six completed midterm-year cycles since 2002, XLF’s individual window returns ranged from a gain of 5.69% in 2006 to 11.74% in 2002, with other years like 2014 and 2022 also posting double-digit advances. The average winner gained 9.06%, and because there were no losing years, that figure is identical when you include all outcomes. For a long-only seasonal pattern, that kind of clean record over multiple cycles is unusual.
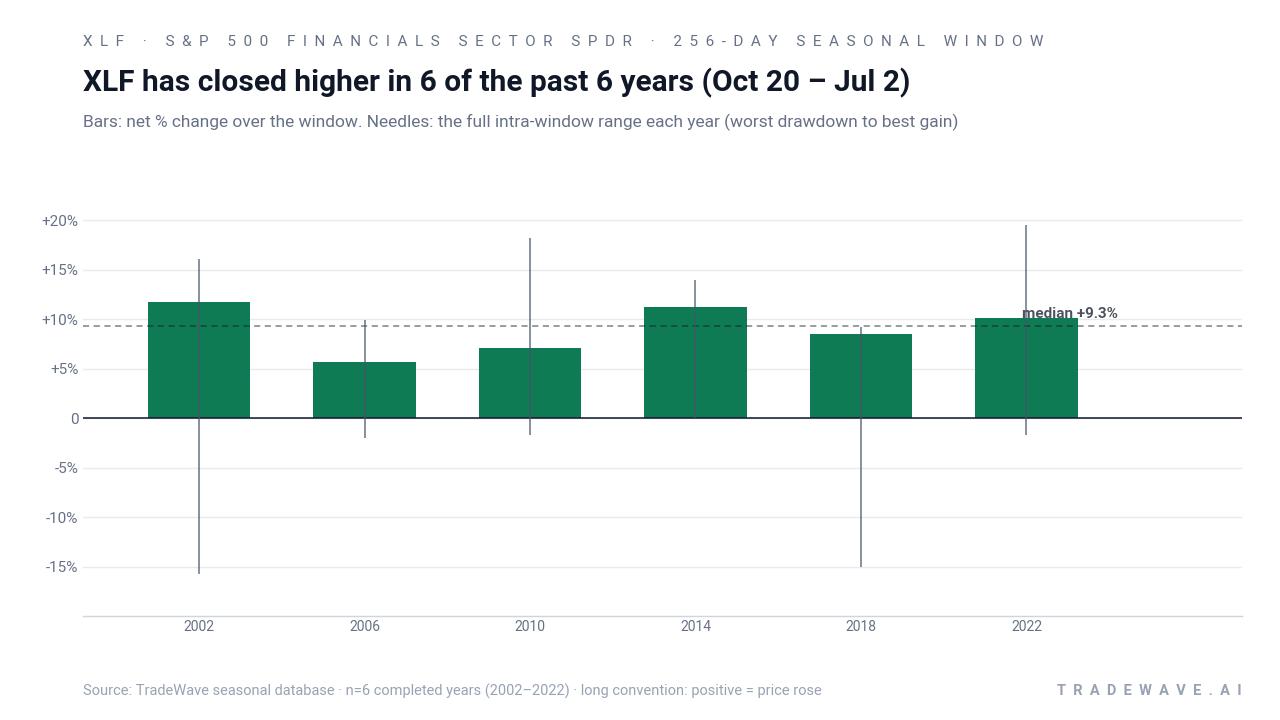
Intraperiod swings have been meaningful. In 2002, the ETF’s best point-to-peak move within the window reached 16.09%, but it also suffered a worst drawdown of 15.69% from the entry level before finishing higher. In 2018, the maximum favorable move was 9.25%, while the worst adverse excursion reached 14.99%, again ending with an 8.51% net gain by Jul 2. Those maximum favorable and maximum adverse excursions show that even “all green” windows can involve deep pullbacks along the way.
Year-by-year ranges show how far XLF has typically swung in both directions inside this window.
Viewed cumulatively, stacking these 256-day windows across the six midterm-year cycles compounds to a 68.09% total gain. The annualized return of 9.04% and a Sharpe ratio of 2.62 suggest that, historically, this has been a relatively efficient way to own financials exposure within the election cycle. The pattern also overlaps the broader midterm-to-pre-election “100-Year Pattern” regime that has often favored risk assets, which helps explain why the bias has been so consistently positive for XLF in this slice of the calendar.
History does not guarantee future results; adverse excursions can be large even in winning windows, and past seasonal behavior may not repeat.
Why does S&P 500 Financials Sector SPDR (XLF) follow this seasonal pattern?
One likely driver is the clustering of bank earnings, capital-return announcements, and regulatory updates between late autumn and midyear, which can support financial stocks as visibility improves. Analysts have also pointed to institutional portfolio rebalancing and sector rotation around the midterm-to-pre-election transition, when risk appetite has often increased and financials benefit from a firmer macro outlook. The pattern may also reflect how interest-rate expectations and credit conditions tend to stabilize after the early-year policy noise in midterm election years.
What is driving S&P 500 Financials Sector SPDR (XLF) today?
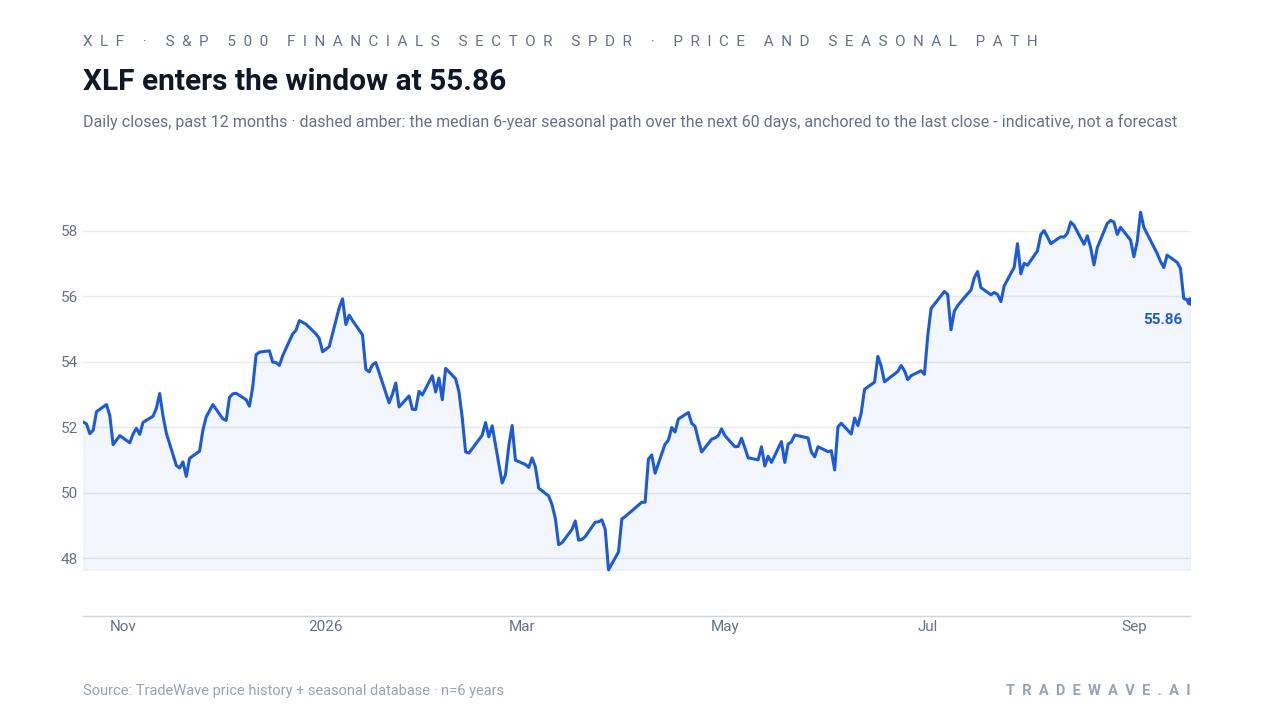
S&P 500 Financials Sector SPDR ended the prior session at 55.86, down 0.04% on the day and up 1.99% year to date, leaving the ETF about 4.7% below its 52-week high of 58.60 and above its 52-week low near 47.34.[1][3] With roughly 33.6 million shares changing hands on an average day over the past month, liquidity remains deep as investors weigh a mixed backdrop of moderating inflation, a plateau in policy rates, and uneven loan growth across the big banks.[1][3] Fund data show XLF remains a concentrated bet on financial services at roughly 98% of assets, so moves in large banks, insurers, and asset managers continue to dominate the ETF’s behavior.[3][4]
Valuation screens have XLF sitting close to what some models call “fair value,” which has kept the fund in a holding pattern while traders wait for the next catalyst on rates and credit quality.[6] Short interest data through late August show tens of millions of shares sold short, but without a clear, sudden spike that would signal an aggressive bearish build-up in recent weeks.[2] Options markets remain active across calls and puts, giving tactical traders tools to express views on whether the upcoming seasonal window will rhyme with the past six midterm-year cycles.[5]
The chart below situates the latest move in its recent multi-month context alongside the historical 60-day seasonal projection.
What should traders watch as the Oct 20 window approaches?
First, the calendar. The upcoming Oct 20 start date lands as the midterm election year is wrapping up and markets pivot toward the pre-election year, a phase that has often been friendlier to risk assets and to financials in particular. If XLF continues to hold above its 52-week low while staying within striking distance of the high, that would keep the historical 9.06% average gain in play as a reference point rather than a contradiction.
Second, watch how XLF behaves around key macro events that fall early in the window, including central bank meetings and major bank earnings clusters. Historically, some of the strongest years in this pattern, such as 2002 and 2014, saw the ETF absorb volatility early in the window before grinding higher into the following summer. A repeat of that “shakeout then climb” profile would be consistent with the past, while a decisive break to fresh 52-week lows would mark a clear departure from the prior six cycles.
Finally, positioning and flows will matter. Persistent inflows into financials ETFs, a stable or easing short-interest profile, and constructive credit spreads would all align with the long-biased seasonal backdrop.[2][3] On the other hand, a sharp build in short interest, heavy put buying, or signs of stress in bank funding markets would argue that this midterm-year window could diverge from its clean 6-for-6 history. For traders, the message is simple: the calendar has favored XLF in this stretch, but the tape and the macro will decide whether that pattern survives a seventh test.
Sources
- Barchart - XLF Performance Report for S&P 500 Financials Sector SPDR ETF - Barchart.com
- MarketBeat - Financial Select Sector SPDR Fund (XLF) Short Interest & Short Float | Updated Sep 2026
- Yahoo Finance - State Street Financial Select Sector SPDR ETF (XLF) Stock Price, News, Quote & History - Yahoo Finance
- Morningstar - XLF – Fund Analysis – State Street®FinSelSectSPDR®ETF | Morningstar
- Public.com (options chain) - Buy Financial Select Sector SPDR Fund (XLF) Call and Put Options - Options Chain
- GuruFocus - XLF Looks 0.0% Fairly Valued on GF Value™
About this seasonal analysis
Seasonal pattern data is sourced from TradeWave.ai, which analyzes historical price behavior across annual calendar windows going back up to 30 years. Read the full data methodology or the book The 100-Year Pattern by Afshin Moshrefi (2026 edition). Past performance of seasonal patterns does not guarantee future results. This article is for informational purposes only and does not constitute investment advice.