6-for-6 Midterm Run: Russell 2000 Ishares ETF (IWM) Eyes Bullish 40-Day Late-October Window
Russell 2000 Ishares ETF is approaching a 40-day late-October seasonal window that has never been negative in the midterm election years studied, just as small caps wrestle with rate and growth uncertainty.

What is the seasonal pattern for Russell 2000 Ishares ETF (IWM)?
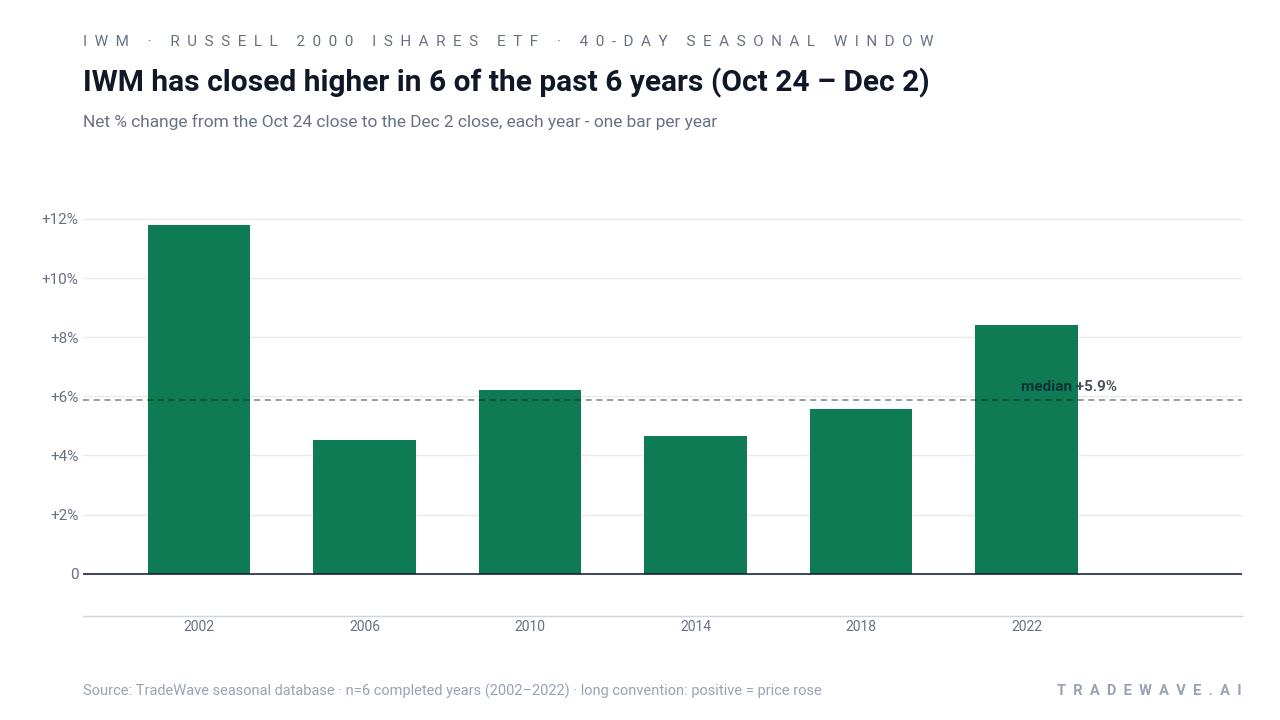
Russell 2000 Ishares ETF has risen in 6 of 6 midterm-year late‑October windows, with an average gain of 6.86% in winning years.
- 6 for 6 in this window, averaging 6.86% gains in winning years across the last six midterm election cycles.
- The upcoming 40-day trading window runs from Oct 24 to Dec 2 and has been a consistently bullish IWM seasonal trend.
- Percent Profitable is 100.0%, with 6 winners and 0 losers in the historical sample.
- Average profit of 6.86% reflects that every completed year in this Russell 2000 Ishares ETF trading window finished higher.
- Intraperiod swings have been manageable, with the worst historical drawdown inside the window limited to about 2.37% in a winning year.
- A TradeWave Ratio of 2.48 and a Sharpe ratio of 2.3 point to strong, relatively efficient upside during this specific seasonal stretch.
According to historical data from TradeWave.ai, this late‑October window has behaved very differently from an average month for IWM in past midterm election years. The next section walks through how that pattern has played out and where the risks have tended to cluster.
How has Russell 2000 Ishares ETF (IWM) traded in the late‑October midterm window?
In the last six midterm election years, Russell 2000 Ishares ETF has never posted a losing outcome in the 40 days from Oct 24 through Dec 2, averaging a 6.86% gain for long positions. That makes this upcoming slice of the calendar one of the cleaner bullish seasonal patterns in the small-cap space, even as IWM trades below its 52-week high of about 303.59 and remains well above its 52-week low near 224.32. The combination of a strong historical tailwind and a market still digesting earlier gains sets up a late‑year window that many small-cap traders have not fully priced into their playbook.
Because this pattern is grouped by the presidential election cycle, it only looks at midterm election years, which tend to feature tighter financial conditions and heavier policy uncertainty than the year before the presidential election. For small caps, that backdrop often means a rougher first half of the year followed by a catch-up phase as investors start to price in a friendlier pre‑election environment, and this Oct 24 – Dec 2 window sits squarely in that transition.
The trade direction for this setup is explicitly long. Across the six completed midterm-year samples, Percent Profitable is 100.0%, with 6 winners and 0 losers, and the median gain is 5.89%. Average profit of 6.86% means the typical year in this window has delivered a mid‑single‑digit to high‑single‑digit advance for IWM, even when the broader year was choppy for small caps.
Looking at individual years, the strongest outcome came in 2002, when IWM gained 11.78% between the Oct 24 entry and the Dec 2 exit, with a best intraperiod run-up of 13.6% and a modest worst drawdown of about 0.92% from entry. The softest year in the sample was 2006, which still finished up 4.51% but saw a maximum adverse move of roughly 2.37% before recovering into the close. That mix of solid net gains and contained downside is what drives the relatively high Sharpe ratio of 2.3 for the window.
The MFE/MAE profile shows that in most years, the maximum favorable move inside the window has been meaningfully larger than the worst drawdown. Maximum favorable excursions have ranged from about 4.52% to 13.6%, while maximum adverse excursions have stayed between 0% and roughly 2.37%. In plain English, prior midterm-year versions of this window have tended to reward patience on the upside without forcing traders to sit through deep underwater periods.
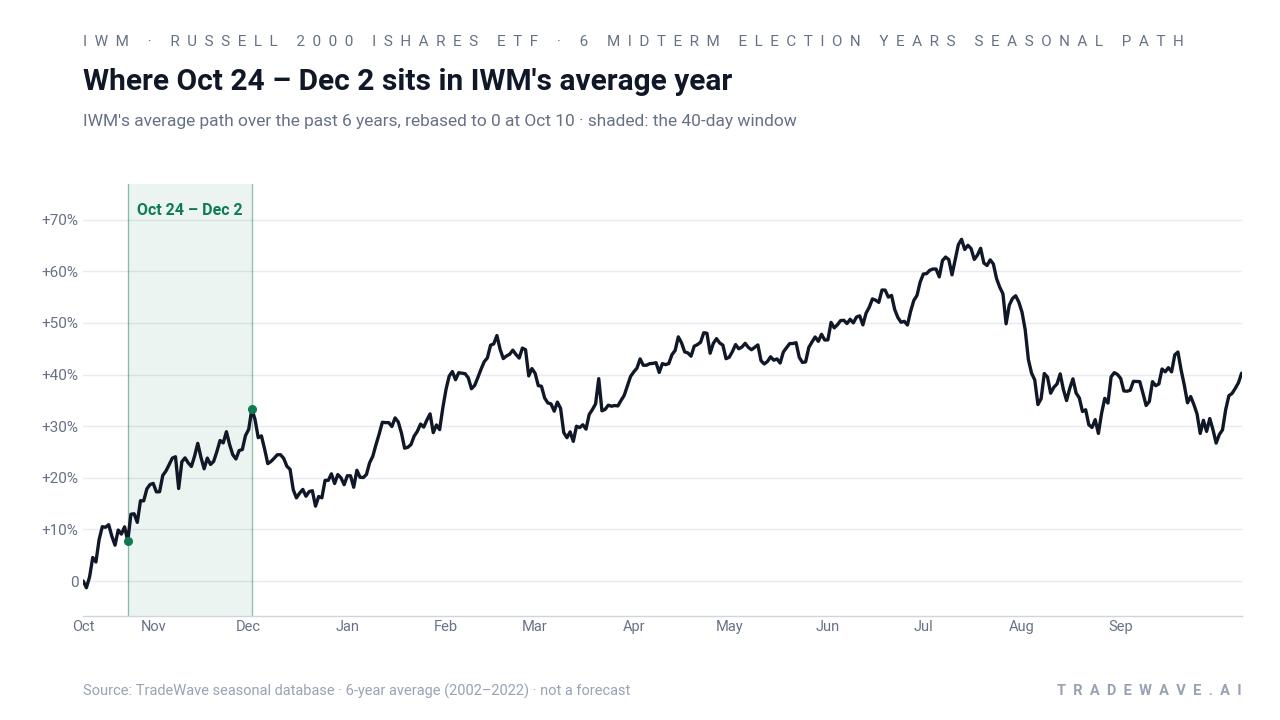
The historical seasonal average path suggests that gains in this window have usually built gradually rather than in a single spike. The shaded Oct 24 – Dec 2 segment tends to slope higher throughout the period, hinting that prior rallies often unfolded as a series of advances with only shallow pullbacks, instead of a volatile surge followed by a give‑back.
A closer look at yearly net returns and intraperiod ranges helps quantify both the upside and the typical drawdown risk.
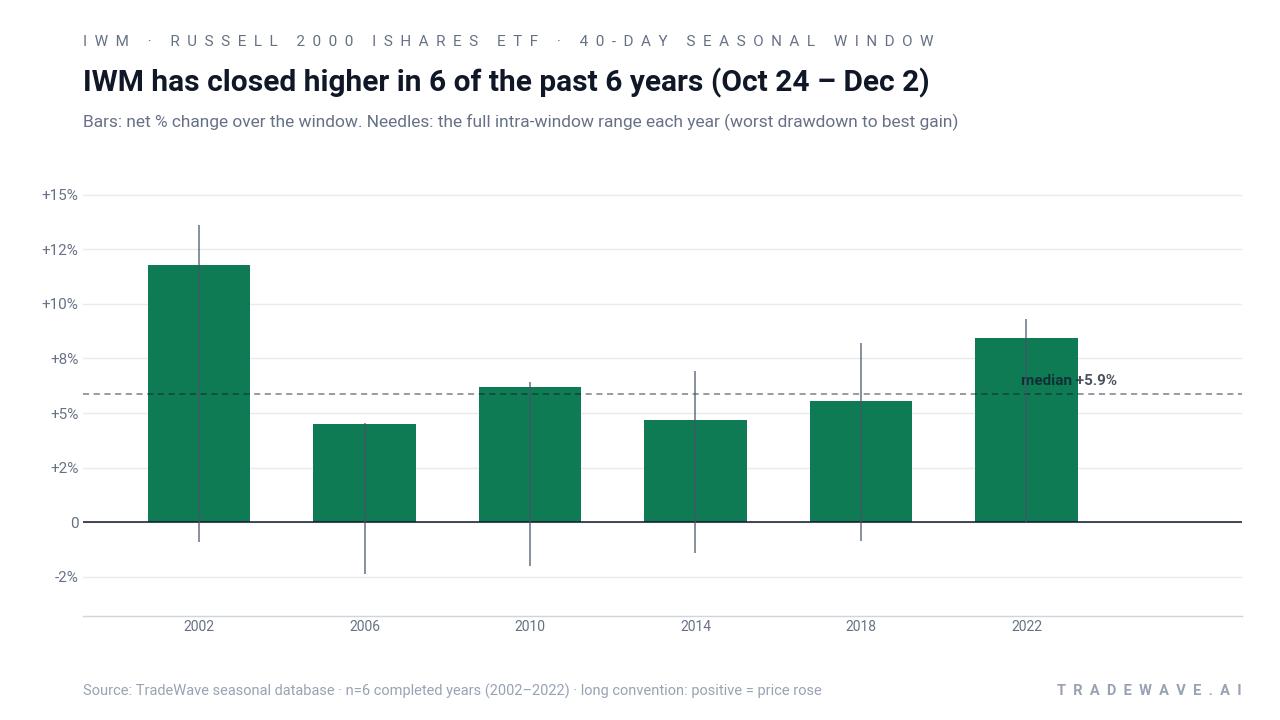
The stacked net/MFE/MAE view reinforces the message: every bar finishes above zero, and the needles show that even in the more volatile years, downside excursions have been modest compared with the upside that eventually prevailed. Add it up and the cumulative return from repeatedly holding this window across the six midterm years compounds to 48.63%, a sizable contribution for a slice of the calendar that covers just 40 days each cycle.
History does not guarantee future results; even in a strong pattern like this, adverse excursions can still occur and MAE can be uncomfortable before any upside plays out.
Why does Russell 2000 Ishares ETF (IWM) follow this seasonal pattern?
One likely driver is the way the policy and earnings calendar lines up late in midterm election years. By late October, much of the macro damage from tighter policy is known, third‑quarter earnings for small caps are in focus, and investors often start rotating toward the historically stronger year before the presidential election. For IWM, that can translate into a catch‑up bid as portfolio managers rebalance into domestically focused cyclicals and higher‑beta names ahead of a typically more supportive pre‑election year backdrop.
What is driving Russell 2000 Ishares ETF (IWM) today?
Small caps have spent much of 2026 trading in the shadow of interest‑rate expectations and growth worries, with IWM lagging its 52‑week high of about 303.59 while staying comfortably above its 52‑week low near 224.32. In April 2026, MarketBeat highlighted that the Russell 2000 was tracking toward fresh highs, pointing to the Federal Reserve’s rate path and earnings growth as key catalysts for IWM’s performance.[2] By September 2026, BTIG flagged a more ominous signal, noting that August’s pattern in IWM had previously preceded multi‑month declines and warning that elevated 10‑year yields and higher odds of a rate hike could pressure small caps.[2]
Those cross‑currents fit the usual script for the concluding midterm election year, when tighter financial conditions and policy uncertainty often weigh on smaller companies that are more sensitive to funding costs and domestic demand. MarketBeat has also emphasized that IWM’s roughly 44 million average daily volume makes it the liquidity vehicle of choice for traders expressing views on the Russell 2000, which can amplify both risk‑on and risk‑off swings when macro headlines hit.[2] Against that backdrop, the upcoming late‑October seasonal window stands out as a rare stretch where history has leaned consistently in favor of the bulls, even when the broader narrative around rates and growth has been messy.
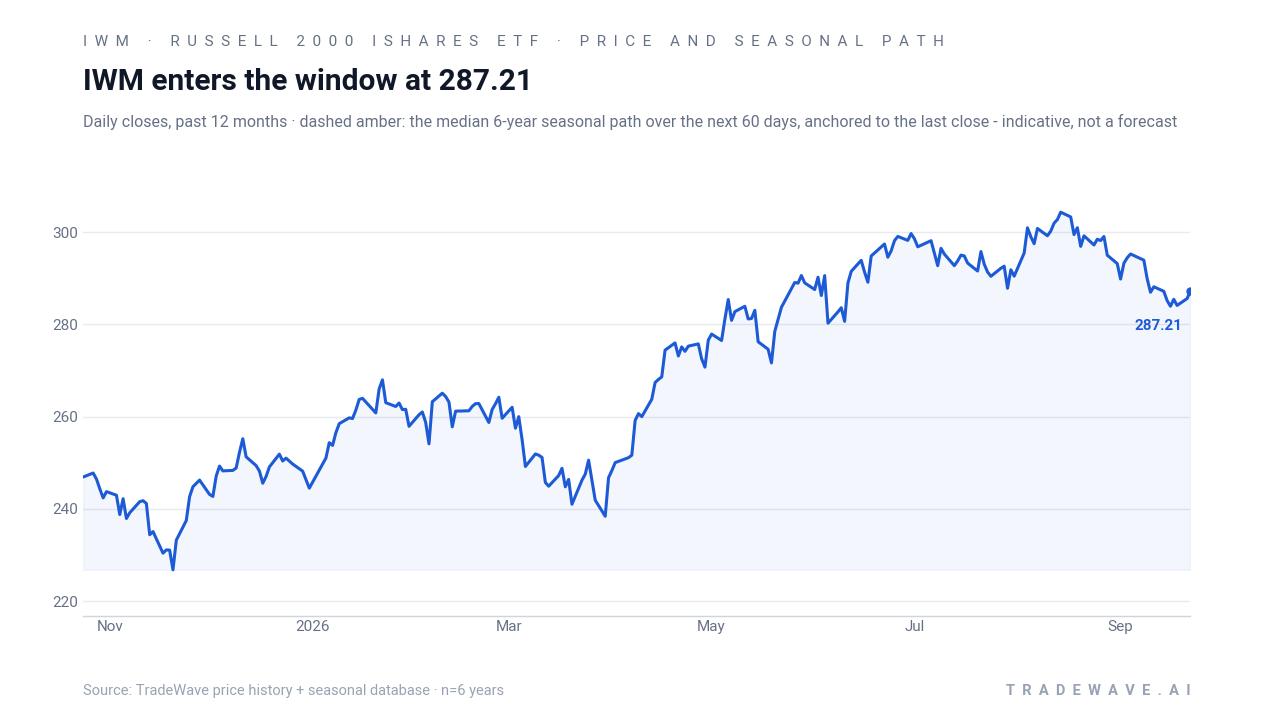
The chart below places the latest moves in IWM against its past year of trading and the median seasonal path for the next two months.
What should traders watch as this IWM seasonal window approaches?
First, the policy calendar remains central. The Federal Reserve’s messaging on the path of the 10‑year yield and any shift in rate‑hike odds will likely dictate whether small caps can lean into the historical late‑October strength or remain pinned by funding‑cost fears.[2] A backdrop of stabilizing or easing yields has historically been friendlier to IWM than a renewed march higher in rates.
Second, watch how IWM behaves as Oct 24 approaches relative to its 52‑week band. A decisive move back toward the 300 area would signal that investors are willing to pay up for small‑cap exposure ahead of the year before the presidential election, while a slide closer to the mid‑240s would suggest that macro stress is overwhelming the usual seasonal tailwind. Price action inside the Oct 24 – Dec 2 window that tracks the historical pattern of steady gains with shallow pullbacks would confirm that the midterm‑year playbook is still in force.
Third, liquidity and flows matter. MarketBeat’s observation that IWM is the most liquid Russell 2000 vehicle means that any shift in sentiment toward small caps is likely to show up here first, whether through heavier buying on risk‑on days or outsized selling when macro data disappoints.[2] Traders will be watching whether volume builds on up days as the window opens, which would align with the historical pattern, or whether rallies are sold into, which would be an early sign that this cycle may diverge from the past.
Finally, keep an eye on how the broader narrative around the transition from the midterm election year to the year before the presidential election evolves. If investors start to frame 2027 as a more supportive environment for risk assets, the historical tendency for IWM to rally in this late‑October window could again serve as the bridge between a tough policy year and a more constructive pre‑election phase. If instead the conversation stays locked on sticky inflation and higher‑for‑longer rates, the seasonal edge will be working against a stronger macro headwind than in most prior cycles.
Sources
About this seasonal analysis
Seasonal pattern data is sourced from TradeWave.ai, which analyzes historical price behavior across annual calendar windows going back up to 30 years. Read the full data methodology or the book The 100-Year Pattern by Afshin Moshrefi (2026 edition). Past performance of seasonal patterns does not guarantee future results. This article is for informational purposes only and does not constitute investment advice.