CBOE Volatility Index (VIX) Enters 73-Day Stretch Where Shorts Averaged 14.58% Profits
CBOE Volatility Index is heading into a historically soft 73-day seasonal window even as it trades well below its 52-week high, raising questions about how long equity hedges will stay bid.

What is the seasonal pattern for CBOE Volatility Index (VIX)?
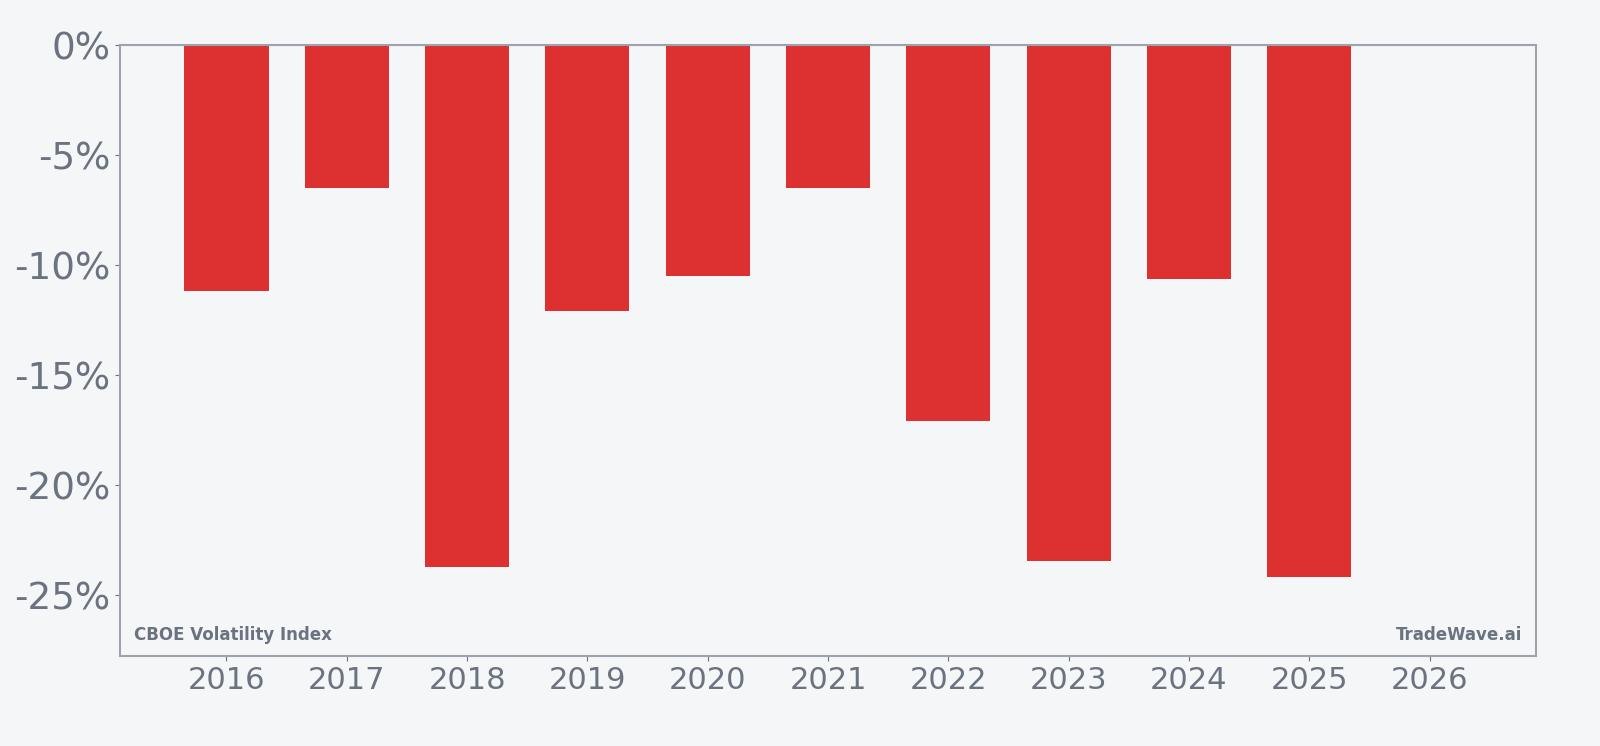
CBOE Volatility Index has fallen in 10 of 10 years during this 73-day spring-to-summer window, with an average 14.58% gain for short positions in winning years.
- 10 for 10 in this window, with short VIX trades averaging 14.58% profits across the past decade.
- Seasonal window runs 73 trading days starting May 2, covering the late-spring to mid-summer volatility pattern.
- Percent Profitable is 100%, with 10 winners and 0 losers for the short-volatility trade direction.
- Median profit for the pattern is 11.62%, pointing to consistent, not just outlier-driven, gains for shorts.
- TradeWave Ratio (TWR) of 2.88 signals that VIX typically travels meaningfully in the short direction within the window, even before the final close.
- Sharpe ratio of 1.97 indicates historically strong risk-adjusted returns for fading volatility in this specific stretch.
According to historical data from TradeWave.ai, this upcoming stretch has behaved very differently from an average month on the volatility calendar. The next section looks at how that pattern has played out and what it could mean for traders watching the CBOE Volatility Index.
How has CBOE Volatility Index (VIX) behaved in this 73-day window?
CBOE Volatility Index has declined in every one of the past 10 years during the 73 trading days starting May 2, rewarding traders who were short volatility in this window. Today VIX sits at 19.31, up 2.1% on the day but still about 45.3% below its 52-week high of 35.30.[1] That combination of a historically reliable seasonal drift lower and a current level well off the highs gives equity investors a defined calendar zone where volatility has tended to bleed out rather than spike.
Across the decade-long lookback, the short-volatility trade in this CBOE Volatility Index trading window has produced a cumulative return of 283% with an annualized return of 14.39%. Average profit per year clocks in at 14.58%, with a median outcome of 11.62%, which means the pattern is not just driven by one or two outsized collapses in implied volatility. For a volatility index that can move violently around macro shocks, that level of consistency in a specific calendar slice stands out.
The per-year table shows the strongest season for shorts was 2025, when VIX fell 24.16% from an entry near 22.68 to an exit around 17.20 during the window. The softest outcome for the pattern came in 2017, when VIX still declined 6.52% from 10.59 to 9.90, even as realized volatility across equities was subdued. In every case, the end-of-window result favored traders positioned for volatility to compress rather than explode higher.
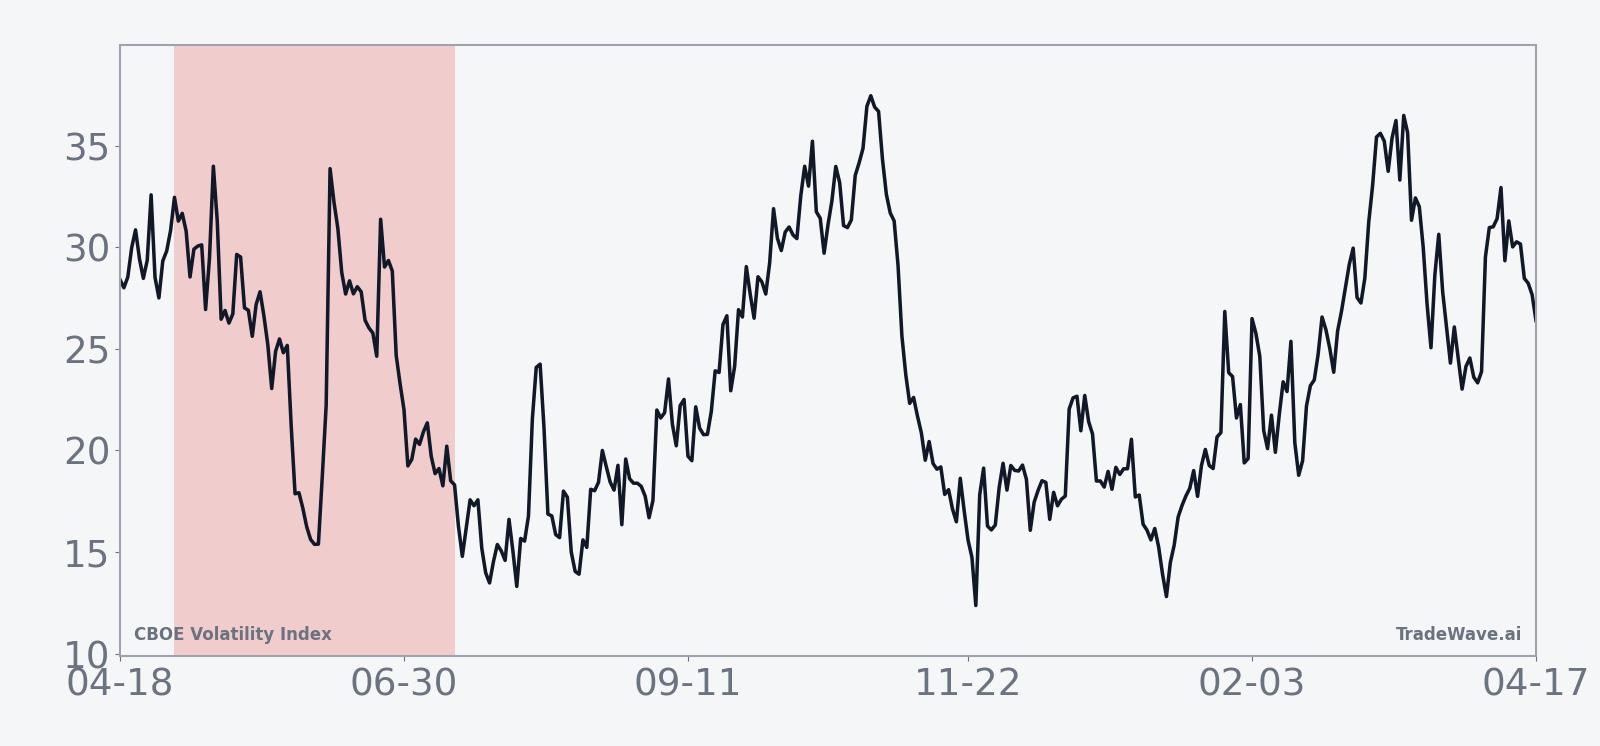
The historical seasonal trend chart suggests that the bulk of the move for short positions has tended to accrue in the middle of the window rather than right at the start. Early days often show choppy action, followed by a more persistent grind lower in implied volatility as the calendar moves deeper into summer. Late in the window, the average path flattens, hinting that the easy part of the trade has usually passed by then.
Year-by-year bars that include both peak run-ups and worst drawdowns show how much VIX has typically swung inside the window before settling lower.
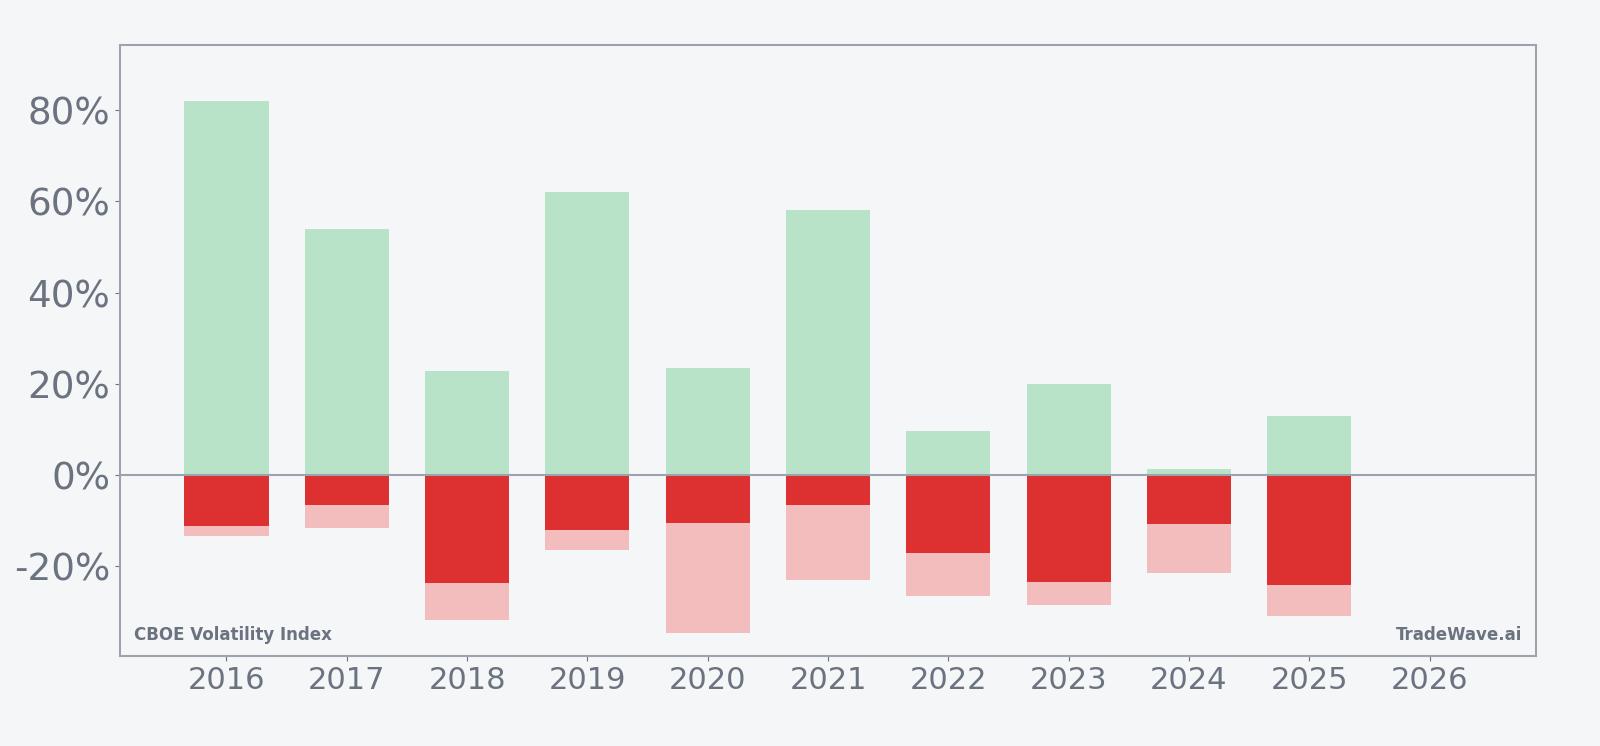
Maximum favorable excursions in several years have topped 50% for short positions, meaning VIX at some point traded far below the entry level before bouncing. At the same time, maximum adverse excursions have reached into the negative 20% to negative 35% range in years like 2018, 2020, 2022, 2023, and 2025, showing that volatility spikes inside the window are common even when the final outcome is a lower close. In other words, the pattern has historically rewarded patience and risk management rather than a straight-line fade.
History does not guarantee future results; adverse excursions can be large even in winning windows, and volatility spikes inside the pattern have been frequent.
Why does CBOE Volatility Index (VIX) follow this seasonal pattern?
This VIX seasonal trend likely reflects a mix of earnings calendar clustering, options expiration patterns, and institutional portfolio repositioning as the market moves from spring into the lower-liquidity summer months. Analysts often point to a post-earnings lull in corporate news and a reduction in macro event risk that can compress implied volatility once the first-half policy and earnings calendar is largely known. The pattern may also capture systematic volatility selling strategies that tend to re-engage after early-year shocks have passed and realized volatility has started to cool.
What is driving CBOE Volatility Index (VIX) today?
CBOE Volatility Index closed at 19.31, up 0.39 points or 2.1% from the prior session, but still trading well below its 52-week high of 35.30 and above the 52-week low of 13.38.[1] That leaves VIX roughly in the middle of its one-year range as traders weigh lingering geopolitical risks against a market that has already digested several major volatility shocks in recent quarters.[2] In calm, well-supported equity markets, implied volatility typically compresses, while risk-off episodes and abrupt equity drawdowns tend to drive VIX sharply higher.
The chart below situates the latest move in its recent multi-month context and overlays the upcoming seasonal projection.
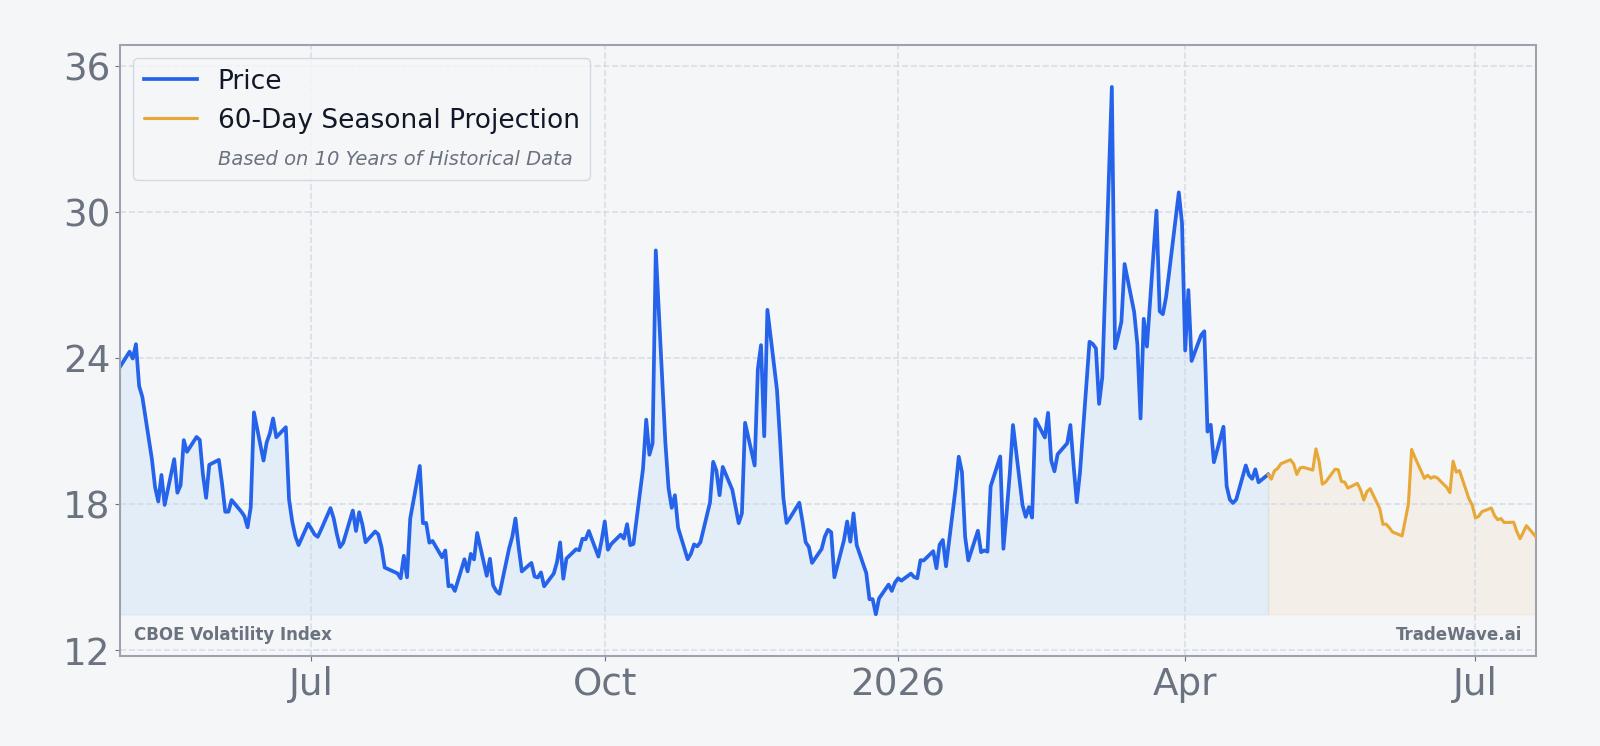
Recent macro history shows how quickly that backdrop can change. In Jan 2026, policy unpredictability in Washington kept VIX elevated around a perceived floor in the mid-teens as investors maintained hedges against potential shocks.[10] On Mar 18, 2026, the Middle East conflict and related geopolitical tensions pushed VIX to 23.42, underscoring how fast implied volatility can jump when risk headlines hit the tape.[2][11] Earlier episodes in 2025 tied to US-China trade tensions and tariff threats produced similar spikes, with VIX briefly surging above 40 during a bout of trade-war volatility in late April 2025.[8]
Those prior episodes also shaped how traders use VIX options and futures. In Apr 2025, one widely discussed strategy involved using VIX options to position around potential trade-war-driven crashes, highlighting how volatility products have become a core part of the macro toolkit for both hedgers and speculators.[8] During the same broad period, VIX futures and options volumes climbed as tariffs and geopolitical events pushed more investors to seek protection or express directional views on volatility itself.[5] While those flows are not today’s story, they frame how quickly positioning can build if the macro backdrop shifts again as this year’s seasonal window approaches.
What should traders watch as this VIX seasonal window approaches?
The first waypoint is the calendar itself: the 73-day window begins on May 2 and runs deep into summer, a period that has historically seen VIX grind lower even when intraperiod spikes occurred. Traders will be watching whether any fresh geopolitical or policy shocks arrive early in the window, since past years show that volatility spikes inside this stretch have often been faded rather than sustained. A sustained move back toward the 52-week high near 35.30 during the window would contradict the historical pattern, while a drift back toward the mid-teens would be more in line with the decade-long seasonal trend.[1]
Options and futures positioning will be the second key tell. If VIX call buying and hedging activity ramps up into early May without a corresponding rise in realized equity volatility, that could set the stage for another period where implied volatility slowly bleeds off as the seasonal window progresses. Conversely, if demand for protection stays muted and realized volatility remains low, the historical pattern suggests that short-volatility strategies may again find a supportive backdrop, albeit with the usual risk of sharp but temporary spikes. Add it up: this is a calendar stretch where volatility has repeatedly faded, and the next iteration is only days away.
Sources
About this seasonal analysis
Seasonal pattern data is sourced from TradeWave.ai, which analyzes historical price behavior across annual calendar windows going back up to 30 years. Read the full data methodology or the book The 100-Year Pattern by Afshin Moshrefi (2026 edition). Past performance of seasonal patterns does not guarantee future results. This article is for informational purposes only and does not constitute investment advice.