CBOE Volatility Index (VIX) Has Dropped 10 of 10 Years in This 73-Day Early-May Window
CBOE Volatility Index is sliding into a historically weak 73-day stretch starting May 2, even as today’s reading sits far below last year’s highs and geopolitical risks keep volatility hedges in focus.

What is the seasonal pattern for CBOE Volatility Index (VIX)?
CBOE Volatility Index has fallen in 10 of 10 years during this early‑May 73‑day window, with an average gain of 14.58% for short positions in winning years.
- 10 for 10 in this window, with short VIX trades averaging 14.58% profits across the past decade.
- Seasonal window runs 73 trading days from May 2, during which VIX has consistently trended lower.
- Percent Profitable is 100%, with 10 winners and 0 losers for the short-volatility setup.
- Median profit for winning years is 11.62%, pointing to a steady, repeatable VIX seasonal trend.
- TradeWave Ratio (TWR) of 2.88 signals that VIX typically travels meaningfully in the trade direction within the window.
- Sharpe ratio of 1.97 indicates historically strong risk‑adjusted returns for this specific VIX seasonal window.
According to historical data from TradeWave.ai, this upcoming stretch has behaved very differently from an average month on the volatility calendar. TradeWave.ai’s long lookback on VIX shows a distinct early‑May pattern that most equity traders never see in standard index charts.
How has CBOE Volatility Index (VIX) behaved in this early‑May seasonal window?
CBOE Volatility Index has dropped in every single iteration of this 73‑day early‑May window over the past 10 years, rewarding short‑volatility positions each time. The next window begins on May 2 with VIX at 18.02, down 3.7% on the day and about 49.0% below its 52‑week high of 35.30, leaving plenty of room above last year’s floor if volatility flares again.
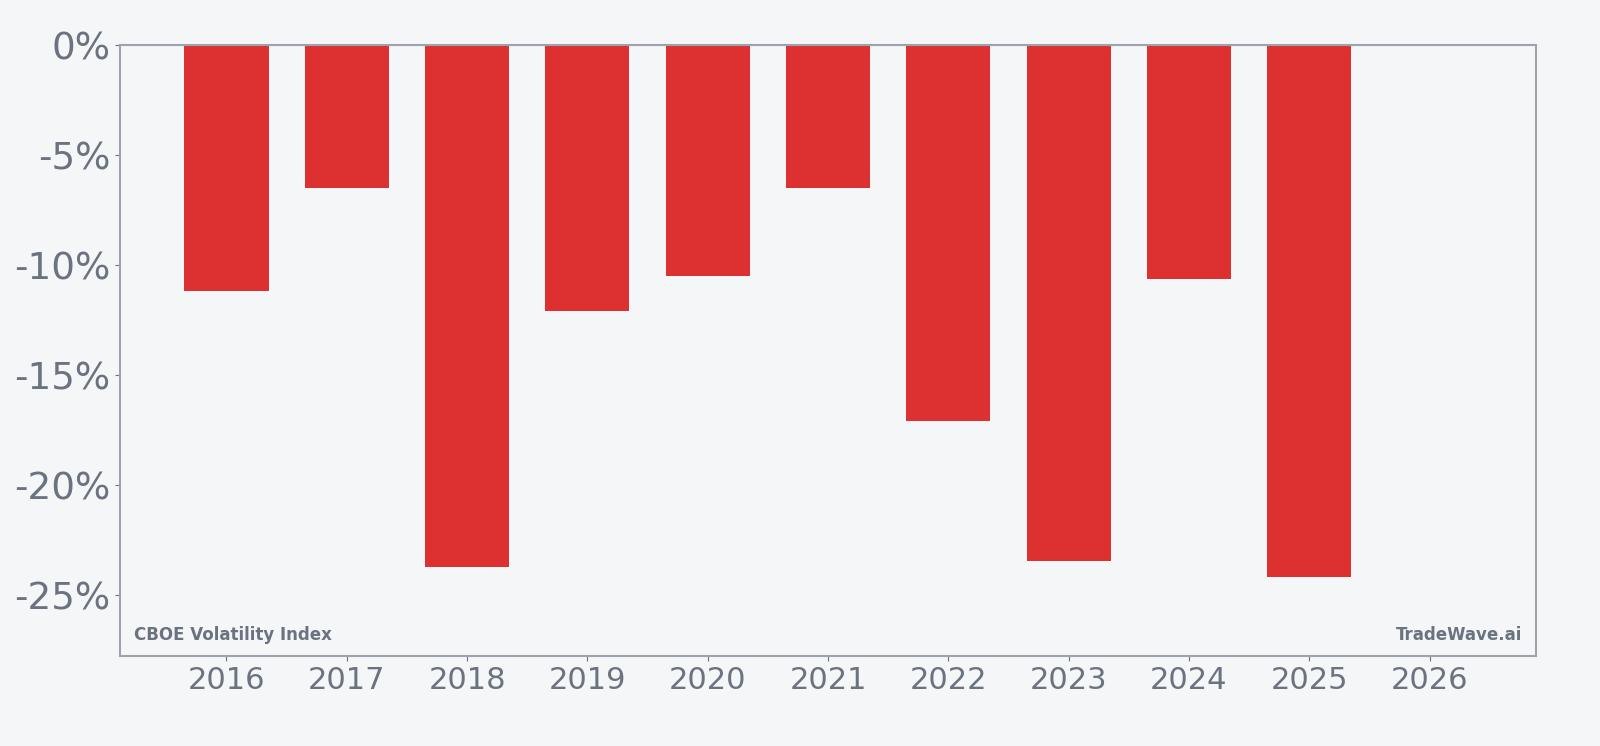
Trade direction for this pattern is explicitly short, which means the historical “wins” are years when implied volatility bled lower and VIX finished the window below its early‑May starting point. Across the decade, Percent Profitable sits at 100%, with 10 winners and no losing years, and the average profit for those short positions is 14.58%, with a median gain of 11.62% that keeps the profile from being skewed by a single outlier.
The per‑year table shows how consistent that behavior has been. The strongest year for the pattern was 2018, when a short VIX position in this window would have returned 23.73% as the index slid from 15.97 to 12.18. The softest outcome still counted as a win: in 2017, VIX fell from 10.59 to 9.90, delivering a 6.52% profit for the short trade despite several sharp intraperiod spikes.
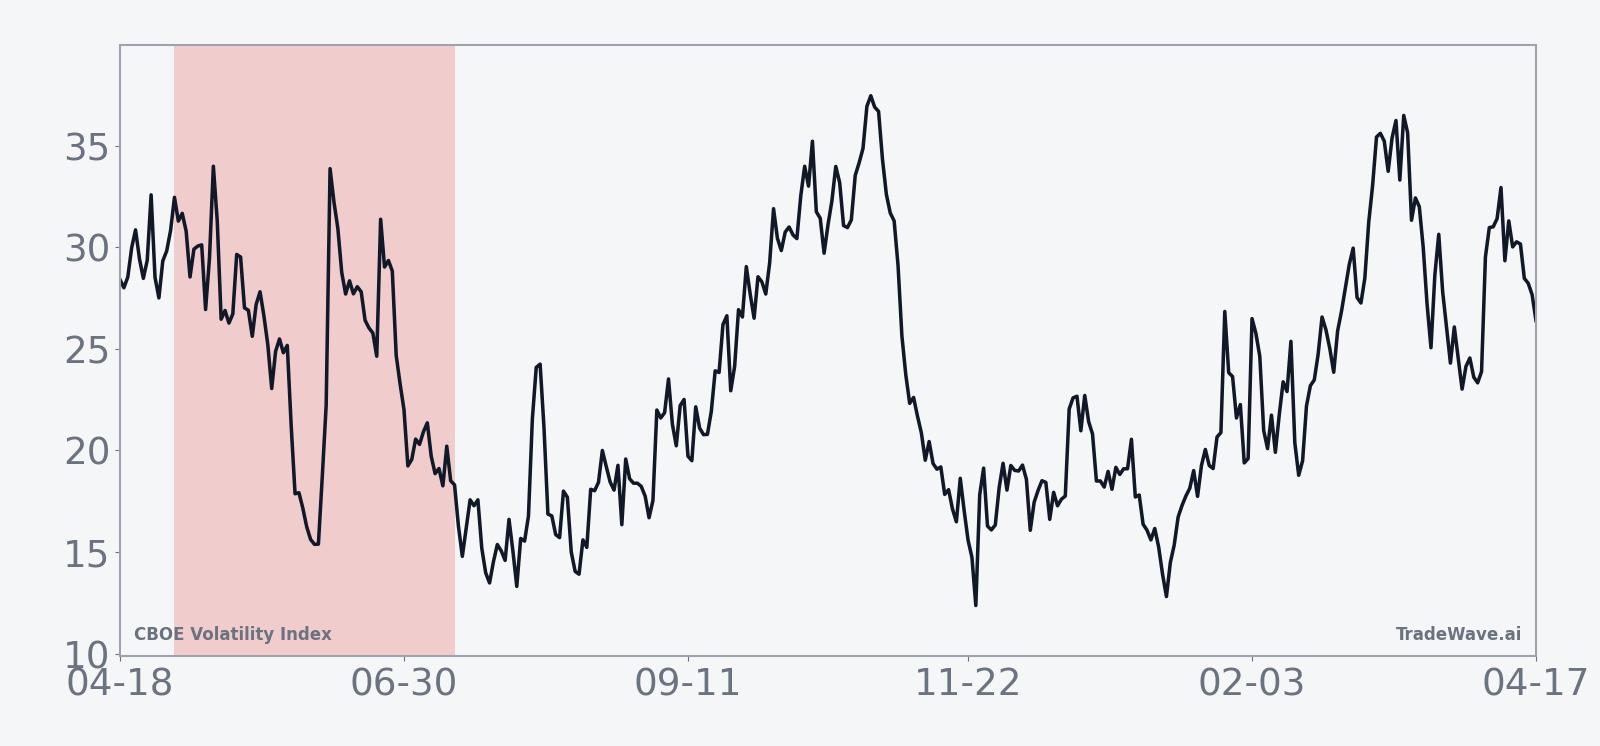
The historical seasonal average shows most of the short‑side gains accruing in the middle third of the window, after an initial choppy phase. In several years, VIX popped higher early on before grinding lower into late June and mid‑July, which fits the pattern of spring macro scares giving way to calmer summer trading in equities.
Year‑by‑year bars with intraperiod swings highlight how far VIX has tended to move in both directions before settling lower.
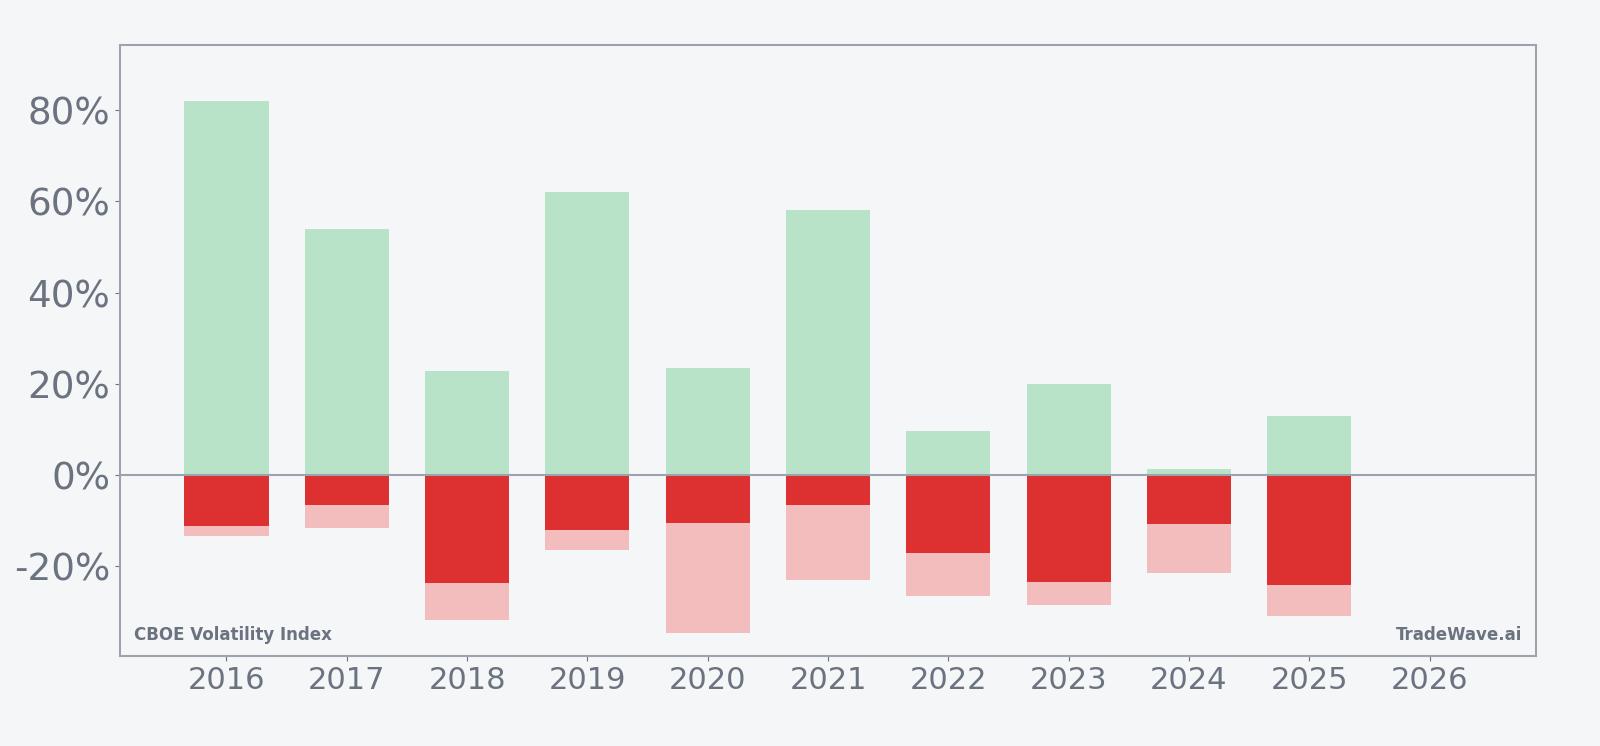
The MFE/MAE profile is where the risk shows up. In 2016, for example, the best intraperiod move for a short position was an 82.02% favorable swing as VIX collapsed from a spike, but the worst drawdown from entry was 13.35% against the trade before that move unfolded. In 2020, the maximum adverse excursion reached 34.56% even though the short still finished the window up 10.51%, underscoring that volatility can lurch higher before resuming its typical seasonal drift lower.
Across the decade, those large favorable and adverse excursions line up with a TradeWave Ratio of 2.88, which signals that VIX often travels a long way in the trade direction inside the window, even if the final net move is smaller than the path it took to get there. Add it up: 283% cumulative gains for the short‑volatility setup across ten early‑May windows, with a Sharpe ratio of 1.97 that reflects strong risk‑adjusted performance despite the occasional gut‑check spike.
History does not guarantee future results, and the worst intraperiod drawdowns (MAE) in this window have been large even in years that ultimately finished as winners for short VIX trades.
Why does CBOE Volatility Index (VIX) follow this seasonal pattern?
One likely driver is the way macro and earnings calendars cluster earlier in the year, with many of the biggest policy and growth surprises hitting in the first quarter and early spring. By May and June, investors have more clarity on central bank paths and corporate guidance, which can compress implied volatility as equity markets stabilize. Analysts have also pointed to options expiration patterns and summer liquidity, where dealers’ hedging flows and lighter positioning can encourage a slow bleed in volatility rather than sustained spikes.
What is driving CBOE Volatility Index (VIX) today?
VIX closed at 18.02 on Apr 28, down 3.7% on the day and sitting about 34.0% below its 50‑day moving average of 22.51, a sign that implied volatility has cooled sharply from the stress seen earlier this year. That pullback comes after a March spike to 23.42 during a flare‑up in the Middle East conflict, when geopolitical risk briefly pushed volatility higher even as US equities held up on the back of technology and energy strength.[1] In calm stretches like this, VIX often drifts lower as equity markets grind higher, but the index can still jump quickly if trade tensions, policy surprises or new geopolitical shocks hit the tape.[1]
The chart below shows how that retreat from March’s highs lines up with the historical 60‑day seasonal projection.
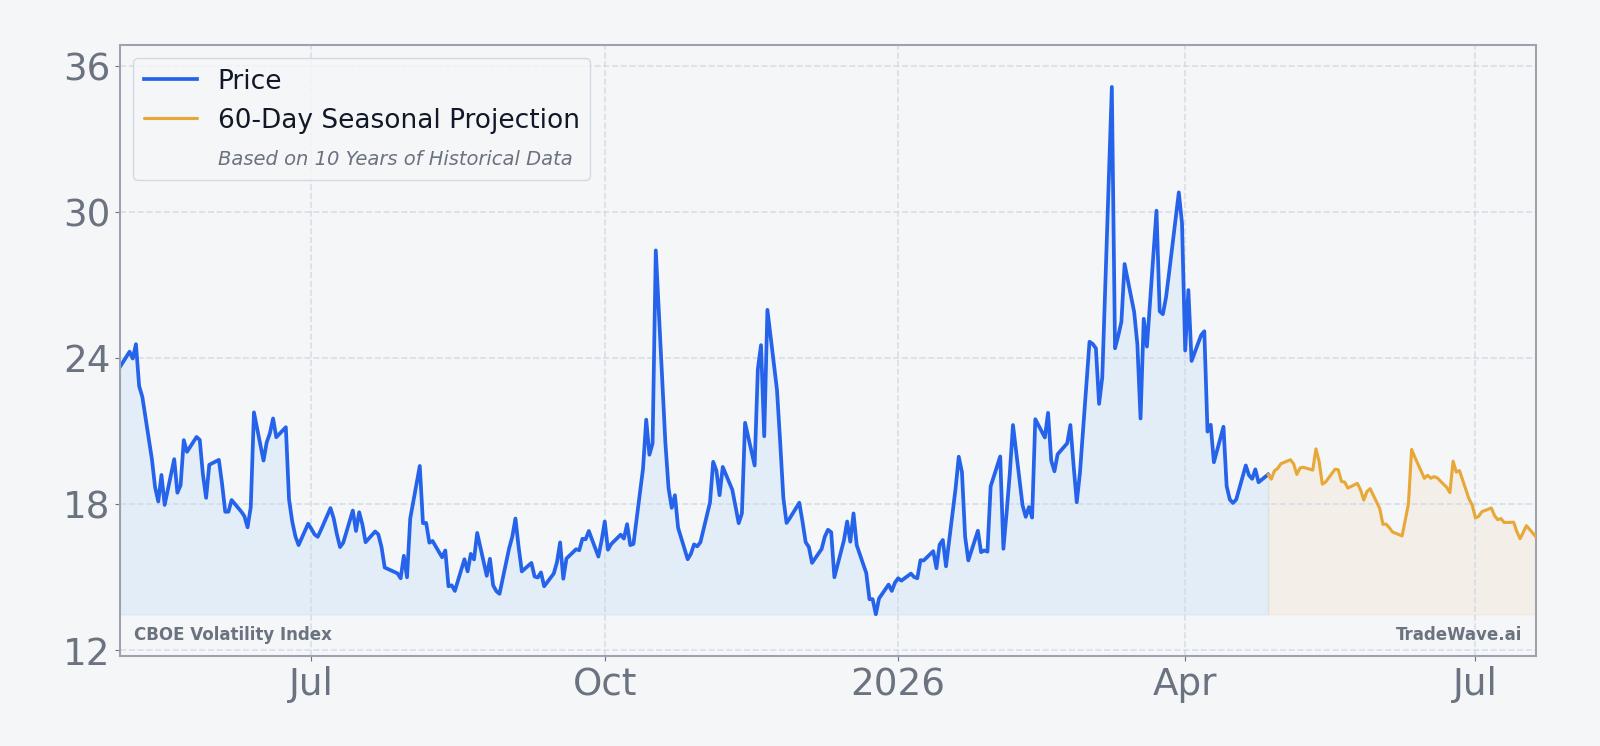
For equity traders, the relationship is straightforward: when stocks are well supported, implied volatility tends to compress, and when risk‑off episodes hit, VIX can surge. The current level near 18 leaves room for both outcomes as the market heads into the early‑May seasonal window that has historically favored short‑volatility positions. If macro shocks stay contained, the pattern suggests VIX has often had a tendency to grind lower into mid‑summer, but any renewed trade‑war headlines, policy missteps or geopolitical escalations could still trigger sharp, if temporary, spikes along the way.[1]
What should traders watch in this VIX seasonal window?
The first checkpoint is how VIX behaves around the May 2 start date: in prior years, early pops have often faded, with the bulk of short‑side gains arriving later in the 73‑day window. Traders will be watching whether any fresh macro shocks, from trade disputes to policy surprises, can break that pattern by sustaining volatility at higher levels rather than allowing it to bleed off. Levels near the 50‑day moving average around 22.5 and the 52‑week high at 35.3 are key markers; repeated failures to hold above those zones would be consistent with the historical seasonal drift lower, while a decisive break and hold could signal that this cycle is different. Finally, monitoring whether volatility spikes remain short‑lived or start to cluster will help confirm or contradict the decade‑long pattern of VIX ultimately finishing this early‑May window below where it began.
Sources
About this seasonal analysis
Seasonal pattern data is sourced from TradeWave.ai, which analyzes historical price behavior across annual calendar windows going back up to 30 years. Read the full data methodology or the book The 100-Year Pattern by Afshin Moshrefi (2026 edition). Past performance of seasonal patterns does not guarantee future results. This article is for informational purposes only and does not constitute investment advice.