CBOE Volatility Index (VIX) Has Dropped in 10 of 10 Early-May Windows for Shorts
CBOE Volatility Index is heading into a historically weak 73-day stretch starting May 2, even as it trades well below its 52-week high after a turbulent start to 2026.

What is the seasonal pattern for CBOE Volatility Index (VIX)?
CBOE Volatility Index has fallen in 10 of 10 years during this early‑May 73‑day window, with an average 14.58% gain for short positions in winning years.
- 10 for 10 in this window, with VIX declining every year and short trades averaging 14.58% profit.
- Seasonal window runs from May 2 for 73 trading days, covering much of late spring and early summer.
- Percent Profitable is 100%, with 10 winners and 0 losers across the past decade.
- Trade Direction is short, meaning the pattern has favored strategies that benefit when implied volatility drifts lower.
- TradeWave Ratio (TWR) of 2.88 signals that VIX has typically moved meaningfully in the trade direction within the window, not just at the close.
- Sharpe ratio of 1.97 points to a historically strong risk‑adjusted profile for this specific VIX seasonal trend.
According to historical data from TradeWave.ai, this upcoming stretch has behaved very differently from an average month on the volatility calendar. The next section looks at how that pattern has played out over the past decade and what it could mean for traders watching VIX into early summer.
How has CBOE Volatility Index (VIX) behaved in the May 2 seasonal window?
CBOE Volatility Index has dropped in every single May‑through‑mid‑summer window for the past decade, with short trades in this 73‑day stretch averaging 14.58% gains. Today VIX sits at 19.12, about 45.8% below its 52‑week high of 35.30 and modestly above its 52‑week low of 13.38, leaving plenty of room in either direction as the window approaches.[1]
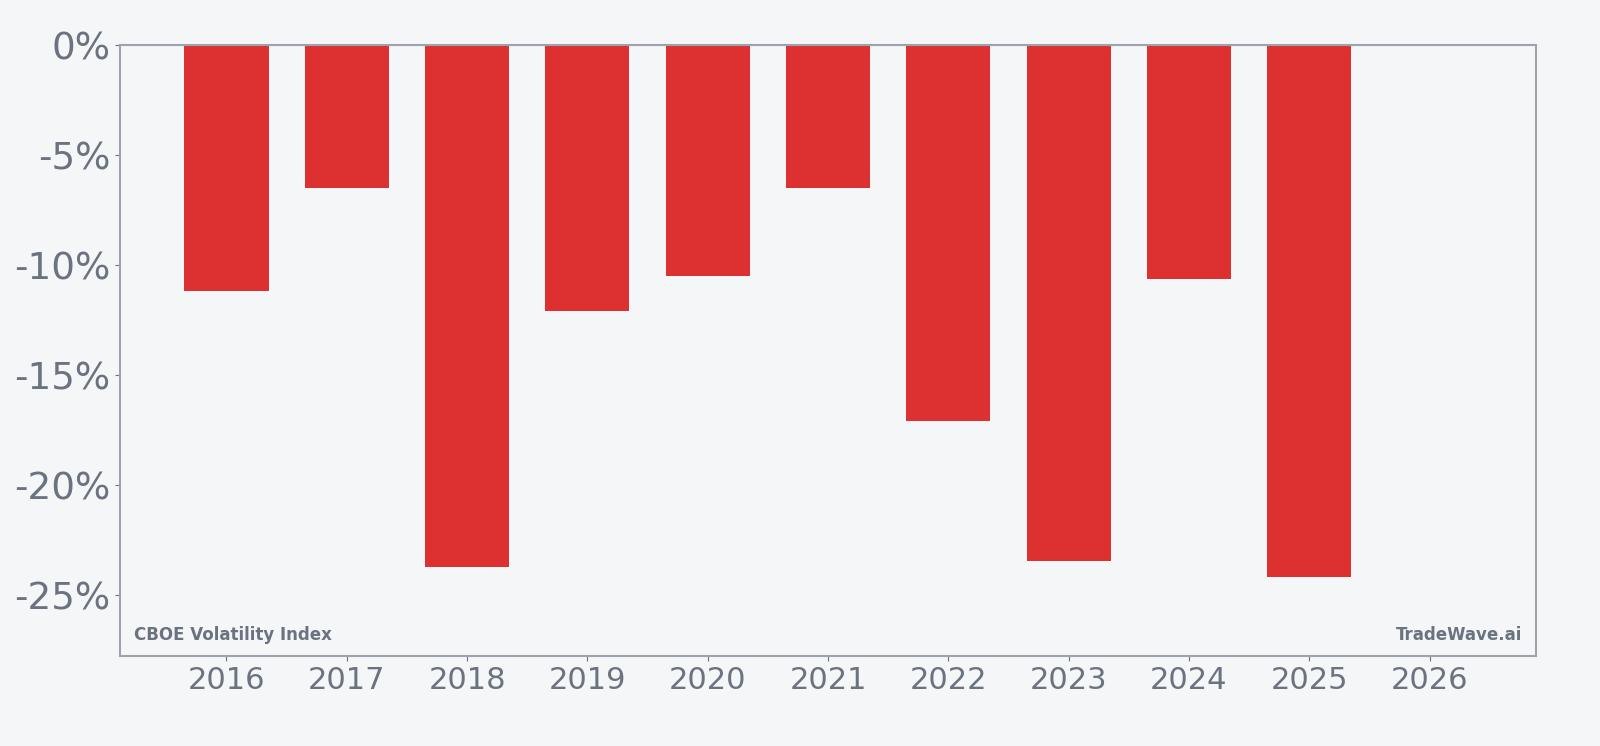
Yearly net and peak moves highlight how often VIX has spiked intraperiod before ultimately finishing lower.
Across the 10‑year sample, every iteration of this window has favored being short volatility. Percent Profitable is 100%, with 10 winners and 0 losers, and the average profit for those short positions is 14.58%, compared with a median profit of 11.62%. The cumulative return across all years is 283%, and the annualized return clocks in at 14.39%, while a Sharpe ratio of 1.97 points to a historically strong risk‑adjusted profile for this specific VIX seasonal trend.
The per‑year table shows how that consistency has played out. The strongest year in the sample was 2025, when a short position in this window would have gained 24.16% as VIX fell from 22.68 to 17.20. The softest outcome was 2017, when the same window still delivered a 6.52% profit for shorts as VIX slipped from 10.59 to 9.90. Even in years with elevated macro stress, such as 2020 and 2022, the pattern held, with VIX finishing the window lower than it started.
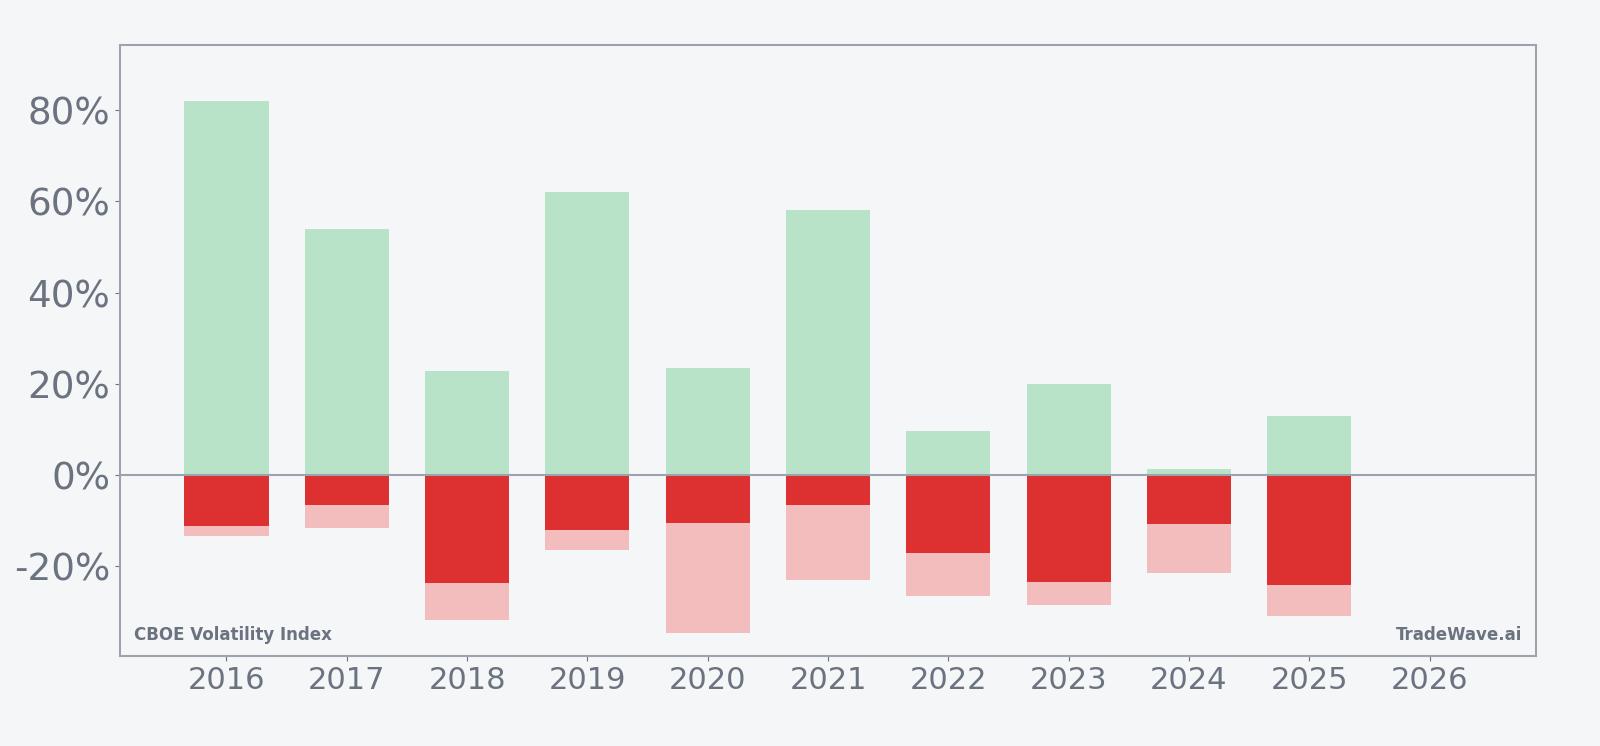
The maximum favorable excursion, or MFE, captures the best intraperiod move in the trade direction. In 2016, for example, the MFE reached 82.02%, meaning VIX at one point moved sharply in favor of short positions before settling into an 11.17% net gain by the end of the window. On the flip side, maximum adverse excursion, or MAE, shows how far VIX moved against shorts inside the window, with readings such as -34.56% in 2020 and -31.68% in 2018 underscoring that even winning years have featured sizable volatility spikes along the way.
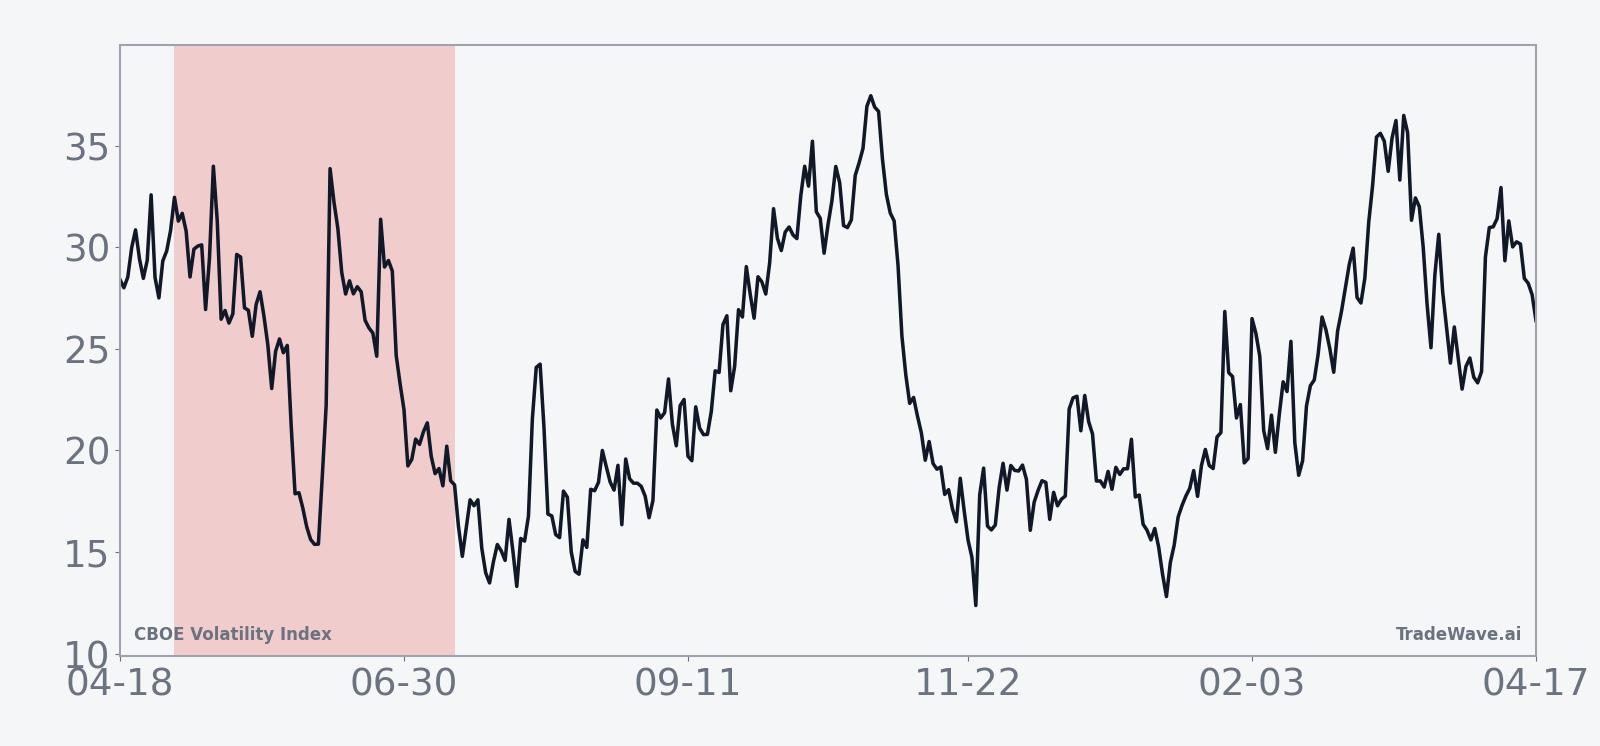
The historical seasonal trend chart suggests that, on average, the bulk of the short‑side gains have tended to accrue gradually rather than in a single air pocket. The average path shows VIX often chopping early in the window, sometimes with a brief volatility flare, before grinding lower into late June and early July. That pattern lines up with a typical equity backdrop where spring macro scares give way to calmer summer trading.
The combined net/MFE/MAE bar chart reinforces that this is not a low‑volatility trade even though the direction has been consistent. Large positive MFE values alongside deep negative MAE readings tell a story of windows where VIX can both spike and fade within the same 73‑day stretch. For traders, the message is that timing and risk management have mattered as much as the overall seasonal bias.
History does not guarantee future results; adverse excursions (MAE) can be large even in winning windows.
Why does CBOE Volatility Index (VIX) follow this seasonal pattern?
One likely driver is the way macro and earnings calendars cluster in the first half of the year, with many of the biggest policy and growth surprises landing before May. By the time this window opens, investors often have clearer visibility on Federal Reserve policy, corporate guidance and geopolitical flashpoints, which can allow implied volatility to bleed lower even if occasional shocks still appear.[2] The pattern may also reflect institutional portfolio repositioning and options‑expiration dynamics that tend to favor selling volatility into early summer once the heaviest risk events have passed.
What is driving CBOE Volatility Index (VIX) today?
CBOE Volatility Index slipped 0.6% to 19.12 on Monday, extending a pullback that has left it about 45.8% below its 52‑week high of 35.30 and comfortably above its 52‑week low of 13.38.[1] The move comes after a stretch of elevated readings tied to geopolitical tensions in the Middle East and ongoing policy uncertainty in Washington, both of which have kept volatility bid even as equity indices have tried to stabilize.[2][3] In this environment, VIX is acting as a barometer of how much risk premium investors still demand for holding stocks into the next wave of macro headlines.
The chart below situates the latest move in its recent multi‑month context and overlays a short‑term seasonal projection.
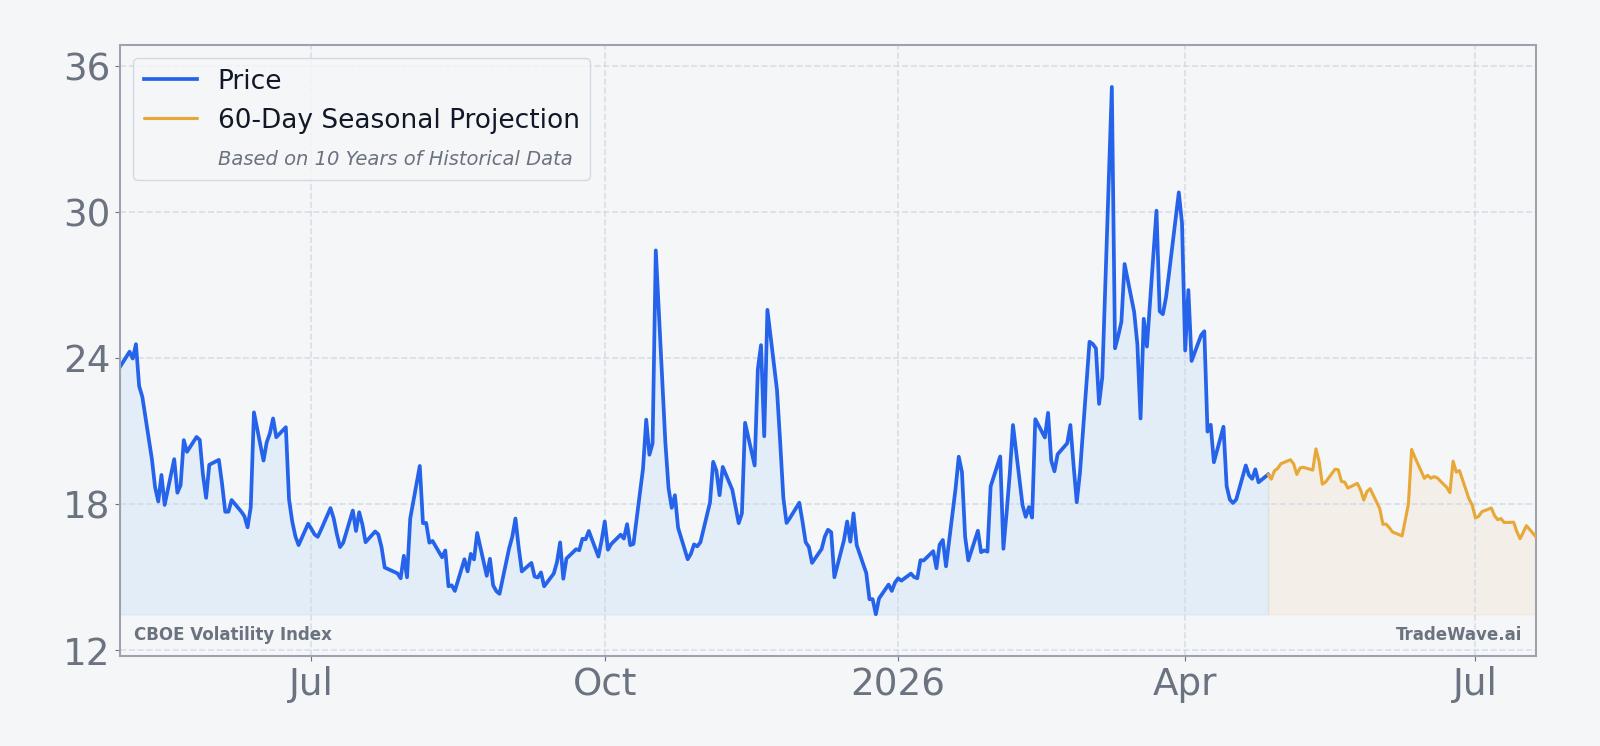
Macro catalysts have repeatedly jolted VIX over the past year. In 2025, episodes such as renewed US‑China trade tensions, tariff threats and confusion over Federal Reserve leadership all triggered sharp volatility spikes as investors scrambled for protection.[4][5][6][7] Those bursts were followed by periods where VIX retreated as fears eased, a pattern that has continued into 2026 with Middle East conflict and shifting policy expectations driving short‑lived surges rather than sustained panic.[2][3]
That push‑and‑pull is typical of a volatility index that tends to jump on negative headlines and then grind lower as markets digest the news. When equities are well supported, implied volatility often compresses, and the historical May‑through‑summer VIX seasonal trend has lined up with that behavior in prior years. For traders, the key into this year’s window will be whether macro shocks keep arriving fast enough to overwhelm the usual early‑summer cooling pattern.
What should traders watch in this VIX seasonal window?
First, watch how VIX behaves as the May 2 window opens relative to its recent range between the mid‑teens and mid‑30s. A sustained move back toward the 52‑week high would signal that macro stress is overpowering the historical tendency for volatility to fade, while a drift toward the mid‑teens would be more in line with the past decade’s seasonal pattern.[1]
Second, monitor the size and timing of intraperiod spikes. The historical MFE and MAE profile shows that even in winning years for short volatility, VIX has often staged sharp rallies before rolling over. If this year’s window features early surges that then reverse, it would rhyme with prior cycles; if spikes keep making higher highs without fading, that would be a clear break from the usual script.
Third, keep an eye on macro catalysts that have historically driven volatility, including trade tensions, Middle East developments and shifts in Federal Reserve expectations.[2][3][4][5][6][7] A quieter tape on those fronts would make it easier for the seasonal pattern to assert itself, while fresh shocks could keep realized and implied volatility elevated even as the calendar moves into what has usually been a softer stretch for VIX.
Finally, watch how equity markets digest any volatility spikes. In prior years, episodes where VIX spiked on trade war headlines or policy scares were often followed by equity recoveries and a retreat in implied volatility.[4][5][6][7] If stocks prove resilient again this spring and summer, the historical VIX seasonal trend toward lower readings would be more likely to reappear; if equities start to crack under the weight of repeated shocks, the pattern could face its toughest test in more than a decade.
Sources
- [1] EODHD, CBOE Volatility Index (VIX) quote and 52-week range (Apr 14, 2026).
- [2] Macro report: "Middle East conflict boosts VIX" (Mar 18, 2026).
- [3] Macro report: "Policy uncertainty keeps VIX elevated" (Jan 13, 2026).
- [4] Macro report: "US-China trade tensions increase VIX" (Oct 20, 2025).
- [5] Macro report: "Confusion over Fed Chair firing impacts VIX" (Jul 16, 2025).
- [6] Business Insider: "Inside the volatility-trading strategy one investor is using to capitalize on Trump market madness" (Apr 29, 2025).
- [7] Macro report: "Tariffs and Middle East tensions elevate VIX" (Jul 31, 2025).
About this seasonal analysis
Seasonal pattern data is sourced from TradeWave.ai, which analyzes historical price behavior across annual calendar windows going back up to 30 years. Read the full data methodology or the book The 100-Year Pattern by Afshin Moshrefi (2026 edition). Past performance of seasonal patterns does not guarantee future results. This article is for informational purposes only and does not constitute investment advice.