10-for-10 Early-Summer Slide: CBOE Volatility Index (VIX) Shorts Averaged 13.93% Profit
CBOE Volatility Index is hovering in the mid-teens just as a 70-day window opens that has historically seen volatility grind lower even when macro headlines stay noisy.
What is the seasonal pattern for CBOE Volatility Index (VIX)?
CBOE Volatility Index has fallen in 10 of 10 years during this 70-day early-summer window, with an average gain for short positions of 13.93% in winning years.
- 10 for 10 in this window: VIX has moved lower in every one of the past 10 years across this 70-day stretch starting May 5, with short trades averaging 13.93% profit.
- High hit rate: Percent Profitable is 100%, with 10 winners and 0 losers for the short-direction setup over the lookback period.
- Size of the move: Median profit for shorts is 15.73%, pointing to a typical double-digit slide in implied volatility once the window gets going.
- Volatility of volatility: The TradeWave Ratio of 3.37 and a Sharpe ratio of 1.67 show that VIX often swings sharply inside the window even as it usually finishes lower.
- Systematic downside bias: Annualized return for the pattern is 13.69% for short exposure, with a cumulative 260% gain across the decade of windows.
- Risk still matters: Individual years have seen sizable adverse spikes in VIX before it rolled over, so timing and risk controls remain critical despite the clean track record.
According to historical data from TradeWave.ai, this early-summer stretch has behaved very differently from an average month on the volatility calendar. The next section walks through what that pattern has looked like and how it frames the coming 70 days for VIX.
How has CBOE Volatility Index (VIX) behaved in this 70-day window?
CBOE Volatility Index has declined in every single 70-day window starting May 5 over the past decade, delivering a 100% win rate for short positions and an average profit of 13.93%. Today VIX closed at 16.7, leaving it about 52.7% below its 52-week high of 35.3 and roughly 24.8% above its 52-week low of 13.38. That combination of a clean historical downside bias and a mid-range starting level makes this year’s window especially relevant for traders who watch volatility seasonality.
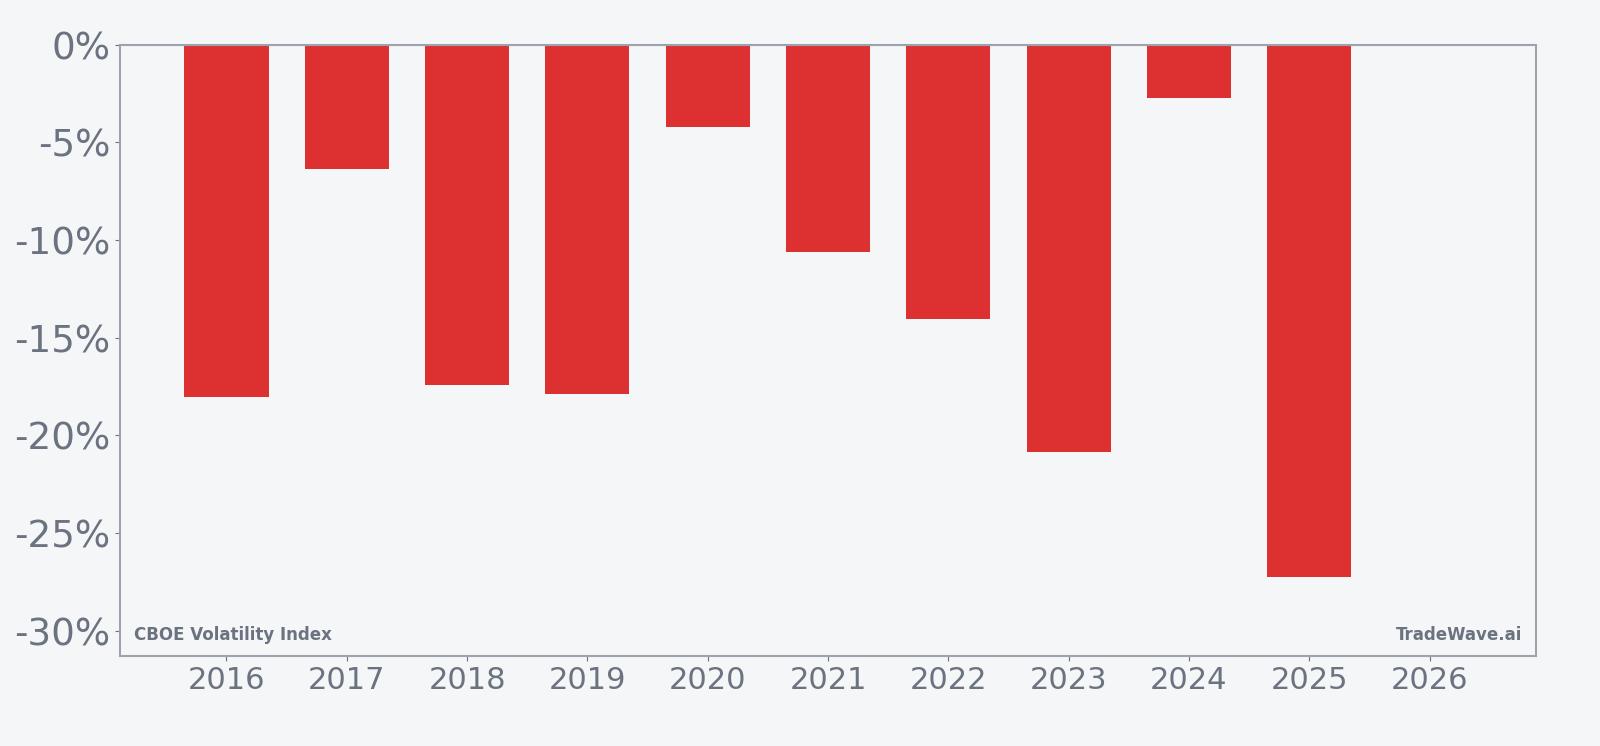
Across the 10-year sample, every May 5 entry for this CBOE Volatility Index trading window would have finished with VIX lower 70 days later, with individual net returns ranging from a modest 2.74% gain for shorts in 2024 to a 27.24% gain in 2025. The median profit of 15.73% suggests that the typical year has delivered a meaningful slide in implied volatility rather than a token drift. For a volatility index, that kind of consistency is unusual and makes this early-summer VIX seasonal trend stand out compared with many other stock pattern analysis setups.
The per-year path shows that even in years with elevated starting levels, such as 2020 and 2022, the index ultimately settled lower by the end of the window. In 2020, for example, VIX entered the window above 30 and still finished down 4.22% over the 70 days, while 2022 saw a 14.04% decline from a similarly high starting point. That behavior suggests the pattern has not depended on calm starting conditions; it has tended to express as a grind lower from both high and mid-range volatility regimes.
A combined view of net results and intraperiod swings shows how far VIX has typically moved in both directions before settling lower.
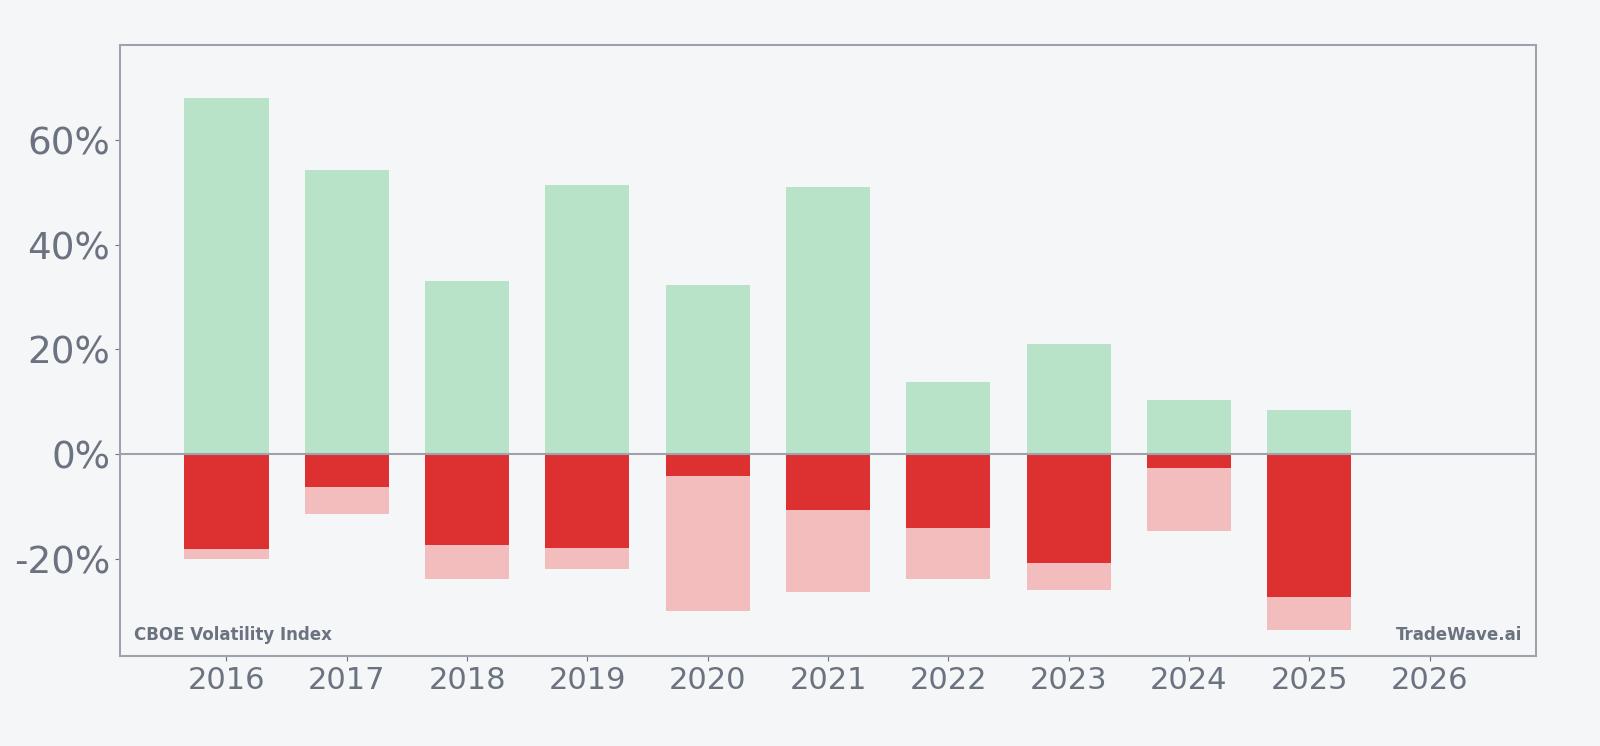
The maximum favorable move in many years has been large, with VIX often spiking 30% to more than 50% above the entry level at some point during the window before rolling over. At the same time, maximum adverse moves against the short direction have also been significant, with several years showing intraperiod drops of more than 20% from entry before any rebound. That mix of big swings in both directions, combined with a TradeWave Ratio of 3.37, points to a high-variance window where volatility traders have historically been rewarded for staying with the short bias but punished if they ignored the risk of sharp interim spikes.
History does not guarantee future results; adverse excursions can be large even in winning windows, and VIX can move sharply on unexpected macro shocks.
Why does CBOE Volatility Index (VIX) follow this seasonal pattern?
One likely driver is the way earnings season and macro news flow thin out into late spring and early summer, which can reduce demand for equity hedges and pull implied volatility lower. Analysts have also pointed to institutional portfolio rebalancing and options expiration patterns that often leave dealers less short gamma into this period, dampening volatility spikes unless a major shock hits. The result is a window where VIX has tended to fade even when occasional headlines briefly jolt markets.
What is driving CBOE Volatility Index (VIX) today?
CBOE Volatility Index slipped 1.1% to 16.7 in the latest session, extending a pullback that has left it about 28.8% below its one-month level and well under the 50-day moving average of 22.34. That puts the so-called fear gauge in a middle zone between its 52-week high of 35.3 and low of 13.38, suggesting equity markets are neither in full risk-on euphoria nor in outright panic. In this environment, investors have been adding protection via VIX call options and put spreads, a sign that some traders are quietly paying up for upside in volatility even as the index drifts lower.[1]
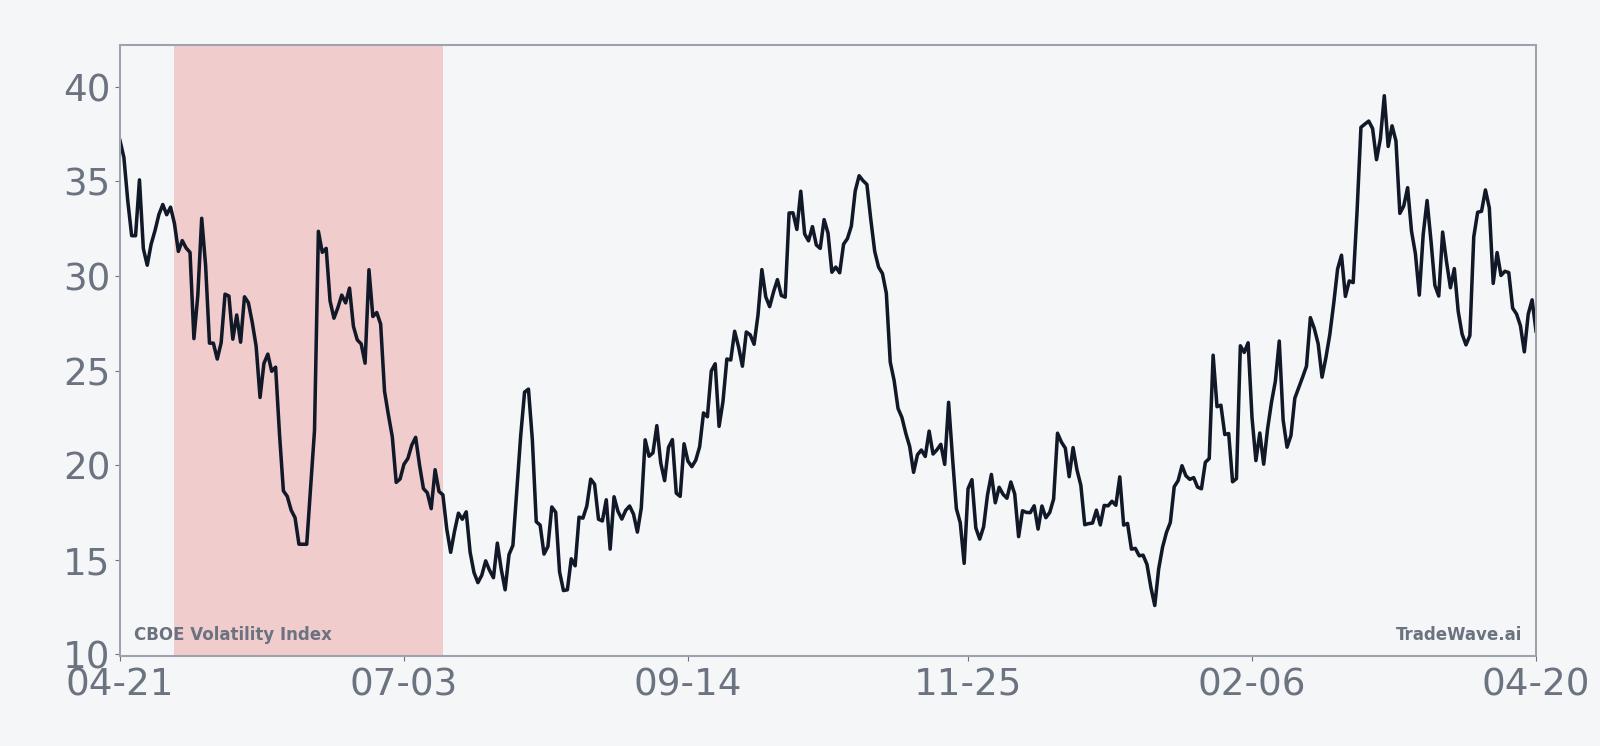
The chart below situates the latest move in its recent multi-month context alongside a 60-day seasonal projection.
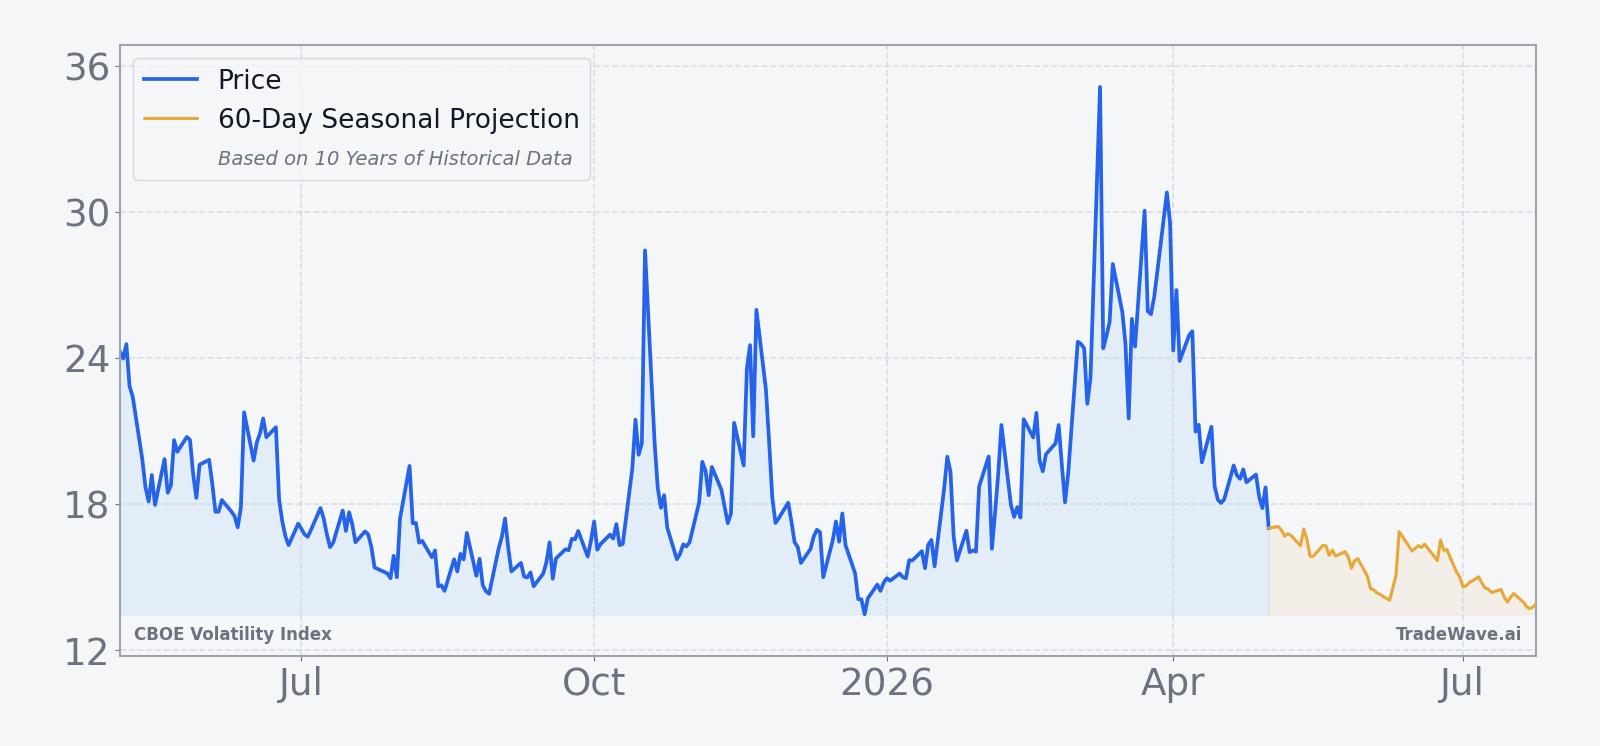
In Oct 2025, market participants focused on AI-related earnings risk saw volatility pick up as investors hedged around results from the largest technology names, underscoring how quickly VIX can react when a single theme dominates the tape.[1] More broadly, episodes such as U.S.-China trade tensions and Middle East conflict have shown that geopolitical shocks can override any typical VIX seasonal trend for days or weeks at a time before the index settles back toward its prevailing regime. For equity traders, the key relationship remains simple: calm, well-supported stock markets tend to compress implied volatility, while abrupt drawdowns or policy surprises can send VIX sharply higher.
What should traders watch in this VIX seasonal window?
For the upcoming 70-day window, the first waypoint is how VIX behaves if it retests the 52-week low zone near 13 to 14. In prior years, the index has often seen brief spikes of 30% to 50% above entry during the window before resuming its grind lower, so any early jump toward the low-20s would not, by itself, contradict the historical pattern. Traders should also track whether the current build-up in VIX call buying and put spreads continues or fades; sustained demand for upside volatility could amplify any macro shock and produce a larger-than-usual intraperiod spike even if the window ultimately finishes lower.[1]
Macro-wise, the main risks to this historical seasonality are surprise geopolitical escalations or abrupt shifts in central bank policy, both of which have previously driven sharp, if temporary, volatility surges. If VIX spends most of the window capped below its 50-day moving average and repeatedly fails to hold rallies, that would be consistent with the decade-long pattern of early-summer volatility compression. A sustained break above the mid-20s that persists for weeks, by contrast, would be a clear sign that this cycle is diverging from the usual script and that traders should treat the historical VIX seasonal trend with extra caution.
Sources
About this seasonal analysis
Seasonal pattern data is sourced from TradeWave.ai, which analyzes historical price behavior across annual calendar windows going back up to 30 years. Read the full data methodology or the book The 100-Year Pattern by Afshin Moshrefi (2026 edition). Past performance of seasonal patterns does not guarantee future results. This article is for informational purposes only and does not constitute investment advice.