CBOE Volatility Index (VIX) Has Dropped 10 of 10 Years in This 26-Day Late-May Window
CBOE Volatility Index is entering a 26-day stretch that has consistently seen volatility grind lower even as today’s level sits far below its 52-week high and options traders pivot toward chasing equity upside.

What is the seasonal pattern for CBOE Volatility Index (VIX)?
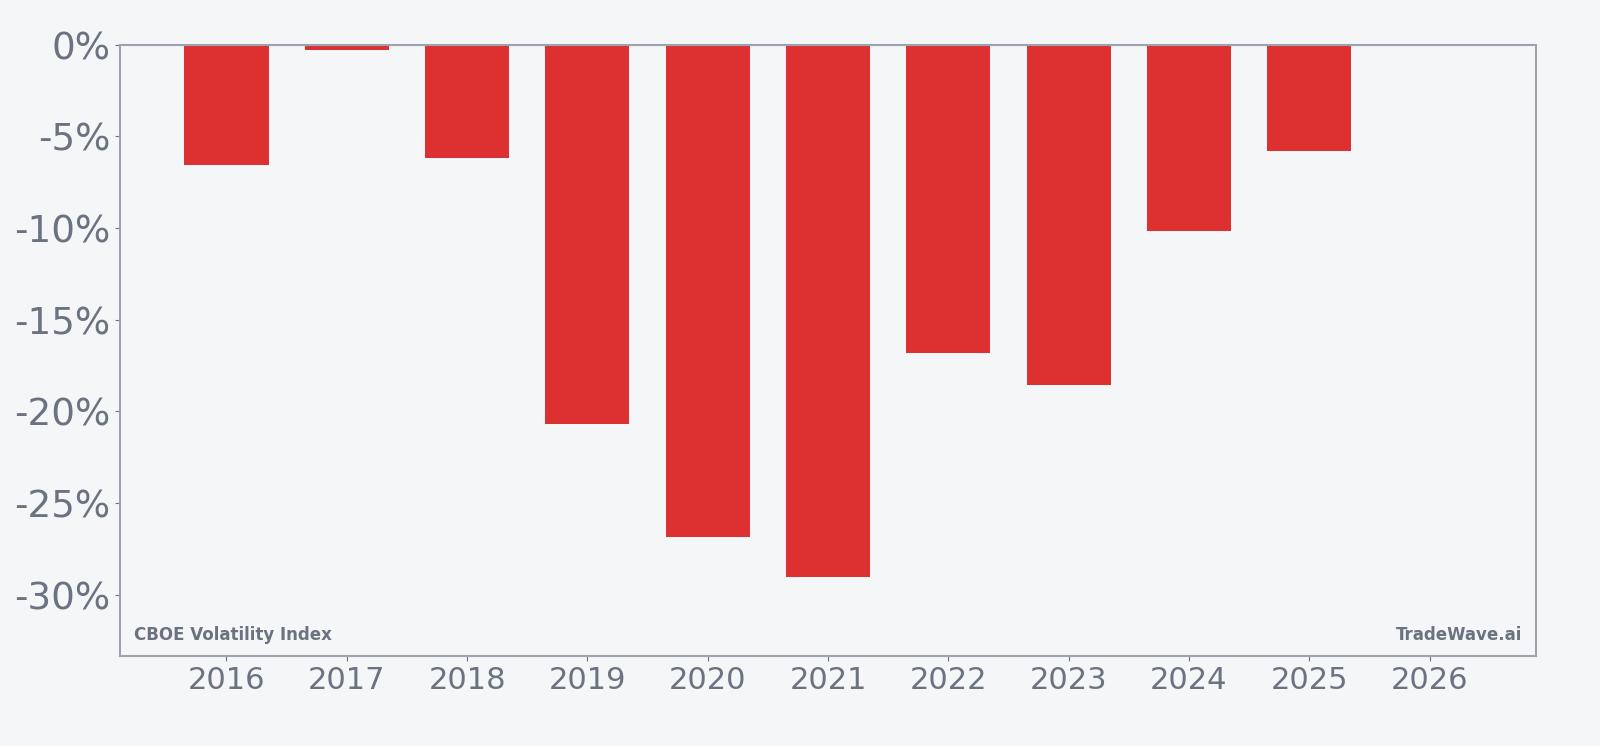
CBOE Volatility Index has fallen in 10 of 10 years during this late-May 26-day window, with an average 14.09% gain for short positions in winning years.
- 10 for 10 in this window, with short positions averaging 14.09% gains across winning years over the past decade.
- The 26-day CBOE Volatility Index trading window begins May 13 and has historically favored volatility compression rather than spikes.
- Percent Profitable sits at 100%, with 10 winners and 0 losers for the short-volatility trade direction in this pattern.
- Average winner returns of 14.09% come with a TradeWave Ratio of 2.03, indicating meaningful intraperiod moves in the trade direction.
- The Sharpe ratio of 1.42 reflects a strong risk-adjusted profile for this VIX seasonal trend despite notable swings inside individual years.
- Intraperiod drawdowns have still been sizable in some years, reminding traders that even “calm” seasonal windows can feature sharp volatility bursts.
According to historical data from TradeWave.ai, this upcoming stretch has behaved very differently from an average month on the volatility calendar, with a clear directional bias that most equity traders rarely track explicitly.
How has CBOE Volatility Index (VIX) behaved in this 26-day seasonal window?
CBOE Volatility Index has declined in every single iteration of this 26-day May window over the past decade, rewarding short-volatility positions 10 years in a row. Today VIX closed at 17.99, down 2.1% on the session and sitting about 49.0% below its 52-week high of 35.3 while still above its 52-week low of 13.38. The combination of a strong historical tendency for volatility to fade in this slice of the calendar and a current level that is elevated versus the year’s floor but far from panic territory gives traders a clean seasonal backdrop to frame near-term risk.
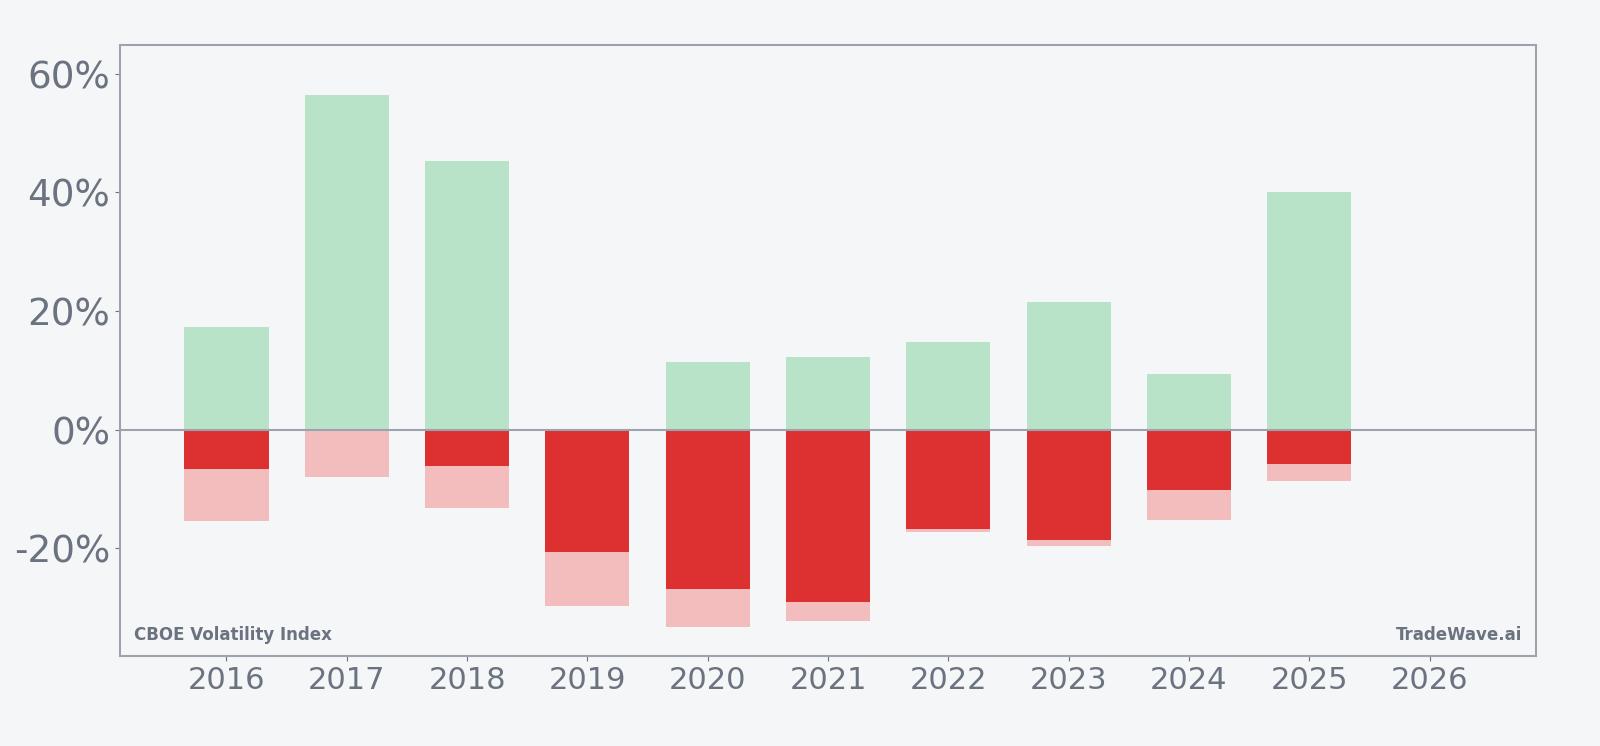
Year-by-year bars with maximum favorable and adverse moves show how often volatility pops before ultimately fading.
Historically this VIX seasonal trend has been unambiguously aligned with the short side. The trade direction is short, and every one of the past 10 years delivered a profitable outcome for that stance, with Percent Profitable at 100%, 10 winners and 0 losers. Average profit across those winning years is 14.09%, while the median sits close by at 13.48%, suggesting the pattern is not just driven by one or two outliers.
The per-year table shows how that plays out in practice. In 2021, for example, VIX fell about 29.01% from entry to exit, one of the strongest years for the pattern, while 2019 delivered a 20.68% decline. Even the softer iterations, such as 2017’s 0.29% drop, still ended in the green for short positions. Add it up: cumulative return across the decade-long sample is 261% for the short-volatility trade in this specific window.
Risk-adjusted metrics back up the raw win rate. The Sharpe ratio of 1.42 indicates that, based on end-of-window outcomes, returns have been strong relative to volatility of results. The TradeWave Ratio of 2.03 signals that VIX typically travels meaningfully in the trade direction within the window, which matters for traders who manage risk or take profits based on intraperiod swings rather than just the final close.
Intraperiod behavior is more nuanced. Maximum favorable excursion, the best point-to-peak move from entry, has at times been explosive on the wrong side for shorts, with years like 2017 and 2018 showing VIX surging more than 45% at some point before rolling over. Maximum adverse excursion, the worst drawdown from entry, has also been deep in several years, with 2020 and 2021 seeing adverse moves beyond 30% before the index ultimately finished lower. This mix of large MFE and large MAE underscores that even a “calm” seasonal window for volatility can feature sharp spikes that punish poor timing.
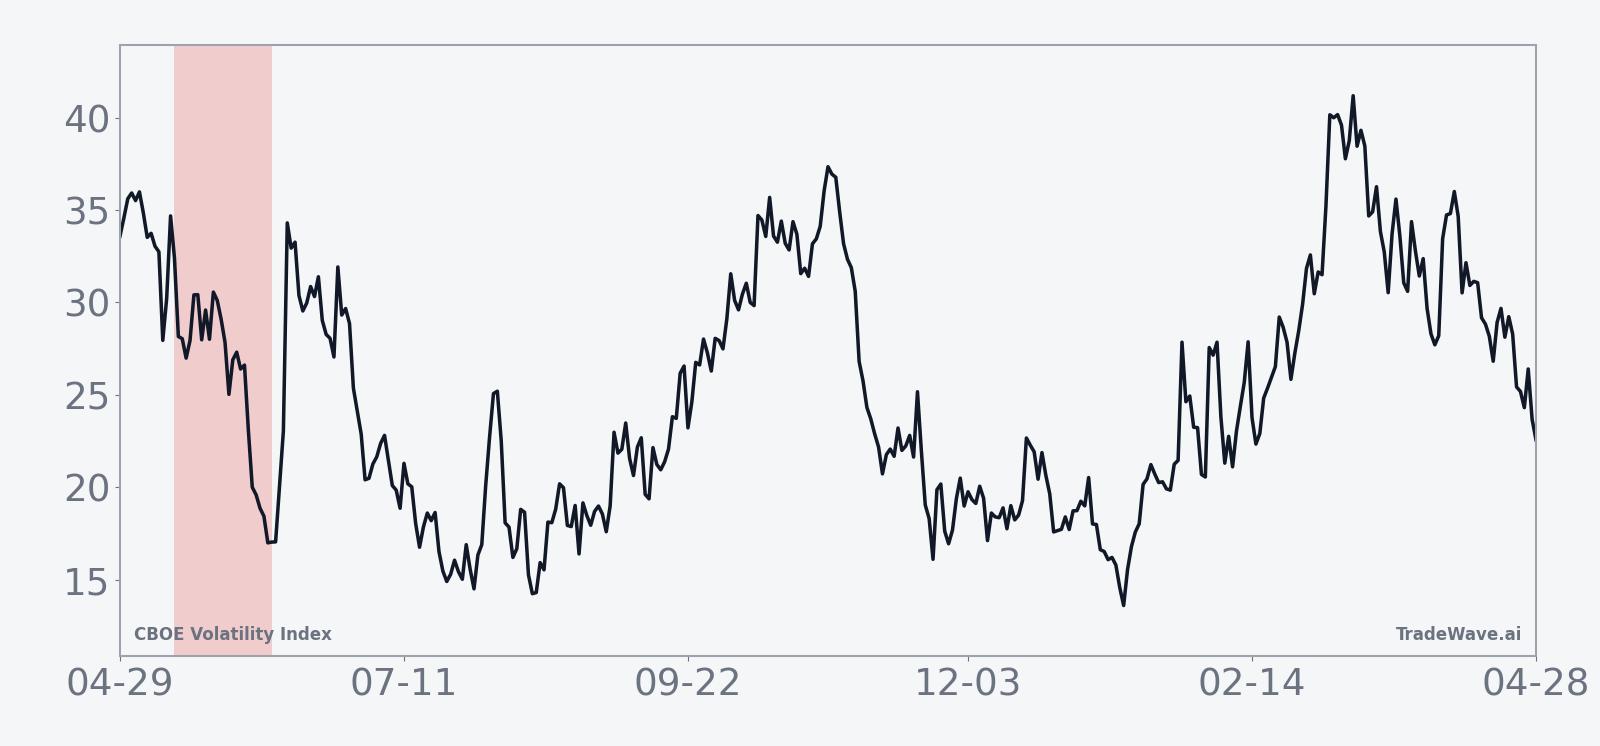
The 10-year seasonal trend chart suggests that, on average, the bulk of the decline tends to accrue in the middle of the window rather than immediately at the start. Early days often show choppy action, with VIX sometimes popping higher before the grind lower takes hold. The cumulative return profile slopes steadily downward across the full 26 days, which lines up with the idea of volatility bleeding out as equity markets stabilize after earlier stress episodes.
Ten for ten with double-digit average gains for shorts is a rare record for any volatility pattern. History does not guarantee a repeat, but the consistency of VIX fading in this exact late-May window is hard to ignore.
Why does CBOE Volatility Index (VIX) follow this seasonal pattern?
One likely driver is the way earnings season and macro data cluster on the calendar. By mid-May, the bulk of large-cap earnings are out and many of the biggest macro surprises are behind the market, which can reduce demand for downside hedges and pull implied volatility lower. Analysts have also pointed to options expiration patterns and institutional portfolio rebalancing as forces that often encourage volatility selling into early summer, especially when equity indices are holding near highs.
History does not guarantee future results; adverse excursions can be large even in winning windows, and volatility spikes inside the pattern have been sharp in several years.
What is driving CBOE Volatility Index (VIX) today?
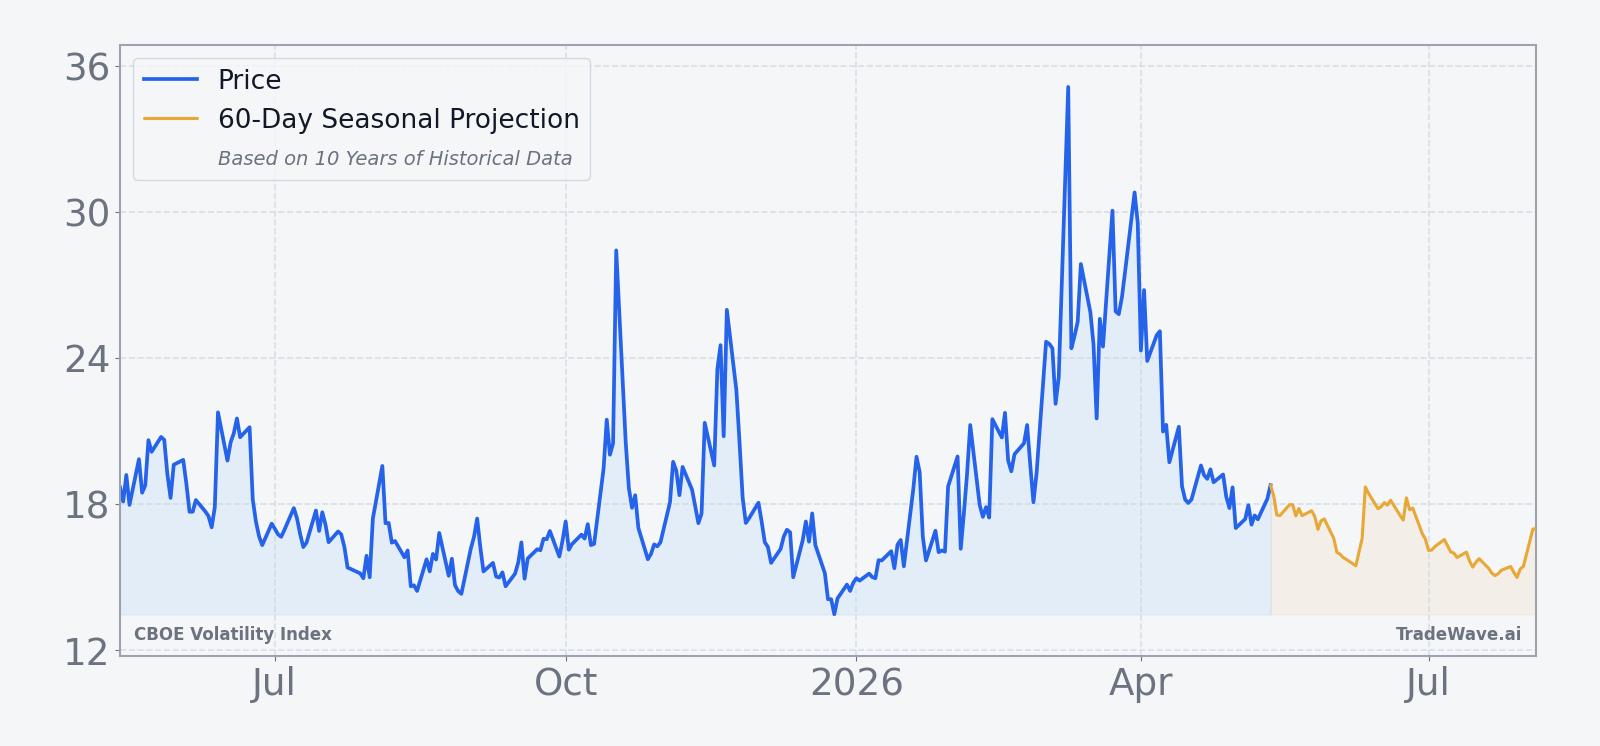
VIX slipped 2.1% to 17.99 on May 13, leaving it roughly 49.0% below its 52-week high of 35.3 and about 34.4% above its 52-week low of 13.38. That level fits a broader backdrop in which volatility has reflected relatively calm markets even as geopolitical risks and inflation worries linger in the background, with prior episodes of hedging around record equity highs giving way to more selective protection as investors lean back into risk.[2] Options traders have been shifting from war-driven hedges toward positioning that chases a tech-led rally into earnings, a pivot that typically aligns with softer implied volatility as demand for deep downside protection cools.[6]
The chart below situates the latest move in its recent multi-month context and overlays the next 60 days of seasonal projections.
For equity traders, the key relationship is straightforward: when stocks grind higher and risk appetite improves, implied volatility often compresses, while abrupt equity drawdowns tend to send VIX sharply higher. The current setup features a VIX that is elevated versus its recent floor but far from crisis territory, heading into a calendar window that has historically favored further compression. If equities continue to hold near highs and options flows stay skewed toward upside participation rather than crash protection, the historical VIX seasonal trend has room to reassert itself.
What should traders watch in this VIX seasonal window?
First, watch how VIX behaves relative to the 15–20 band that has defined much of its recent range. A decisive break back toward the low teens during this 26-day window would be consistent with the historical pattern of volatility bleed, while a sustained push above 20 would mark a clear deviation. Second, monitor options flow and positioning: if the recent shift from war hedges to tech-chasing call activity persists, that would support further implied-volatility compression, but a renewed rush into index puts would argue that the seasonal edge is being challenged.[6]
Third, keep an eye on macro and geopolitical headlines that could upset the pattern. Prior spikes in VIX have been tied to flare-ups in trade tensions, Middle East conflict, and hotter-than-expected inflation data that reset expectations for central bank policy.[3][4] A surprise on any of those fronts could overwhelm the usual May seasonal drift. Finally, equity breadth and sector leadership matter: if the rally narrows to a handful of mega-cap names while the rest of the market softens, VIX can stay sticky even without a full-blown sell-off. The cleanest confirmation that the historical window is playing out would be broad equity strength, steady or rising risk appetite, and a VIX that grinds lower or at least fails to hold any upside spikes.
Sources
- Yahoo Finance: CBOE Volatility Index (^VIX) Historical Data (date unknown).
- Yahoo Finance: CBOE Volatility Index (^VIX) Latest Stock News & Headlines (date unknown).
- CNBC: VIX: CBOE Volatility Index - Stock Price, Quote and News (.VIX) (date unknown).
- Yahoo Finance: CBOE Volatility Index (^VIX) Charts, Data & News (date unknown).
- CNBC: VIX: CBOE Volatility Index - Stock Price, Quote and News (VIX) (date unknown).
- Seeking Alpha: S&P VIX Index (VIX) Stock Price, Quote and News (date unknown).
About this seasonal analysis
Seasonal pattern data is sourced from TradeWave.ai, which analyzes historical price behavior across annual calendar windows going back up to 30 years. Read the full data methodology or the book The 100-Year Pattern by Afshin Moshrefi (2026 edition). Past performance of seasonal patterns does not guarantee future results. This article is for informational purposes only and does not constitute investment advice.