Trade Tensions and Fed Jitters Push CBOE Volatility Index (VIX) Up - Into a Historically Weak Window
CBOE Volatility Index is sitting closer to its 52-week low than its high just as a historically bearish 24-day seasonal window for volatility approaches.

What is the seasonal pattern for CBOE Volatility Index (VIX)?
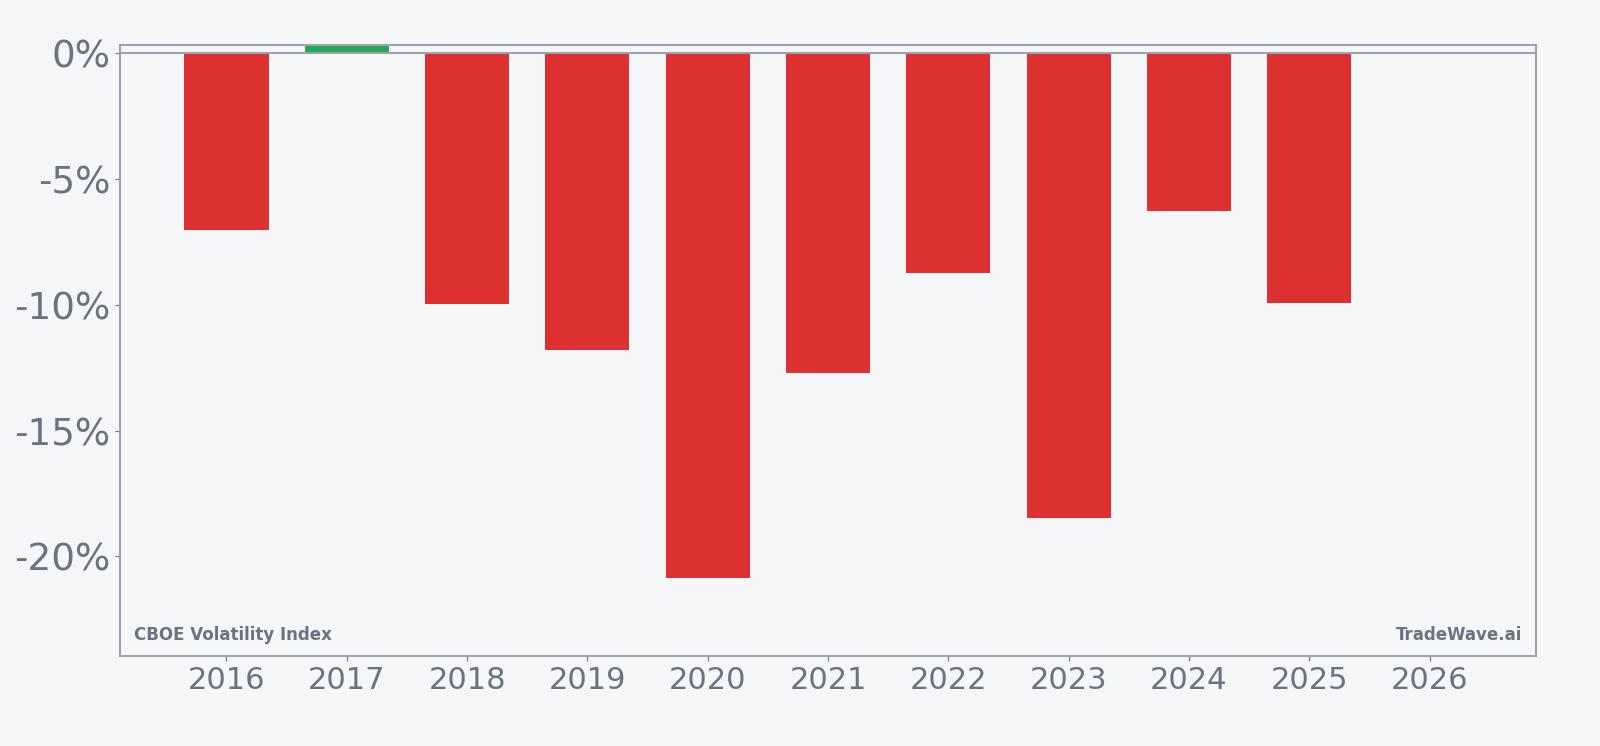
CBOE Volatility Index has fallen in 9 of 10 years during this late-May 24-day window, with an average 11.75% decline in winning years.
- 9 for 10 in this window, with VIX declining an average 11.75% in the years when the pattern worked.
- Percent Profitable sits at 90%, with 9 winners and just 1 loser across the past decade.
- Including every year, Avg Profit - All is still a hefty 11%, underscoring a strong bearish VIX seasonal trend.
- The upcoming CBOE Volatility Index trading window runs from May 14 for 24 trading days, historically favoring short volatility exposure.
- Maximum favorable moves have often been large, but adverse excursions within the window have also been meaningful in several years.
- TradeWave Ratio of 2.47 and a Sharpe ratio of 1.71 point to a historically efficient short-volatility setup in this slice of the calendar.
According to historical data from TradeWave.ai, this mid-May window has behaved very differently from an average month on the volatility calendar, and the next iteration is just days away.
How has CBOE Volatility Index (VIX) behaved in this late-May seasonal window?
CBOE Volatility Index has dropped in 9 of the past 10 years during the 24 trading days starting May 14, with an average 11.75% decline in the winning years and an 11% average move when every year is included. Today VIX closed at 17.08, down 1.8% on the session and sitting about 48.4% below its 52-week high of 35.30 and roughly 27.6% above its 52-week low of 13.38. That combination of a historically bearish VIX seasonal pattern and a spot level already in the lower half of its one-year range gives equity traders a clean reference point for how much more implied volatility has tended to compress in prior late-May windows.
Trade direction for this setup is explicitly short, which means years where VIX drifted or broke lower were favorable for the pattern, while upside spikes were losing years. Across the decade, the single outlier year on the wrong side of the pattern still produced only a modest 0.29% net gain in VIX, while the strongest year saw a 20.85% decline from entry to exit. Add it up: cumulative return for the short-volatility approach in this window is 168%, with an annualized return of 10.4% and a Sharpe ratio of 1.71, which is high for a volatility index.
The per-year table shows how those moves played out in practice. In 2020, for example, VIX started the window at 32.61 and finished at 25.81, a 20.85% drop that lined up with a period of post-crisis calm after the early pandemic shock. In 2019, the index fell 11.79% over the window, from 18.06 to 15.93, again rewarding traders who were positioned for volatility to bleed lower as equities stabilized. The weakest year for the short setup was 2017, when VIX finished the window up just 0.29%, moving from 10.42 to 10.45.
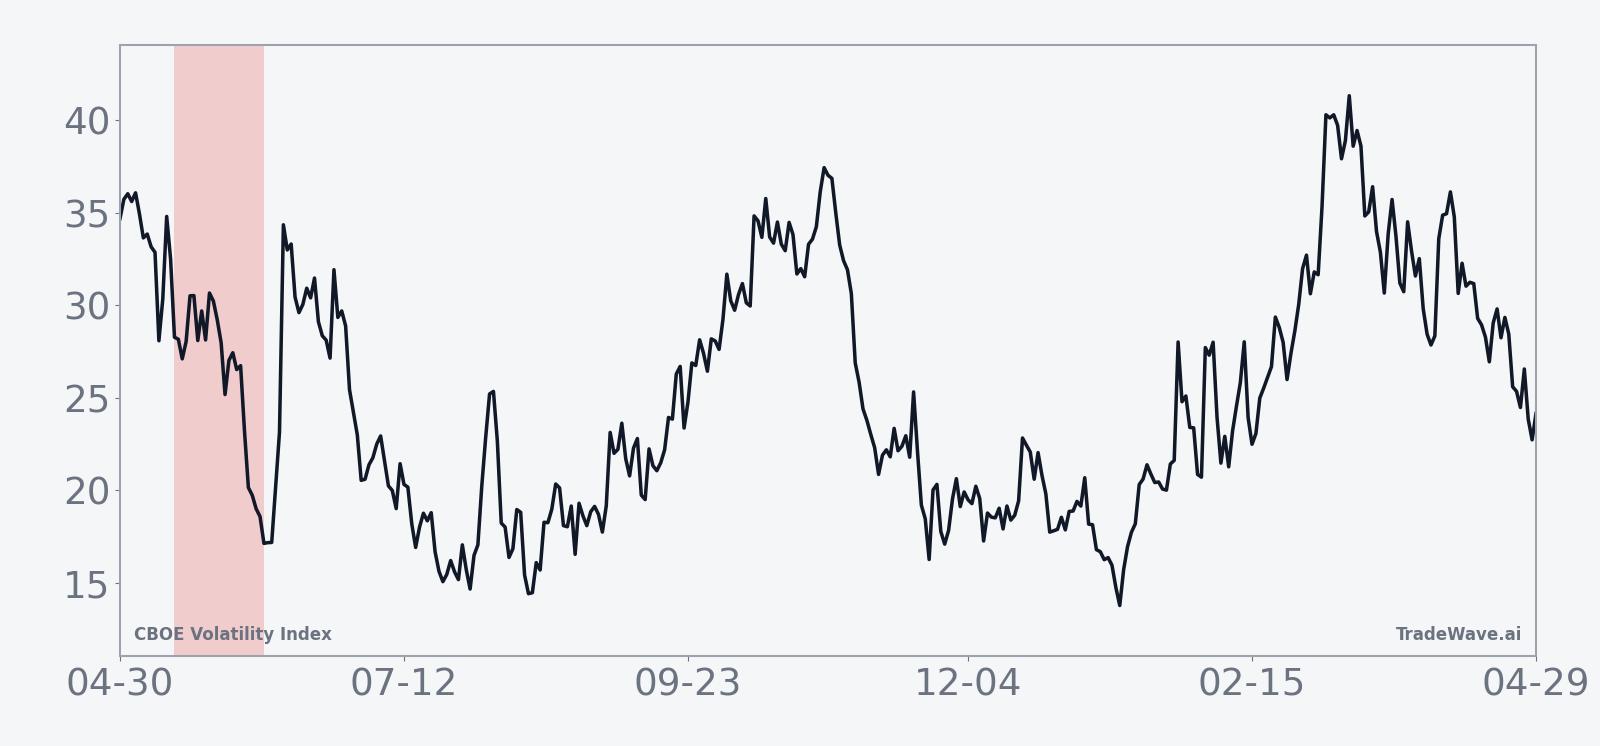
The historical seasonal average shows VIX typically easing fairly steadily through the middle of the window, with the bulk of the decline accruing after the first week. That profile fits a pattern where early jitters around macro headlines or options expiries fade, leaving implied volatility to grind lower as realized equity volatility stays contained. The cumulative return chart for the window slopes consistently in favor of the short side, with only brief pauses rather than prolonged reversals.
A second view that combines net results with best and worst intraperiod swings shows how much room VIX has historically had to move inside the window.
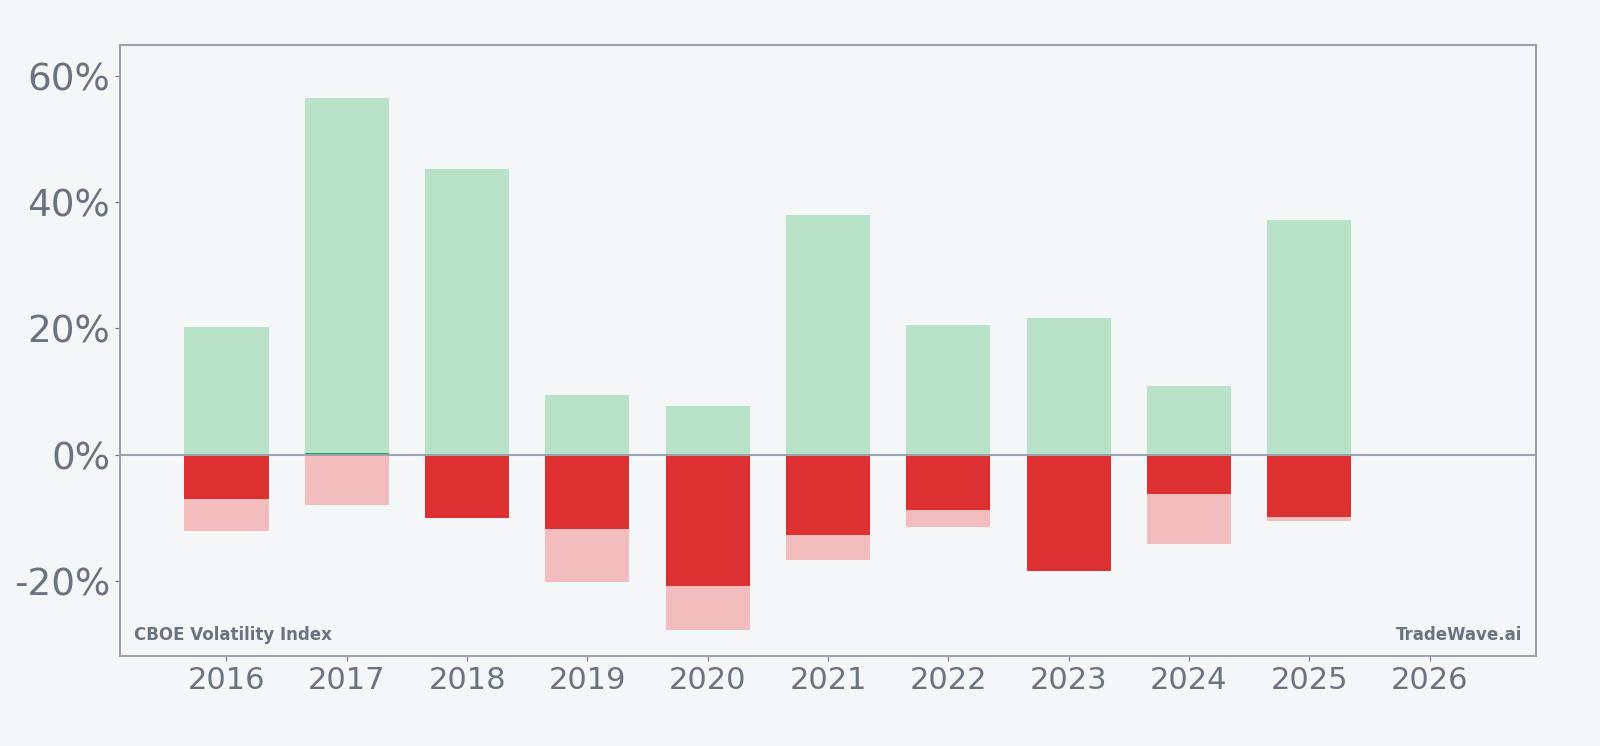
The maximum favorable excursion numbers show that in strong years VIX has often dropped far more than the final close-to-close result, with several windows seeing intraperiod declines of more than 20% before partial rebounds. On the flip side, maximum adverse excursions have at times been sharp, with years like 2020 showing a worst drawdown of 27.81% against the short position before the index ultimately finished lower. That mix of large best-case and worst-case swings is captured in the TradeWave Ratio of 2.47, which measures how far price typically travels in the trade direction within the window, independent of the final close.
History does not guarantee a repeat, but the pattern is clear: this late-May window has favored short volatility in 9 of 10 years, and when it works, it has tended to work with double-digit percentage declines in VIX.
Why does CBOE Volatility Index (VIX) follow this seasonal pattern?
This late-May seasonal pattern may reflect a cluster of options expirations and portfolio rebalancing that often follow the early part of the second-quarter earnings lull. Analysts have pointed to a tendency for realized equity volatility to compress after spring macro events, which can pull implied volatility lower as hedges decay. The result is a recurring window where VIX has historically bled off risk premium as markets shift into a quieter early-summer regime.
History does not guarantee future results, and maximum adverse excursions within this window have at times been large even in years that ultimately finished as winners for the short-volatility pattern.
What is driving CBOE Volatility Index (VIX) today?
CBOE Volatility Index slipped 1.8% on May 8 to close at 17.08, extending a roughly 12.37% decline over the past month and leaving the gauge well below its 50-day moving average of 22.20. That puts VIX closer to its 52-week low of 13.38 than its high of 35.30, a setup that often signals investors are pricing in a relatively calm near-term equity backdrop even as geopolitical and policy risks linger in the background. In January 2026, strategists warned that unusually low cross-asset correlations could set the stage for a volatility spike as policy uncertainty around the Federal Reserve and fiscal debates builds later in the year, prompting some to recommend hedging with VIX call options rather than assuming calm will persist indefinitely.[1]
The chart below situates the latest move in its recent multi-month context and overlays the upcoming 60-day seasonal projection.
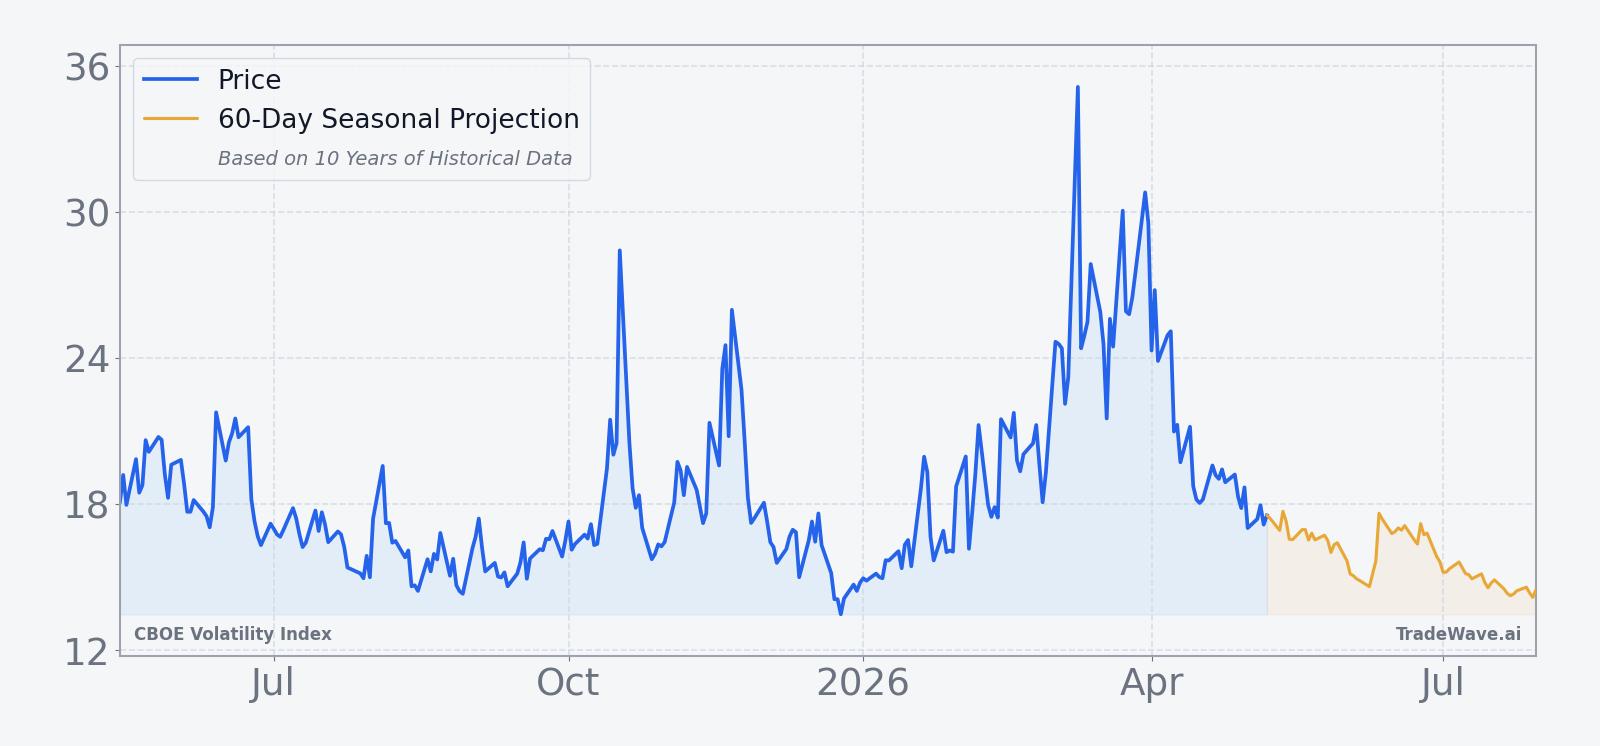
For equity traders, the key tension is straightforward. VIX is already subdued relative to the past year, yet the historical seasonality points to a window where implied volatility has often compressed even further. Because VIX typically falls when equities grind higher and rises when stocks sell off, a repeat of the historical pattern would align with a period of resilient risk appetite into early summer. A break from that script, especially if driven by renewed trade tensions, Middle East headlines, or a shift in expectations for Federal Reserve policy, would be an early sign that this cycle is diverging from the usual late-May playbook.[1]
Sources
About this seasonal analysis
Seasonal pattern data is sourced from TradeWave.ai, which analyzes historical price behavior across annual calendar windows going back up to 30 years. Read the full data methodology or the book The 100-Year Pattern by Afshin Moshrefi (2026 edition). Past performance of seasonal patterns does not guarantee future results. This article is for informational purposes only and does not constitute investment advice.