15-for-15: Nasdaq 100 (NDX) Enters a 40-Day Early-Summer Window Averaging 4.55% Gains
Nasdaq 100 is trading just above its 52-week high as it heads toward a 40-day early-summer seasonal window that has never been negative in the past 15 years, a stretch that has often amplified tech-led momentum.

What is the seasonal pattern for Nasdaq 100 (NDX)?
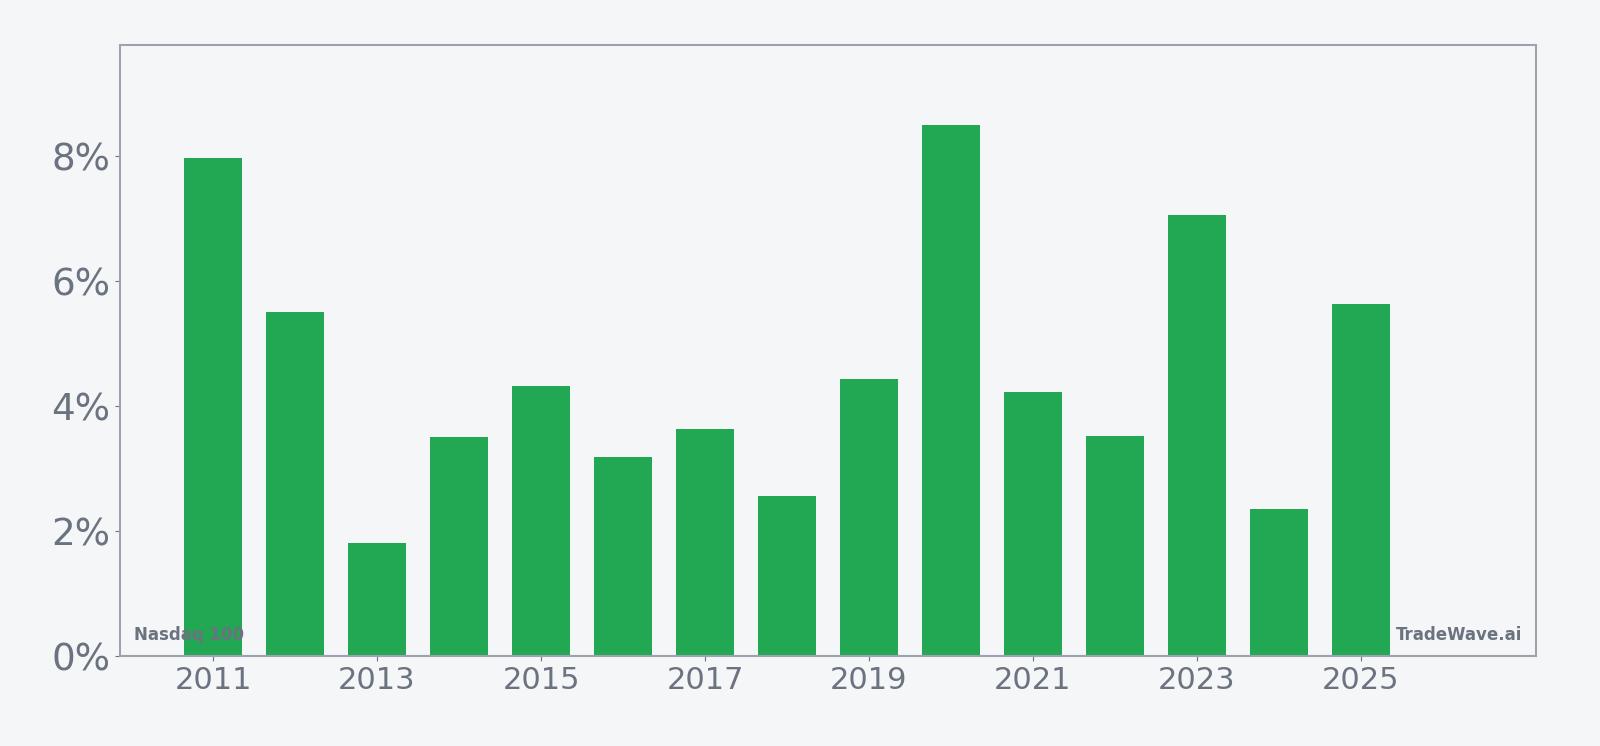
Nasdaq 100 has risen in 15 of 15 years during this early-summer 40-day window starting Jun 10, with an average gain of 4.55% in winning years.
- 15 for 15 in this window, with Nasdaq 100 averaging 4.55% gains in winning years across the past 15 cycles.
- Seasonal window runs from Jun 10 for 40 trading days, capturing an early-summer stretch that has consistently favored long exposure.
- Percent Profitable is 100%, with 15 winners and 0 losers over the lookback period.
- Average profit of 4.55% in this Nasdaq 100 trading window compares with a cumulative 94% gain across all 15 iterations.
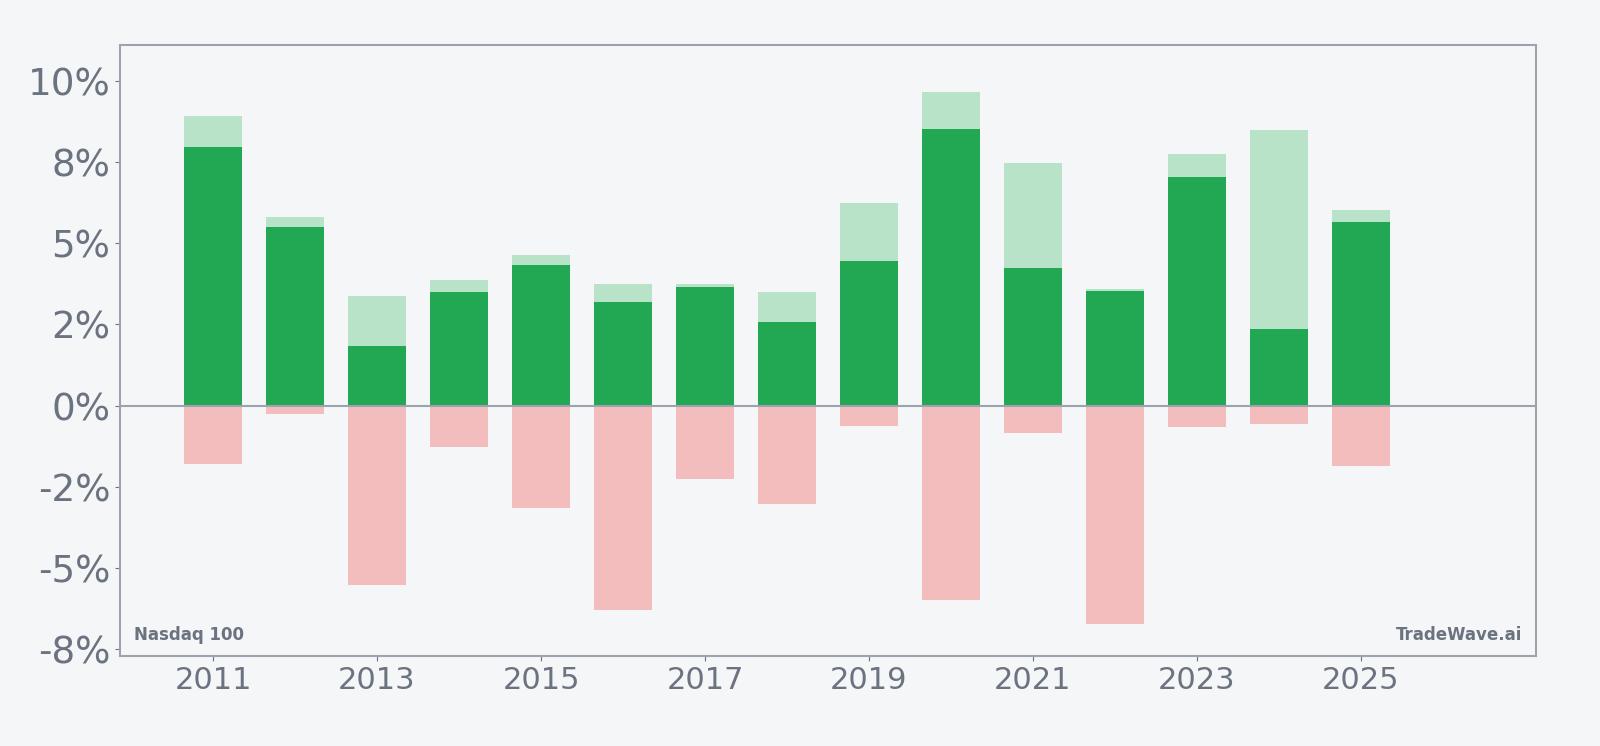
- Intraperiod swings have been meaningful, with individual years showing adverse moves of more than 6% even as the window ultimately finished higher.
- TradeWave Ratio of 2.43 and a Sharpe ratio of 2.05 point to a historically strong, risk-adjusted seasonal trend for this tech-heavy index slice.
According to historical data from TradeWave.ai, this upcoming early-summer stretch has behaved very differently from an average month on the calendar for the Nasdaq 100. The next section walks through how that pattern has played out and what it could mean for traders watching the index today.
How has Nasdaq 100 (NDX) traded in this early-summer seasonal window?
Nasdaq 100 has posted gains in every single early-summer window over the past 15 years, averaging a 4.55% rise across this 40-day stretch. Today the index closed at 29,580.30, up 0.7% on the session and sitting about 0.7% above its 52-week high of 29,372.43, underscoring how strong the current backdrop is heading into the next iteration of this pattern.
Year-by-year net returns and intraperiod swings show how consistently this window has leaned higher, even when drawdowns have been sharp.
Trade direction for this pattern is long, and the record is unusually clean: 15 winners, 0 losers, and a 100% hit rate across the lookback. Average profit of 4.55% in the window compares with a median gain of 4.22%, which tells you the distribution has been tight rather than driven by a single outlier year.
The per-year table shows how that plays out in practice. In 2020, for example, the index gained 8.5% from entry to exit, with a maximum favorable move of 9.66% and a worst intraperiod drawdown of 5.99%. In 2016, the net gain was a more modest 3.19%, but the worst drawdown inside the window reached 6.31%, illustrating how the path can be bumpy even when the finish is positive.
The maximum favorable excursion profile is consistently strong. Several years, including 2019, 2020, 2021 and 2023, saw peak run-ups between roughly 6% and 10% before the window closed. That lines up with a TradeWave Ratio of 2.43, which measures how far price typically travels in the trade direction within the window, independent of the final close.
On the downside, maximum adverse excursions have not been trivial. Years like 2016, 2020 and 2022 all saw intraperiod drops of roughly 6% from the entry level before recovering into positive territory. For traders, that means the historical pattern has rewarded patience, but it has also tested conviction along the way.
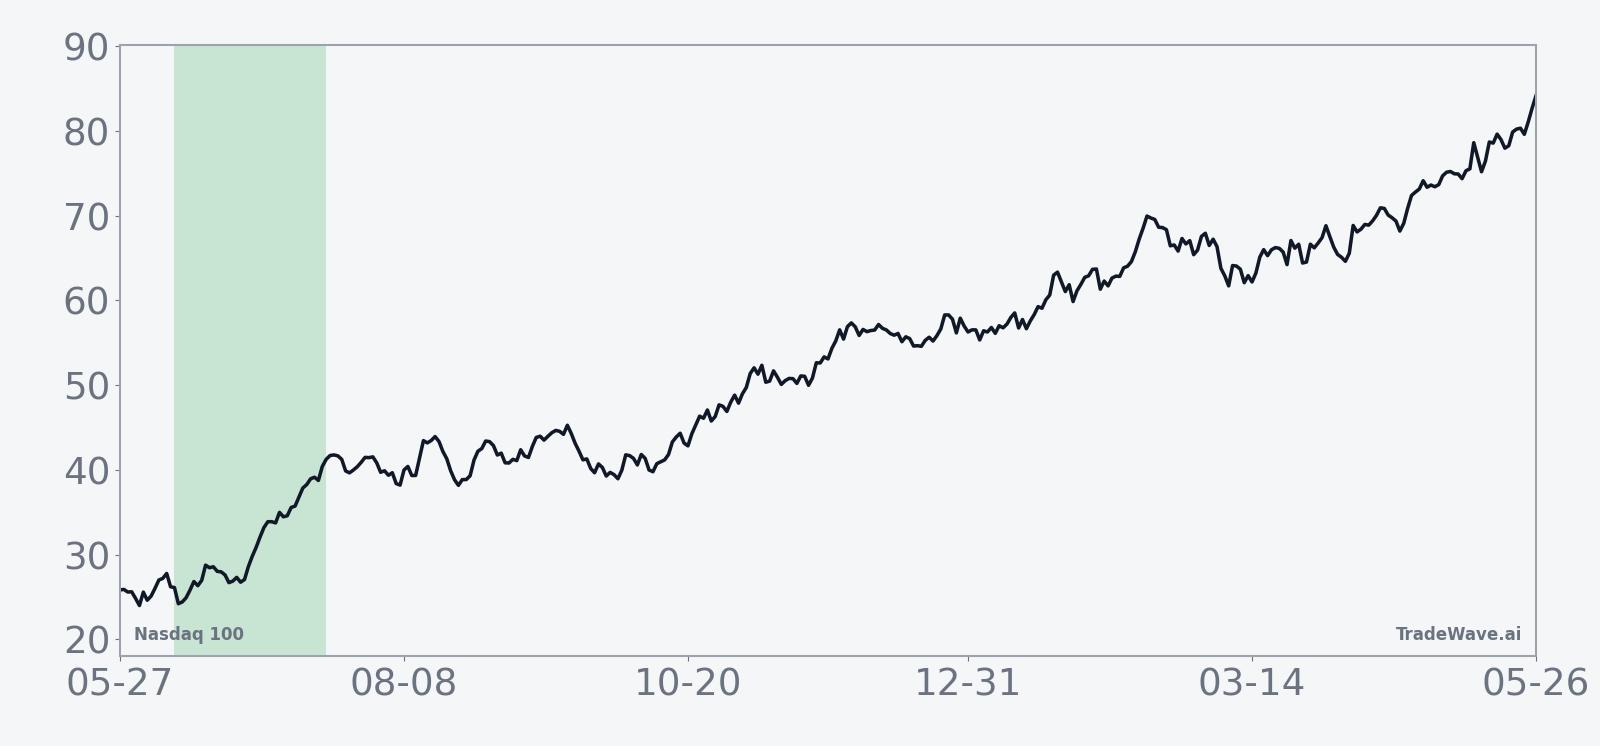
The 15-year seasonal trend chart suggests gains tend to build steadily rather than in a single burst. The average path shows a mild positive drift in the first couple of weeks, followed by a stronger upswing into the back half of the window. That late-window acceleration has been a recurring feature in several of the strongest years.
The cumulative return line across all 15 iterations adds up to a 94% total gain for this specific slice of the calendar. Add it up: that is nearly a doubling of value across the sample, generated solely by this recurring 40-day early-summer window.
History does not guarantee future results; adverse excursions can be large even in winning windows, and traders should be prepared for meaningful drawdowns inside the pattern.
Why does Nasdaq 100 (NDX) follow this seasonal pattern?
One likely driver is the way the tech earnings calendar and guidance updates cluster in late spring and early summer, often resetting expectations after the first-quarter reporting season. Institutional portfolio rebalancing and index changes around midyear can also funnel flows into the largest Nasdaq 100 names during this period. The pattern may further reflect options expiration dynamics and systematic strategies that lean into momentum when the index is already trading near highs, reinforcing early-summer strength.
What is driving Nasdaq 100 (NDX) today?
Nasdaq 100 finished Monday at 29,580.30, up 213.36 points or 0.7% on the day, with intraday trade confined between 29,350.10 and 29,678.89. The index is trading about 48.0% above its 52-week low of 19,984.53 and roughly 0.7% above its 52-week high of 29,372.43, underscoring how aggressively investors have bid up the tech-heavy benchmark over the past year.
The chart below situates the latest move against the past year of price action and a 60-day seasonal projection.
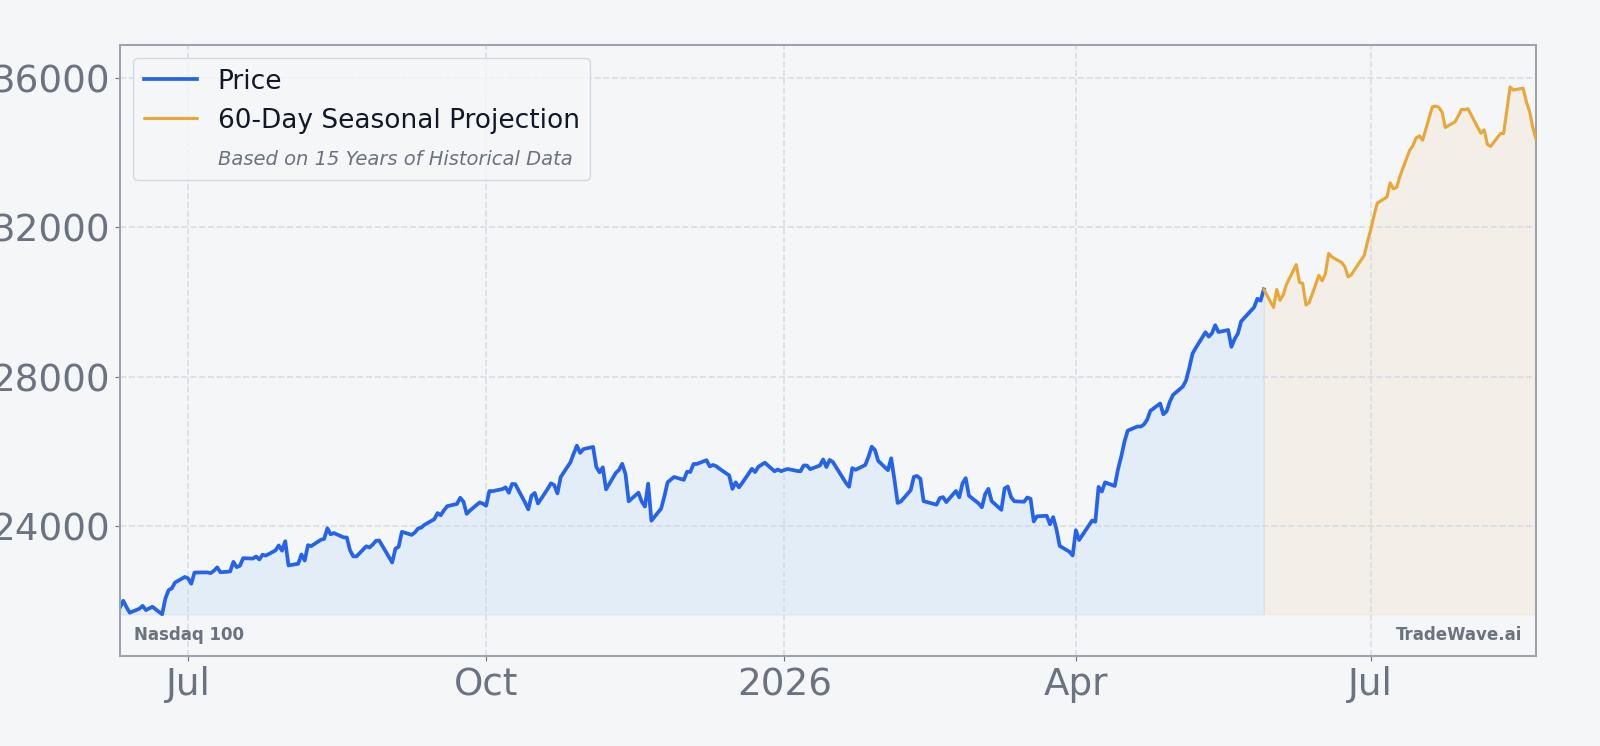
From a trend perspective, the index is also extended versus its medium-term moving average. The current level sits well above the 50-day simple moving average of 25,606.30, reflecting a powerful uptrend that has left little room for error if sentiment shifts. One-month performance of 15.51% shows how quickly the rally has accelerated into May, compressing what might normally be a quarter’s worth of gains into a few weeks.
That backdrop matters for the seasonal setup. A strong historical window is approaching at a time when the Nasdaq 100 is already near records and far above its recent trend line. If the index continues to respect its early-summer seasonal pattern, traders may see another leg higher layered on top of an already stretched move. If it breaks from that pattern, the combination of elevated price and sizable historical intraperiod drawdowns suggests volatility could pick up as the window unfolds.
What should traders watch as this Nasdaq 100 seasonal window approaches?
First, watch how the index behaves as Jun 10 approaches relative to its 50-day moving average. A continued gap above that trend line would mean the early-summer window is starting from a position of strength, while a pullback toward the average would echo prior years where the pattern still finished higher despite early weakness.
Second, monitor intraday swings once the window opens. Historical maximum adverse excursions of roughly 6% in some years show that even a “perfect” 15-for-15 record has come with real downside tests along the way. If early dips remain shallow and are bought quickly, that would be consistent with the stronger years in the sample. Deeper, persistent drawdowns would signal that this iteration is tracking closer to the more volatile historical paths.
Third, pay attention to leadership inside the index. The Nasdaq 100’s seasonal strength has often coincided with mega-cap tech and growth stocks extending existing trends rather than reversing them. If breadth narrows sharply to just a handful of names or rotates into more defensive components, that would be a sign the seasonal tailwind is interacting with a changing sector backdrop.
Finally, compare realized volatility in the window to the historical pattern. The early-summer stretch has tended to reward long exposure but with meaningful swings along the way. If realized volatility spikes while the index still grinds higher, the pattern would be holding in direction but not in smoothness. If volatility rises and price fails to recover from early setbacks, that would mark a clear break from the 15-year NDX seasonal trend and could force traders to rethink how much weight to put on this particular slice of the calendar.
Sources
- [1] Reuters, “Nasdaq proposes 'fast entry' rule to speed up inclusion of large new listings,” Feb 4, 2026.
- [2] Reuters, “Nasdaq 100 notches first record high close since February,” Jun 24, 2025.
About this seasonal analysis
Seasonal pattern data is sourced from TradeWave.ai, which analyzes historical price behavior across annual calendar windows going back up to 30 years. Read the full data methodology or the book The 100-Year Pattern by Afshin Moshrefi (2026 edition). Past performance of seasonal patterns does not guarantee future results. This article is for informational purposes only and does not constitute investment advice.