Nasdaq 100 (NDX) Has Rallied in All 15 June-July Windows, Averaging 4.55% Gains
Nasdaq 100 is trading just under record territory as it heads toward a June 10 seasonal window that has quietly delivered gains in every year of the past 15.

What is the seasonal pattern for Nasdaq 100 (NDX)?
Nasdaq 100 has risen in 15 of 15 years during this June 10–July 40-day window, with an average gain of 4.55% in winning years.
- 15 for 15 in this window, with Nasdaq 100 averaging 4.55% gains in winning years across the past decade and a half.
- The seasonal stretch begins Jun 10 and runs for 40 trading days, forming a historically bullish Nasdaq 100 trading window.
- Percent Profitable is 100%, with 15 winners and 0 losers over the 15-year lookback.
- Trade Direction is long, supported by a TradeWave Ratio of 2.43 and a Sharpe ratio of 2.05 for this pattern.
- Individual years have seen strong upside bursts, with maximum favorable moves reaching as high as 9.66% inside the window.
- Even winning years have included meaningful drawdowns, with adverse excursions as deep as about 6% before recovering.
According to historical data from TradeWave.ai, this early-summer stretch has behaved very differently from an average month on the Nasdaq 100 calendar. The next section looks at how that pattern has played out and where the risks have shown up inside the window.
How has Nasdaq 100 (NDX) traded in this June–July seasonal window?
Nasdaq 100 has posted gains in all 15 years of this June 10, 40-day seasonal window, with average profits of 4.55% and a long trade bias. The index last closed at 29,234.99, up 2.35% on the day and sitting about 0.5% below its 52-week high of 29,372.43.[1] That combination of a clean win streak and prices near record territory makes this upcoming Nasdaq 100 seasonal trend hard for traders to ignore.
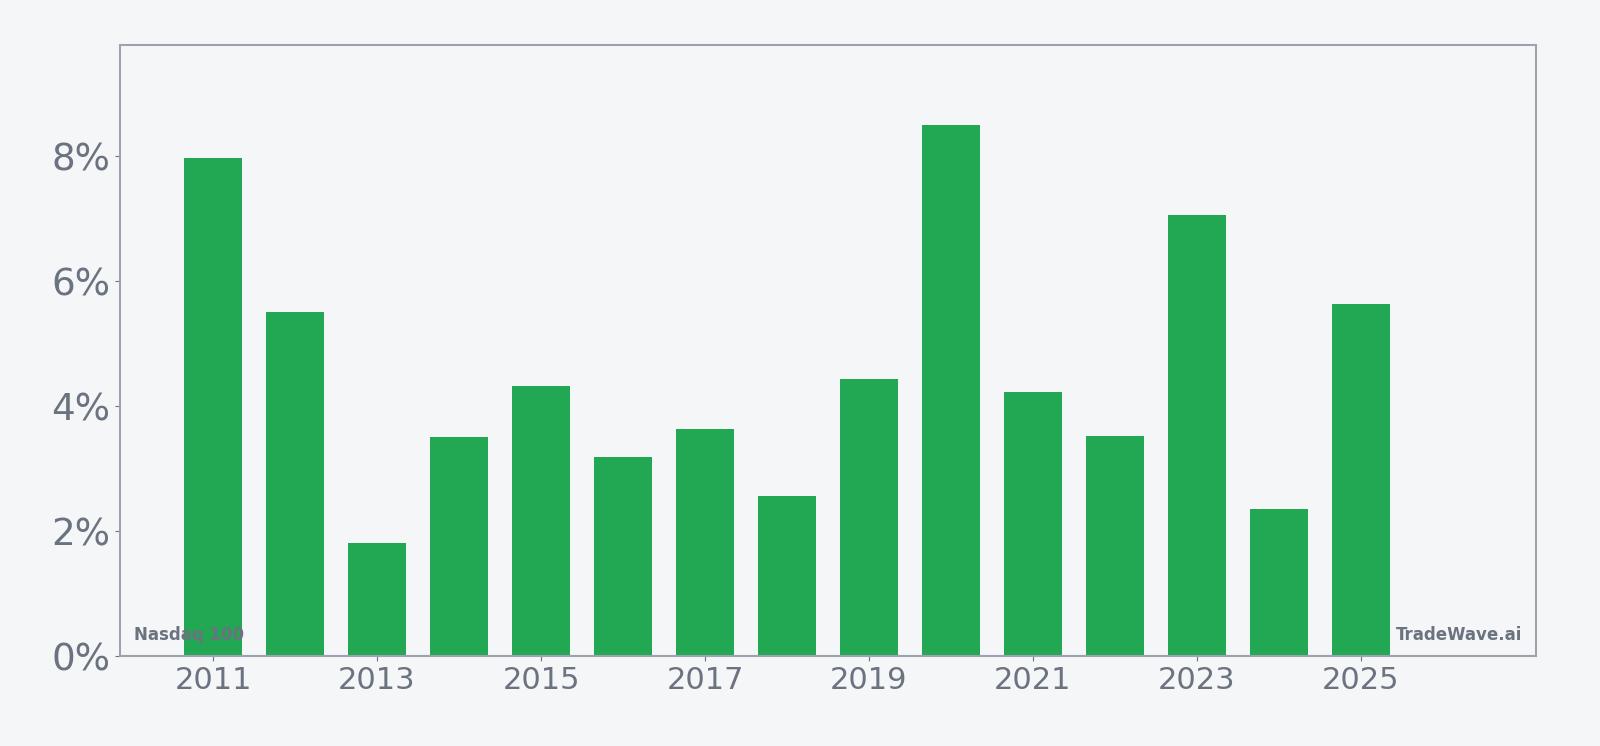
Historically, this Nasdaq 100 trading window has been a straightforward long setup. Percent Profitable sits at 100%, with 15 winners and 0 losers, and the average gain of 4.55% lines up closely with the 4.22% median profit, which suggests the distribution of outcomes has been tight rather than driven by a single outlier year. The cumulative return across all 15 iterations is 94%, and the annualized return for this slice of the calendar is 4.53%, backed by a Sharpe ratio of 2.05 that points to strong risk-adjusted performance.
The per-year table shows how that has played out in practice. In 2020, the window delivered one of its strongest runs, with a net return of 8.5% and a maximum favorable move of 9.66% from the entry level of 10,094.26. In 2016, by contrast, the net gain was a more modest 3.19%, and the index still endured a maximum adverse move of 6.31% before finishing higher, a reminder that even “always up” windows can feel uncomfortable in real time.
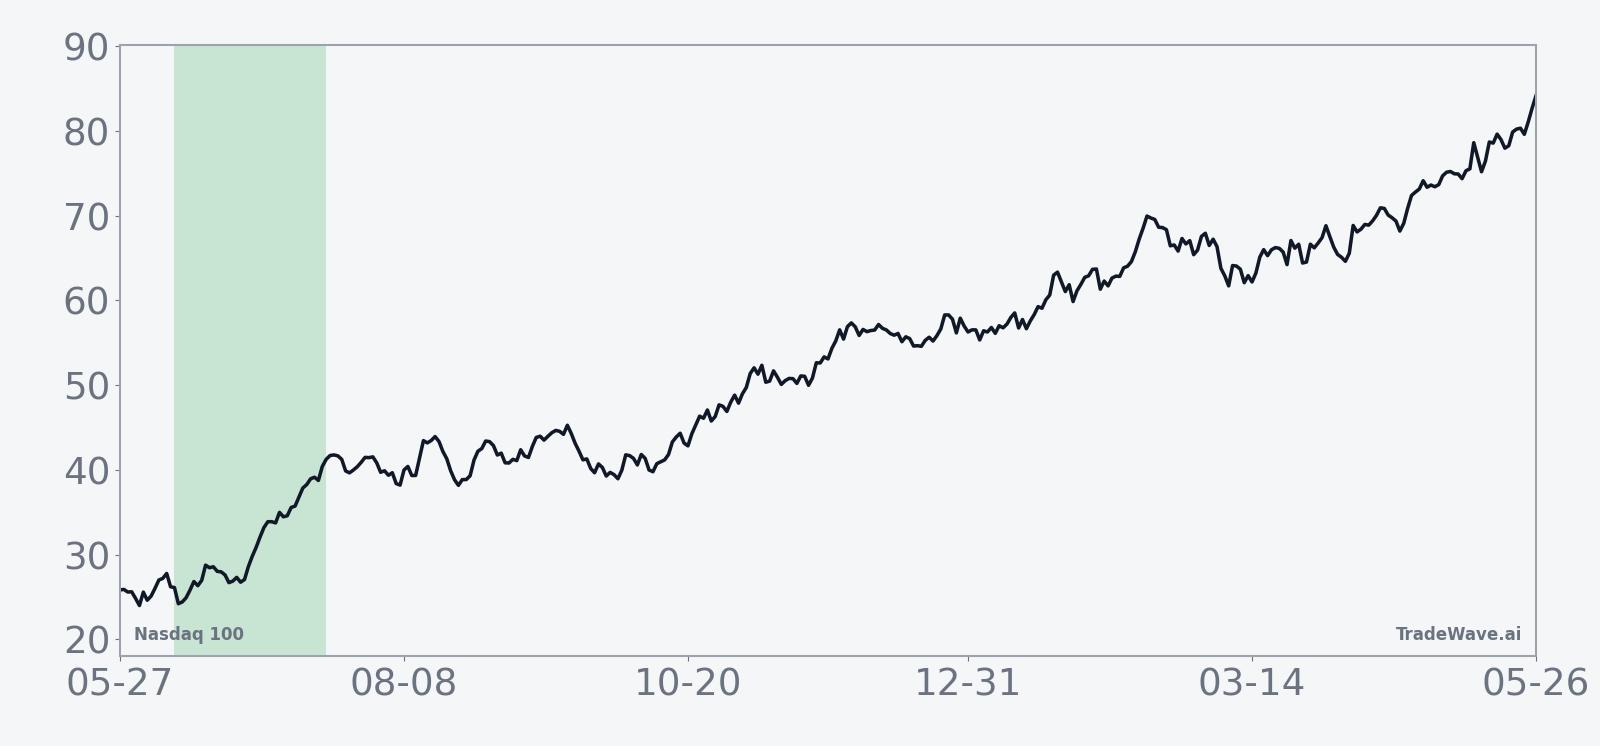
The historical seasonal average suggests that gains in this window tend to build gradually rather than arriving in one or two explosive sessions. The trend chart points to a steady upward slope across most of the 40 days, with only shallow pauses, which fits a pattern of persistent dip-buying in large-cap tech and growth names during early summer. That profile aligns with the long-only Trade Direction and the strong Trend Long readings in the pattern statistics.
Year-by-year net returns and intraperiod swings round out the picture of upside persistence with real drawdown risk.
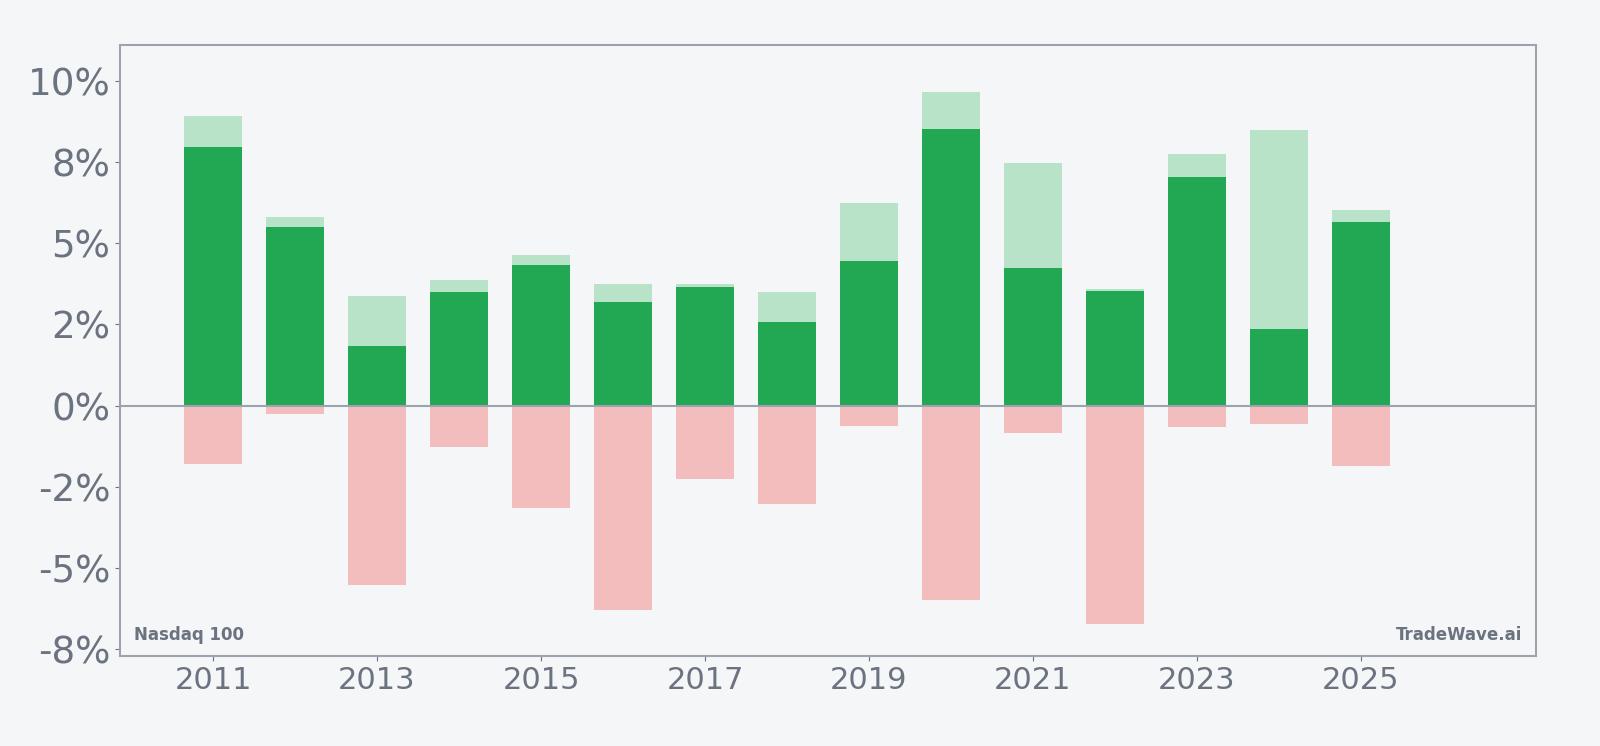
The stacked bar view of net return, maximum favorable move and maximum adverse move underlines how this Nasdaq 100 seasonal trend has combined strong upside with meaningful volatility. In years like 2019 and 2023, the index not only finished up 4.44% and 7.05% respectively, it also saw intraperiod rallies of 6.24% and 7.76% from the entry, illustrating how far price can travel in the trade direction. At the same time, adverse excursions such as the roughly 6.72% drawdown in 2022 show that even winning windows can test risk limits before the pattern plays out.
History does not guarantee future results; adverse excursions can be large even in winning windows, and traders can still lose money if timing or risk management is off.
Why does Nasdaq 100 (NDX) follow this seasonal pattern?
One likely driver is the clustering of major tech and growth earnings updates and guidance resets earlier in the year, which can leave June and early July as a cleaner stretch for trend-following flows. Analysts have also pointed to institutional portfolio rebalancing and index-related buying that often leans back into large-cap tech after spring volatility. This Nasdaq 100 seasonal pattern may reflect that combination of calmer macro newsflow and systematic allocation back into the sector’s leaders.
What is driving Nasdaq 100 (NDX) today?
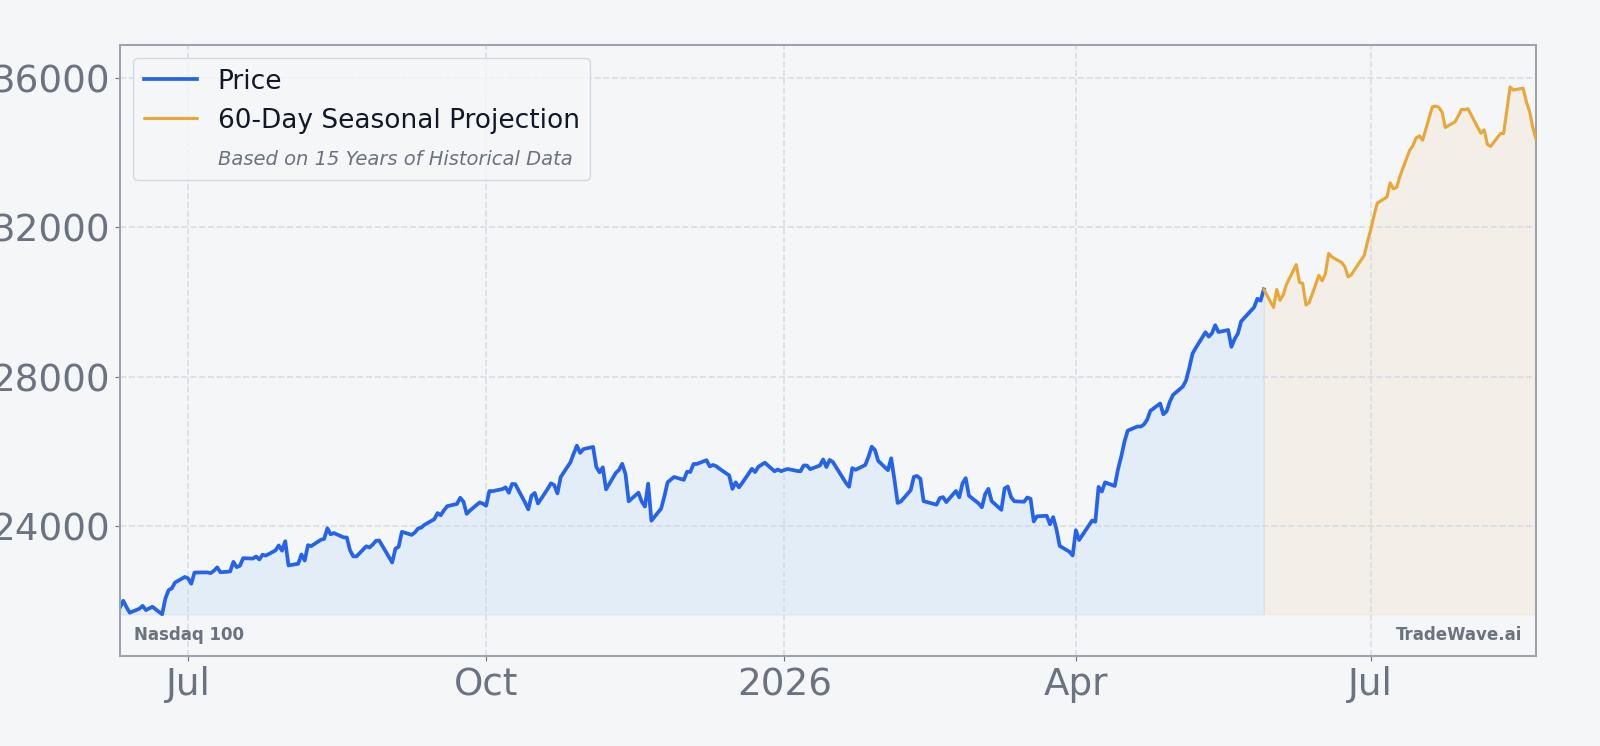
Nasdaq 100 closed at 29,234.99, gaining 2.35% on the session as buyers pushed the index to within about 0.5% of its 52-week high at 29,372.43.[1] The move extended a powerful one-month run of 15.51%, with the index trading well above its 50-day moving average of 25,606.30 on heavy volume of roughly 1.40 billion shares versus a 20-day average of 1.30 billion.[1] The latest leg higher comes against a backdrop of earlier record highs in 2025 that were helped by easing geopolitical tensions between Israel and Iran, which supported risk appetite in large-cap tech and growth stocks.[1]
The chart below situates the latest surge against the past year’s trend and overlays the upcoming seasonal projection.
From a breadth and sector standpoint, the lack of fresh data on how many Nasdaq 100 members sit above key moving averages leaves traders leaning more on the index-level picture. The strong gap between spot levels and the 50-day moving average suggests leadership remains concentrated in the largest growth names, a familiar pattern in recent tech-led rallies. For investors watching the Nasdaq 100 seasonal outlook, the key question is whether that leadership can carry through another 40-day window that has historically rewarded long exposure.
What should traders watch as this Nasdaq 100 seasonal window approaches?
First, the calendar. The 40-day Nasdaq 100 seasonal window begins on Jun 10, so price action in the next four weeks will set the starting point for any historical pattern to play out. A push to fresh highs before the window opens would echo prior years in which the index entered the stretch already extended, yet still managed to grind higher.
Second, levels. With the index less than 1% from its 52-week high, traders will be watching whether 29,372.43 acts as a ceiling or a springboard.[1] In prior iterations of this window, even years with sizable intraperiod drawdowns ultimately resolved higher, so how the index behaves on dips toward the 50-day moving average around 25,606 will be a key tell for whether the historical Nasdaq 100 seasonal trend is reasserting itself or breaking down.
Third, volatility inside the window. The history of maximum favorable and adverse moves shows that 5–7% swings have been common within this 40-day stretch, even when the final outcome was positive. Traders who track the Nasdaq 100 seasonal pattern will be looking to see whether early-window pullbacks stay shallower than those historical worst cases, or whether a deeper shakeout appears before any attempt at another leg higher.
Finally, macro and sector catalysts. While there are no specific earnings or policy events flagged in the data, the index’s sensitivity to global risk sentiment means that any renewed geopolitical stress or rates repricing could collide with the seasonal window. If tech leadership and volume remain firm into late June, it would be consistent with the 15-for-15 record this window carries. A sharp deterioration in breadth or a failure to hold breakouts near the highs would be the first sign that this particular year might diverge from the usual Nasdaq 100 seasonal trend.
Sources
About this seasonal analysis
Seasonal pattern data is sourced from TradeWave.ai, which analyzes historical price behavior across annual calendar windows going back up to 30 years. Read the full data methodology or the book The 100-Year Pattern by Afshin Moshrefi (2026 edition). Past performance of seasonal patterns does not guarantee future results. This article is for informational purposes only and does not constitute investment advice.