Nasdaq 100 (NDX) Has Rallied 15 of 15 Early Summers, Averaging 4.55% Gains
Nasdaq 100 is trading just below a fresh 52-week high as it heads into a 40-day early-summer window that has quietly delivered gains every year for the past decade and a half.

What is the seasonal pattern for Nasdaq 100 (NDX)?
Nasdaq 100 has risen in 15 of 15 years during this early-summer 40-day window starting Jun 10, with an average gain of 4.55% in winning years.
- 15 for 15 in this window, with Nasdaq 100 averaging 4.55% gains in winning years across the past 15 cycles.
- The seasonal window begins Jun 10 and runs for 40 trading days, covering the heart of the early-summer tech trade.
- Percent Profitable is 100%, with 15 winners and 0 losers over the lookback period.
- Average winner gains of 4.55% stack up to a 94% cumulative return across all 15 early-summer windows.
- The TradeWave Ratio of 2.43 signals that price has typically traveled meaningfully in the long direction within the window, not just at the close.
- A Sharpe ratio of 2.05 for this pattern points to unusually strong risk-adjusted returns compared with a typical index swing.
According to historical data from TradeWave.ai, this early-summer stretch has behaved very differently from an average month on the Nasdaq 100 calendar. The next section walks through what that pattern has looked like and how it lines up with today’s tech-led market backdrop.
How has Nasdaq 100 (NDX) traded in this early-summer window?
Nasdaq 100 has risen in every single one of the past 15 early-summer windows starting around Jun 10, averaging a 4.55% gain over 40 trading days. Today the index closed at 30,571.24, down 0.3% on the session and about 0.6% below its 52-week high of 30,762.20, leaving it effectively at record territory as the pattern approaches.[1]
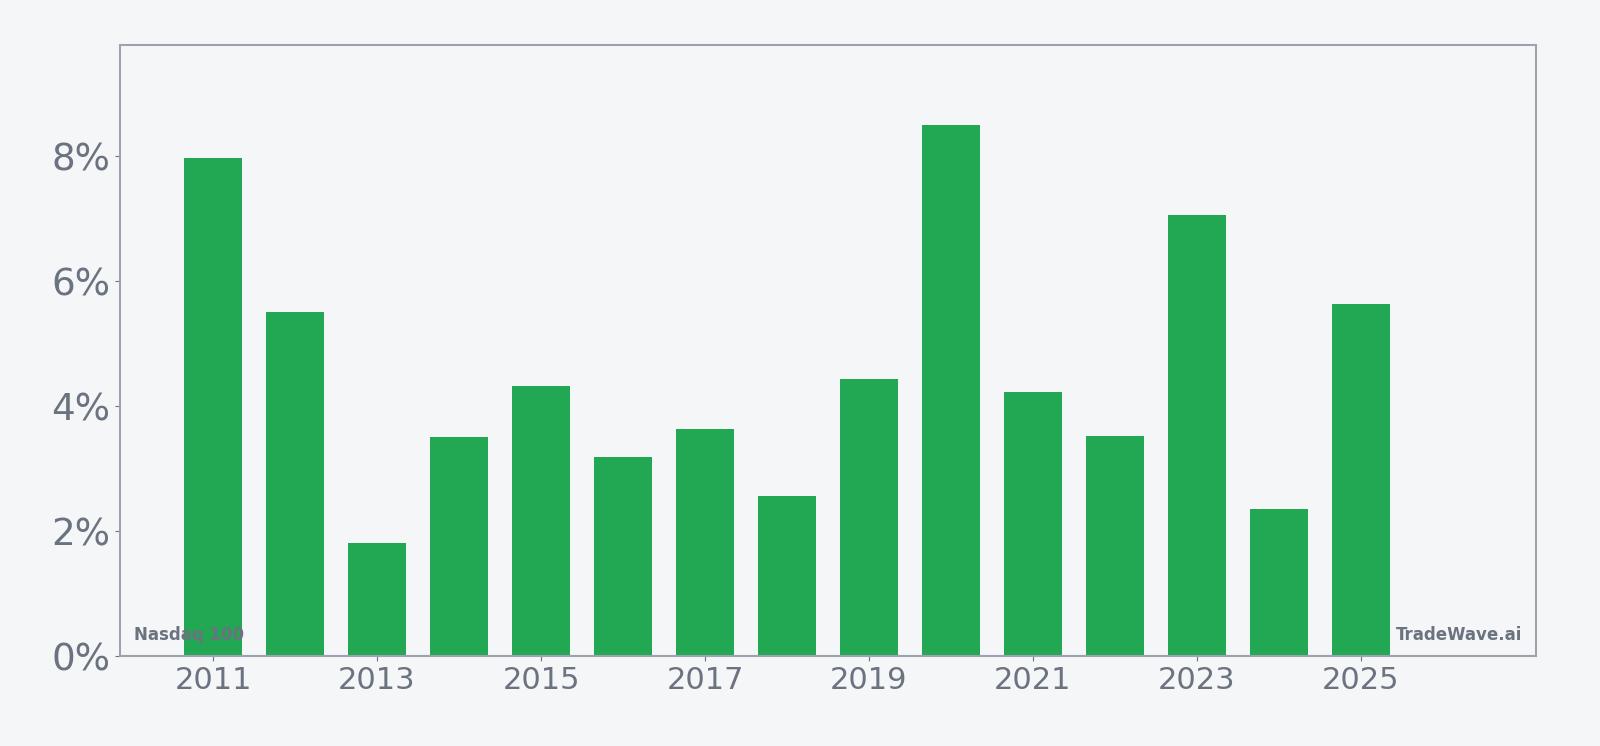
Across the full 15-year sample, the pattern has been unambiguously bullish for long exposure. Percent Profitable sits at 100%, with 15 winners and 0 losers, and the average gain of 4.55% per window compounds to a 94% cumulative return for investors who hypothetically repeated the trade every year. The median outcome of 4.22% is close to the average, which suggests the distribution of returns has not been dominated by a single outlier year.
The strongest recent iteration came in 2020, when NDX gained 8.5% between the Jun 10 entry and the end of the 40-day window, with a maximum favorable move of 9.66% at the peak and a worst drawdown of 5.99% from entry during the period. At the other end of the spectrum, 2016 delivered a more modest 3.19% net gain, but that year still saw a 6.31% adverse excursion at one point before the index recovered into the close of the window. That mix of steady wins and occasional deep dips is a reminder that even a perfect win record can involve uncomfortable swings along the way.
The historical seasonal trend chart shows gains tending to build steadily rather than in a single burst. In many years, NDX has pushed higher early in the window, consolidated in the middle, and then added a second leg of strength into the final third. That stair-step profile is consistent with a Sharpe ratio of 2.05, which points to relatively smooth risk-adjusted returns compared with a typical index swing.
Year-by-year bars that include both peak rallies and worst drawdowns help clarify how much volatility has come with those wins.
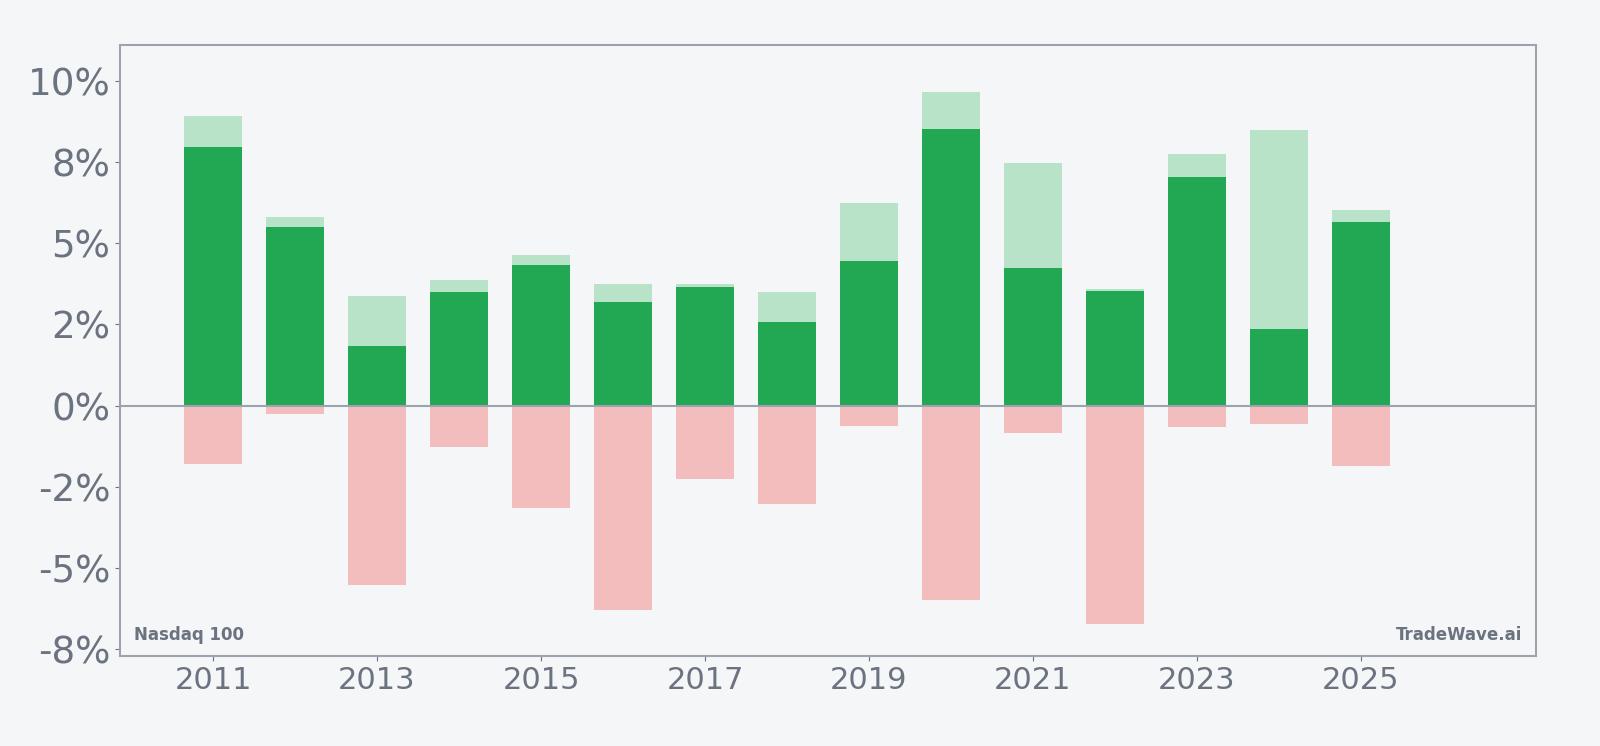
The combined net/MFE/MAE bars show that upside potential has often been larger than the final net result, with several years posting maximum favorable moves above 7% while still finishing closer to the 4% to 6% range. At the same time, maximum adverse excursions have occasionally stretched to roughly 6% intraperiod drawdowns, even in years that ultimately closed higher. Add it up: this has been a remarkably consistent bullish window for NDX, but one that has not been free of sharp pullbacks along the way.
History does not guarantee future results; adverse excursions (MAE) can be large even in winning windows.
Why does Nasdaq 100 (NDX) follow this seasonal pattern?
This early-summer pattern may reflect a cluster of tech and growth catalysts that tend to land between late spring earnings and the heart of the third-quarter reporting season. Analysts have pointed to institutional portfolio rebalancing, index-related flows and options positioning around midyear as additional drivers that can support large-cap growth benchmarks during this stretch. For a tech-heavy index like NDX, those forces can combine with ongoing secular demand for cloud, AI and consumer platforms to create a recurring bid in this part of the calendar.
What is driving Nasdaq 100 (NDX) today?
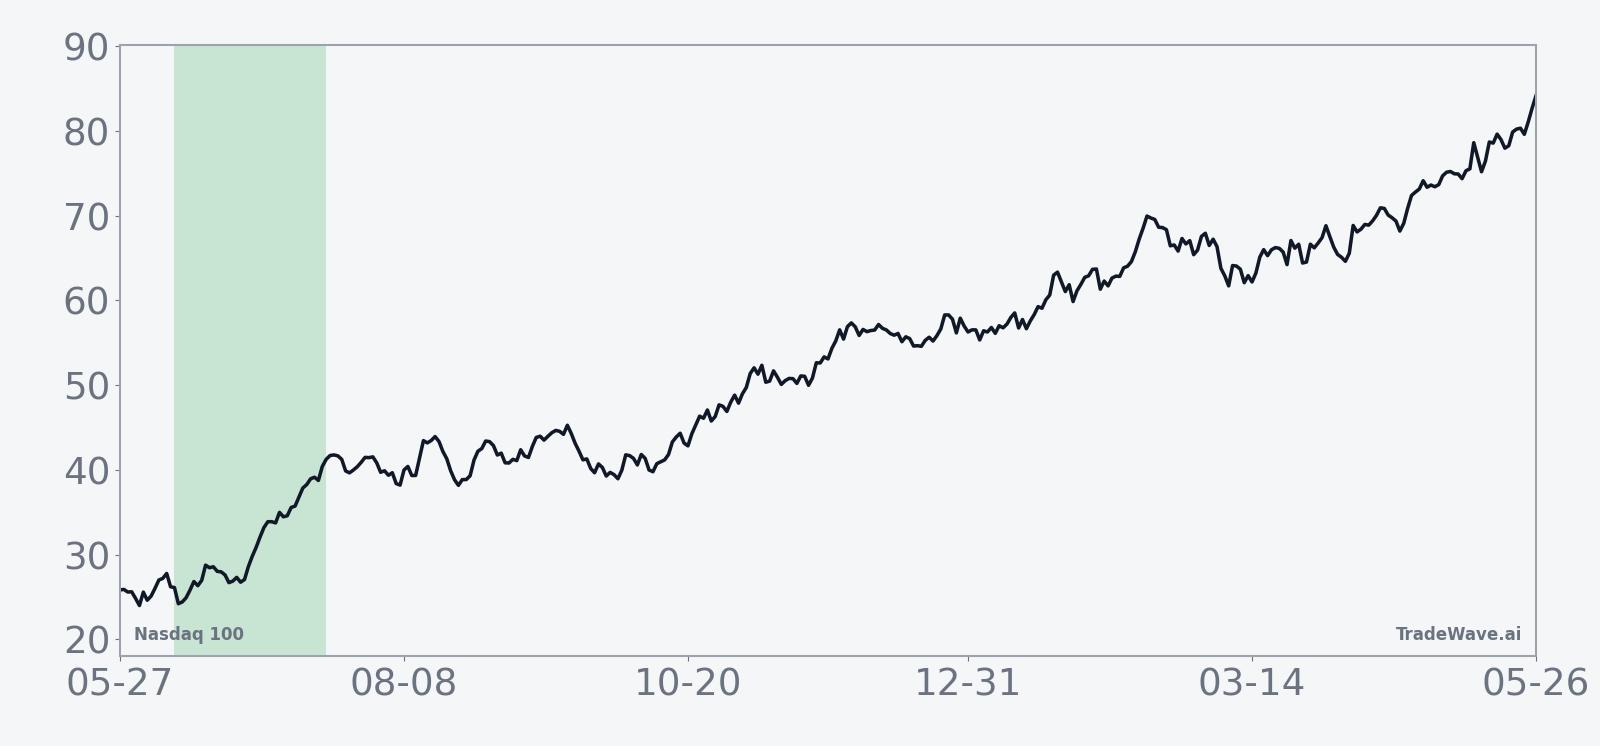
Nasdaq 100 slipped 0.3% to 30,571.24 on Friday, easing from an intraday record high of 30,762.20 but holding roughly 6.3% above its level a month ago and well above its 50-day moving average of 27,350.19.[1] The index remains a barometer for mega-cap technology and growth stocks, with its tech-heavy composition meaning that any pullback or breakout in the coming weeks is likely to be driven by the same handful of platform companies that have led the market for much of the past year.[1]
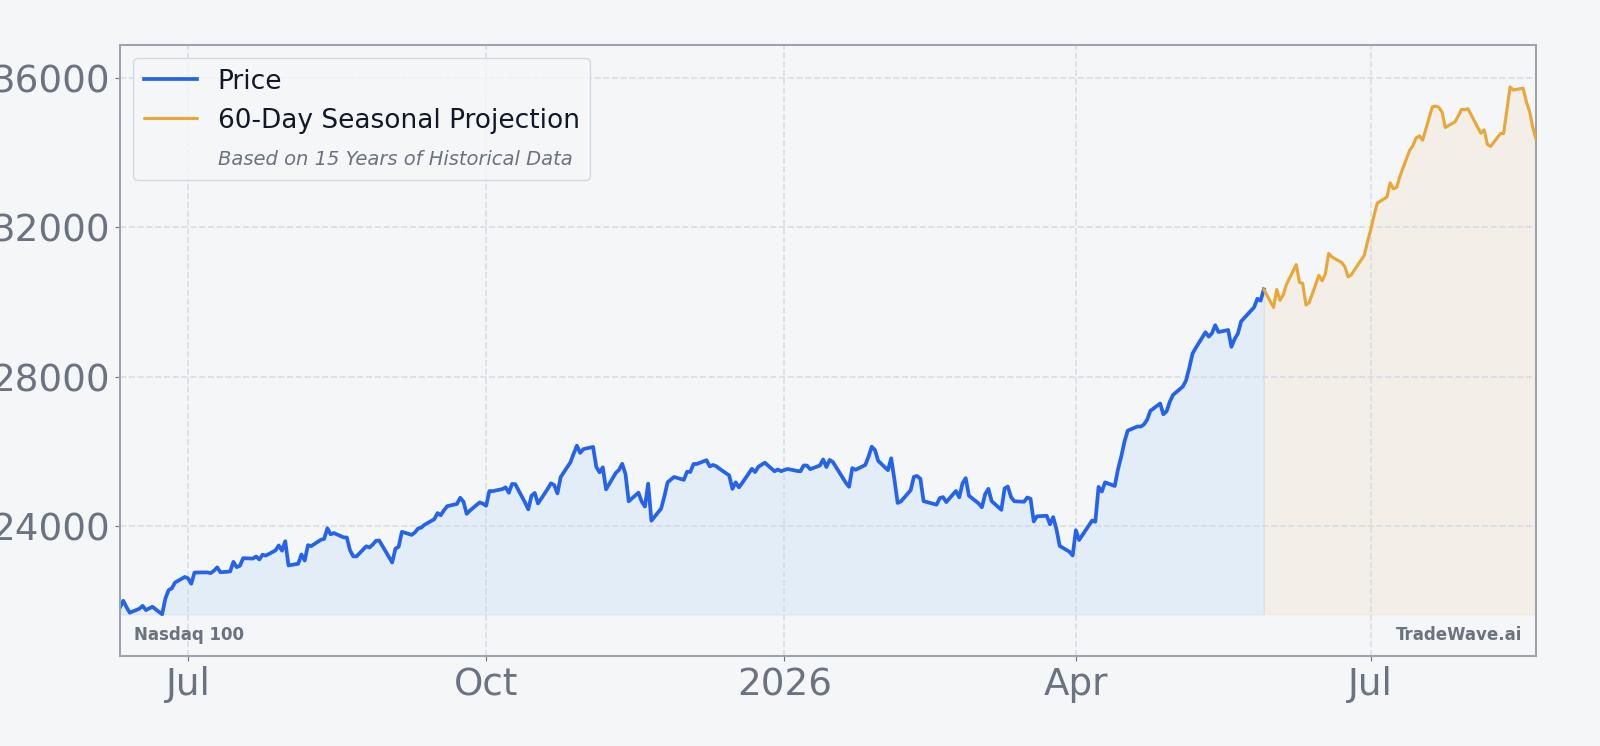
The chart below situates the latest move against the past year of trading and overlays the upcoming 60-day seasonal projection.
Structurally, NDX remains defined by its concentration in the largest Nasdaq-listed technology and growth names, which means sector leadership is still the story beneath the index level.[1] Moves in cloud, AI infrastructure, consumer internet and semiconductor leaders continue to dominate index performance, and any rotation away from those groups during the upcoming seasonal window would show up quickly in breadth measures such as the share of members above their 50- and 200-day moving averages. For traders watching the Nasdaq 100 trading window into mid-July, the key question is whether that leadership broadens out or narrows further as the historical seasonality kicks in.
What should traders watch as this seasonal window opens?
First, the calendar: the 40-day early-summer window begins on Jun 10 and runs into late July, so price action in the next week will set the tone for how closely this year tracks the historical NDX seasonal trend. A firm hold above the recent breakout zone near 30,000, with pullbacks contained relative to the roughly 6% worst-case intraperiod drawdowns seen in prior years, would be consistent with the pattern. A deeper and faster break below that area would signal that this cycle is diverging from the usual script.
Second, breadth and sector leadership inside the index will matter as much as the headline level. Historically strong windows can still feel choppy if gains are driven by a shrinking group of mega-caps while more members slip below their 50-day and 200-day moving averages. Traders watching the Nasdaq 100 seasonal outlook will be looking for signs that more components participate in rallies, not fewer, as the window progresses.
Third, macro and policy headlines that affect large-cap tech risk appetite will be important context. In Feb 2026, for example, Nasdaq proposed a “fast entry” rule to speed the inclusion of large new listings, a reminder that index composition and rules can shift the balance of flows into and within NDX over time.[1] Any further developments on index methodology, regulation of big tech, or large-cap IPOs could intersect with the seasonal pattern by changing which names carry the most weight in the benchmark.
Finally, traders will be watching how intraperiod swings line up with the historical MFE/MAE profile. If rallies during the window quickly extend toward the upper end of the typical favorable move range while drawdowns stay relatively shallow, that would echo the stronger years in the sample. If instead the index spends more time near the lower end of its recent range and adverse excursions deepen, it would suggest that this early-summer stretch is behaving more like a consolidation phase than the clean uptrend that has defined the past 15 cycles.
Sources
About this seasonal analysis
Seasonal pattern data is sourced from TradeWave.ai, which analyzes historical price behavior across annual calendar windows going back up to 30 years. Read the full data methodology or the book The 100-Year Pattern by Afshin Moshrefi (2026 edition). Past performance of seasonal patterns does not guarantee future results. This article is for informational purposes only and does not constitute investment advice.