15-for-15 Summer Win Streak: Nasdaq 100 (NDX) Nears 40-Day Window Averaging 4.55% Gains
Nasdaq 100 is hovering just below a fresh record as it heads into a June–July seasonal window that has quietly delivered gains every year for the past decade and a half.

What is the seasonal pattern for Nasdaq 100 (NDX)?
Nasdaq 100 has risen in 15 of 15 years during this June–July 40-day window, with an average gain of 4.55% in winning years.
- 15 for 15 in this window, with Nasdaq 100 averaging 4.55% gains across all winning years.
- The upcoming 40-day window starts Jun 10 and has historically favored long exposure in NDX during early summer.
- Percent Profitable is 100%, with 15 winners and 0 losers across the 15-year lookback.
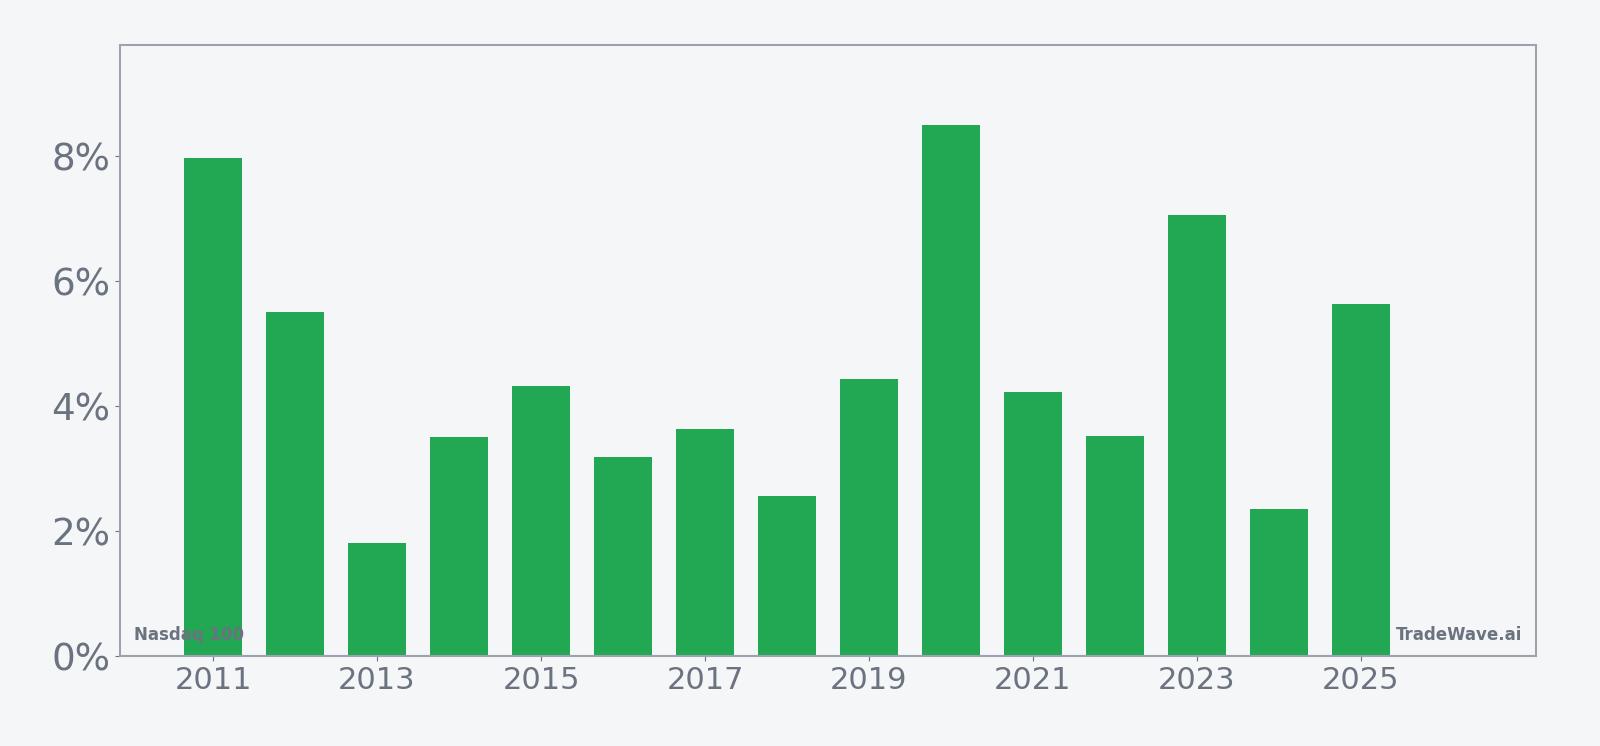
- Average gains cluster in the low- to mid-single digits, but individual years have seen moves above 8%.
- Intraperiod drawdowns have still been meaningful in some years, reminding traders that even strong seasonal edges can be bumpy.
- The pattern aligns with a tech-heavy summer backdrop, when large growth names in the Nasdaq 100 often extend existing trends.
According to historical data from TradeWave.ai, this early-summer stretch has behaved very differently from an average month on the calendar for NDX. The next section walks through how that pattern has played out and where it sits against today’s backdrop.
How has Nasdaq 100 (NDX) traded in the upcoming June–July window?
Nasdaq 100 has posted gains in every single iteration of this 40-day June–July window over the past 15 years, averaging a 4.55% rise for long positions. Today the index closed at 30,333.18, up 0.36% on the session and sitting about 0.4% below its 52-week high of 30,470.03.[1]
The trade direction for this pattern is explicitly long, and the track record is unusually clean: 15 winners, 0 losers, and a 100% hit rate across the 15-year sample. Average gains of 4.55% for the window line up with a 94% cumulative return when you stack all the historical slices together, while the median outcome of 4.22% shows that results have tended to cluster rather than hinge on one outlier year.
Individual years still show a range of outcomes. The strongest recent run came in 2020, when NDX gained 8.5% between the June 10 entry and the end of the 40-day window, with a best intraperiod rally of 9.66% from the starting level before any giveback. At the other end of the spectrum, 2016 delivered a more modest 3.19% net gain, and 2018 and 2024 also sat in the low single digits, reminding traders that “up every year” does not mean “big every year.”
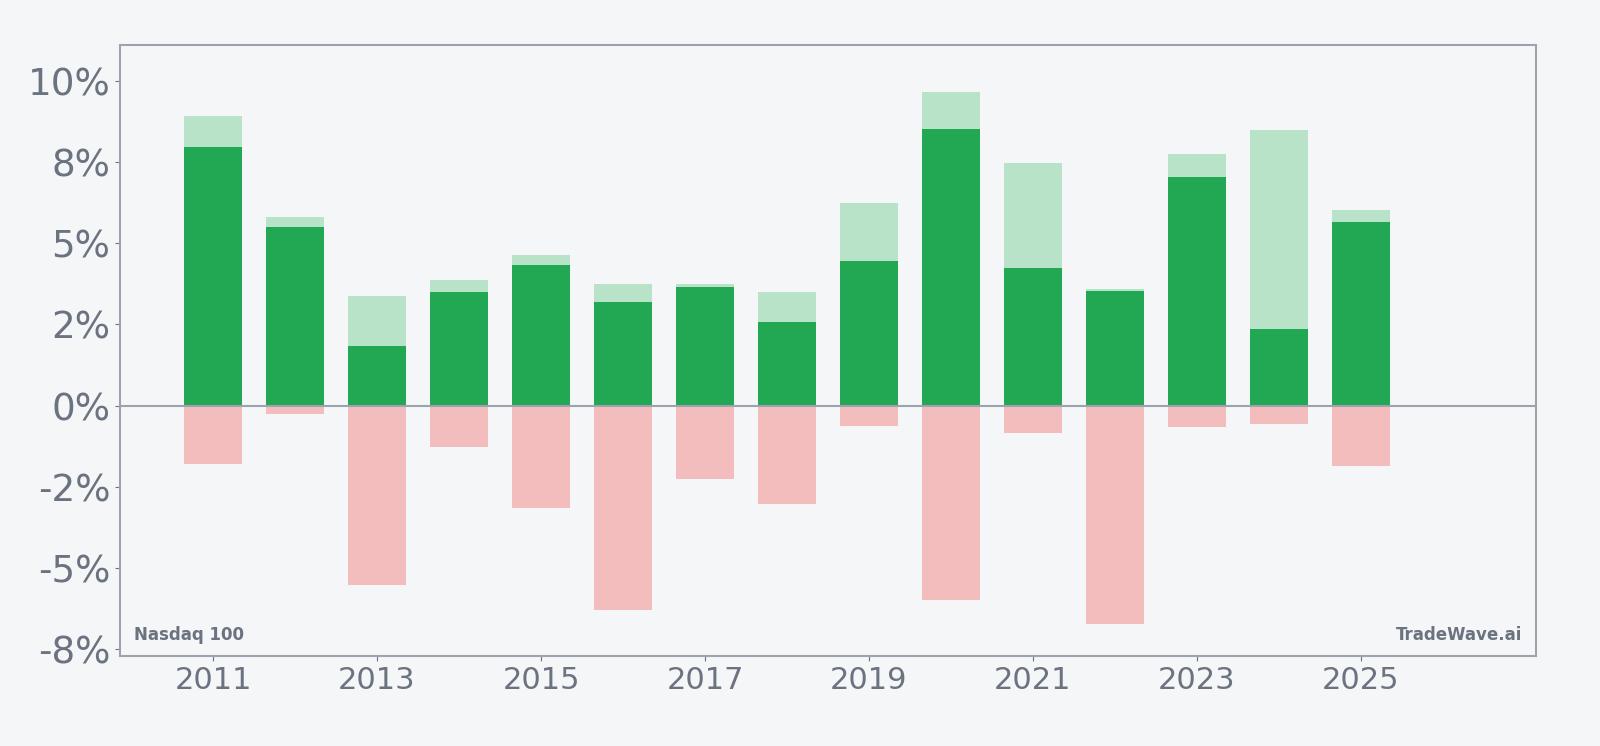
Intraperiod swings have been real even in winning summers. In 2016 and 2022, the worst drawdowns from entry reached roughly 6% to 7% before the index recovered to finish higher, while several other years saw adverse moves of 2% to 3% inside the window. That MAE profile, or maximum adverse excursion, shows that long positions have historically had to sit through volatility even when the final outcome was positive.
The flip side is the maximum favorable excursion, or MFE, which captures the best point-to-peak rally from the entry price during the window. In years like 2019, 2020 and 2023, NDX’s MFE ran between roughly 6% and nearly 10%, indicating that when the pattern has worked, it has often done so with a fairly decisive upside push rather than a slow grind.
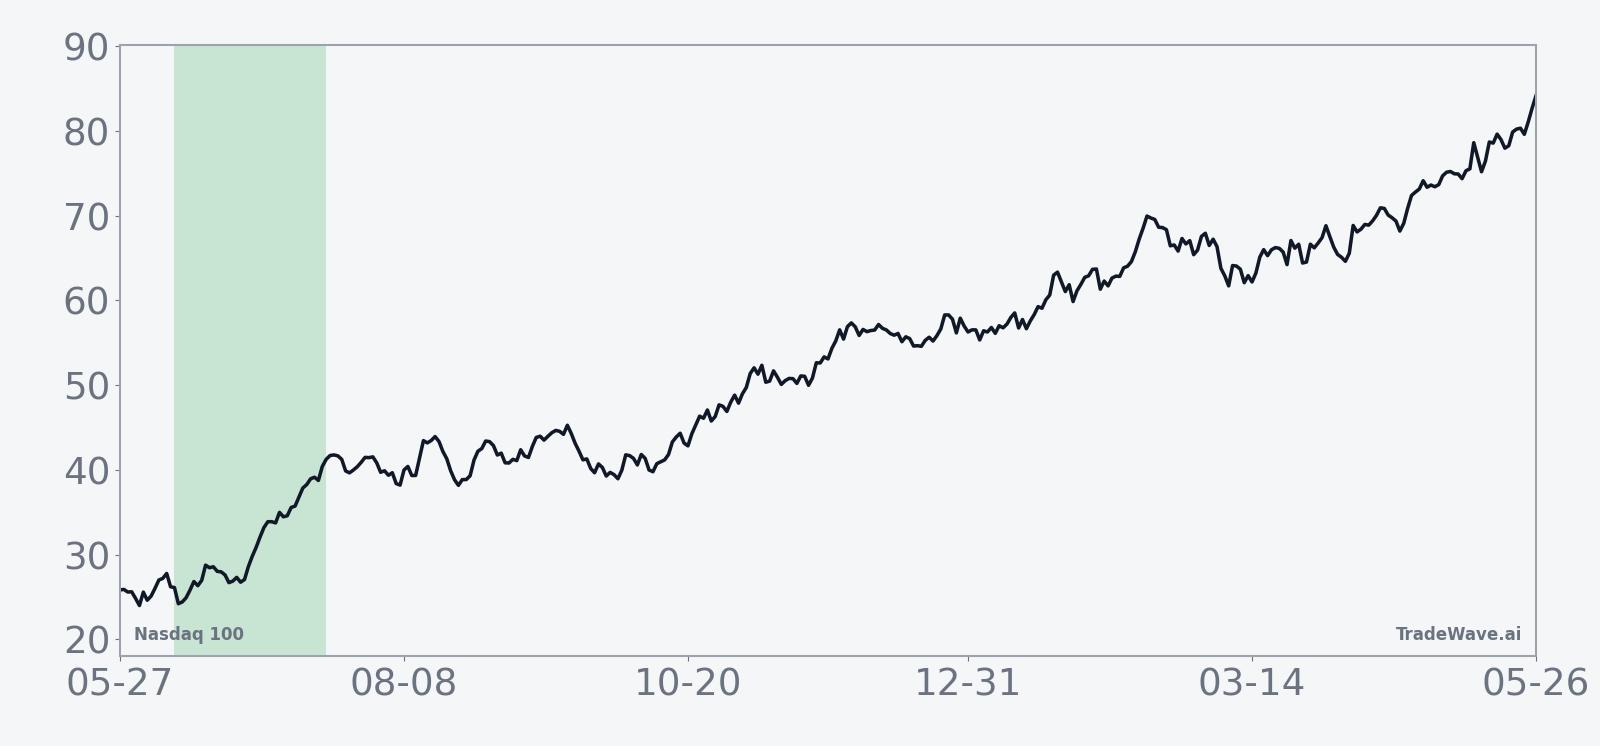
The historical seasonal trend line for this window slopes steadily higher, with most of the average gain accruing across the full 40 days rather than in a single burst. That suggests a tendency for NDX to build on early-summer momentum as the quarter closes and the new one begins, instead of front-loading all the move into the first few sessions.
A per-year view of net returns and intraperiod swings shows how consistently the pattern has leaned bullish while still allowing for sharp pullbacks.
Put together, the record is straightforward: this early-summer window has favored long NDX exposure in every year of the past decade and a half, with enough volatility inside the range to reward patience but not enough to flip the final outcome negative even once.
Why does Nasdaq 100 (NDX) follow this seasonal pattern?
This pattern may reflect a mix of earnings-calendar positioning and institutional portfolio moves around midyear. One likely driver is that many of the Nasdaq 100’s largest technology and growth companies report results or update guidance in late July, which can keep positioning constructive into the run-up period. Analysts have also pointed to midyear index rebalancing and sector rotation as reasons why tech-heavy benchmarks often see renewed demand as investors reset risk for the second half.
History does not guarantee future results, and even in a window with a perfect win record, adverse moves inside the period can be large enough to challenge any short-term trade.
What is driving Nasdaq 100 (NDX) today?
Nasdaq 100 finished Monday at 30,333.18, up 0.36% on the day, with intraday trade confined to a relatively tight band between 30,210.01 and a fresh 52-week high of 30,470.03.[1] The index is now about 44.5% above its 52-week low of 21,032.56, underscoring how dominant the tech and growth rebound has been over the past year.[1]
The composition of NDX keeps the focus squarely on mega-cap technology and growth names such as Alphabet and Nvidia, which continue to act as bellwethers for risk appetite in the broader market.[1] The index’s tech-heavy tilt means that any shift in sentiment around artificial intelligence spending, cloud demand or digital advertising can ripple quickly through the benchmark, amplifying moves relative to more diversified indices.
In Feb 2026, Nasdaq proposed a “fast entry” rule designed to speed up the inclusion of large new listings into its major benchmarks, including the Nasdaq 100.[1] While that rule is still a backdrop rather than a day-to-day driver, it highlights how index construction could evolve in coming quarters, potentially pulling newly listed tech leaders into NDX more quickly and reinforcing its role as a concentrated growth barometer.
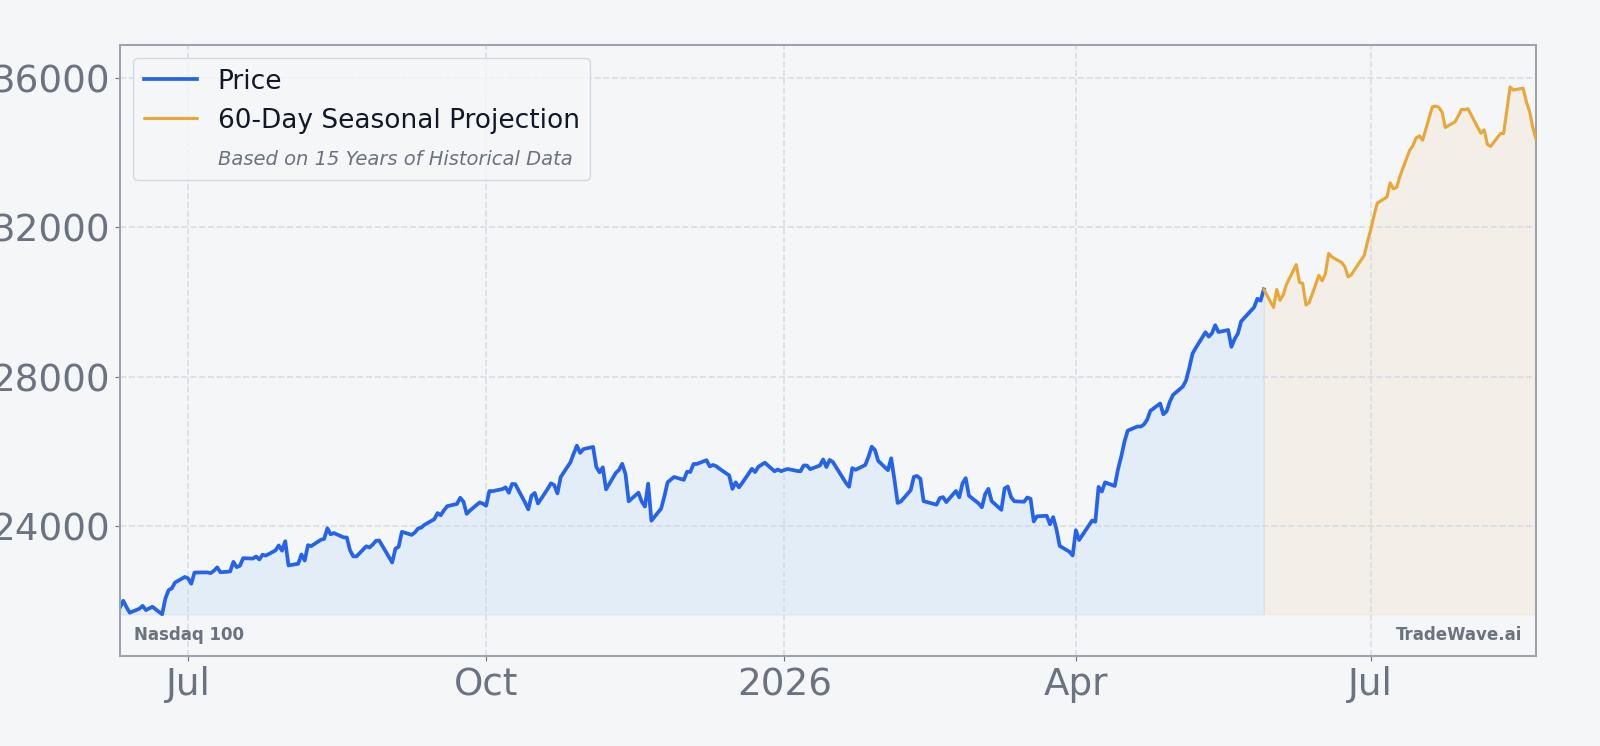
The chart below shows how that backdrop has translated into price action over the past year, along with a seasonal projection for the next two months.
What should traders watch as the June–July window opens?
First, the level to watch is the recent high near 30,470. A sustained break and hold above that area as the June 10 window begins would line up with the historical pattern of early-summer strength, while a failure there followed by a deeper pullback would mark a rare divergence from the usual NDX seasonal trend.
Second, breadth inside the index will matter as much as the headline level. The historical window has delivered gains in every year of the past 15, but some of those summers featured narrow leadership from a handful of mega-caps, while others saw broader participation. Traders will be looking to see whether gains into late June and July are driven by a small AI cohort or spread across software, semiconductors and consumer internet names that dominate the benchmark.[1]
Third, macro and earnings headlines will intersect with this pattern. The Nasdaq 100 is widely used as a proxy for global growth and technology risk, so any shift in expectations for interest rates, enterprise IT budgets or consumer demand could either reinforce or blunt the usual seasonal tailwind.[1] If volatility spikes around those catalysts but NDX still manages to finish the 40-day stretch higher, it would echo prior years where intraperiod drawdowns did not derail the final outcome.
Finally, traders will be watching how closely the actual path tracks the historical seasonal curve. A steady grind higher with only shallow pullbacks would look like the stronger years in the sample, while a choppier pattern with deeper dips would resemble 2016 or 2022. Either way, the record heading into this cycle is clear: for a decade and a half, this specific June–July window has been one of the Nasdaq 100’s most reliable bullish stretches.
Sources
About this seasonal analysis
Seasonal pattern data is sourced from TradeWave.ai, which analyzes historical price behavior across annual calendar windows going back up to 30 years. Read the full data methodology or the book The 100-Year Pattern by Afshin Moshrefi (2026 edition). Past performance of seasonal patterns does not guarantee future results. This article is for informational purposes only and does not constitute investment advice.