Nasdaq 100 (NDX) has gained in 15 straight early-summer windows, averaging 4.55% upside
Nasdaq 100 is hovering just below record territory as it approaches a 40-day early-summer window that has never been negative in the past 15 years, raising the stakes for tech-heavy portfolios.

What is the seasonal pattern for Nasdaq 100 (NDX)?
Nasdaq 100 has risen in 15 of 15 years during this early-summer 40-day window, with an average gain of 4.55% in winning years.
- 15 for 15 in this window, with Nasdaq 100 posting average gains of 4.55% across all winning years.
- The upcoming 40-day Nasdaq 100 trading window starts on Jun 10, 2026 and has shown a consistently bullish historical seasonality profile.
- Percent Profitable is 100%, with 15 winners and 0 losers across the 15-year lookback.
- Average winner gains of 4.55% compare with a reported 0% average loss, reflecting no losing years in this sample.
- The TradeWave Ratio of 2.43 suggests price has typically traveled meaningfully in the long direction within the window, even before final closes.
- Intraperiod swings have still been real, with several years showing adverse moves greater than 5% before finishing higher.
According to historical data from TradeWave.ai, this early-summer stretch has behaved very differently from an average month on the Nasdaq 100 calendar, and the next iteration is about to open again.
How has Nasdaq 100 (NDX) traded in this early-summer window?
Nasdaq 100 has booked gains in every single early-summer window over the past 15 years, averaging a 4.55% rise across those 40-day stretches. Today the index closed at 29,481.64, up 0.42% on the session and sitting about 1.9% below its 52-week high of 30,044.49.[1] That combination of a near-record level and a spotless seasonal track record turns the Jun 10 start date into a key waypoint for anyone running tech-heavy exposure.
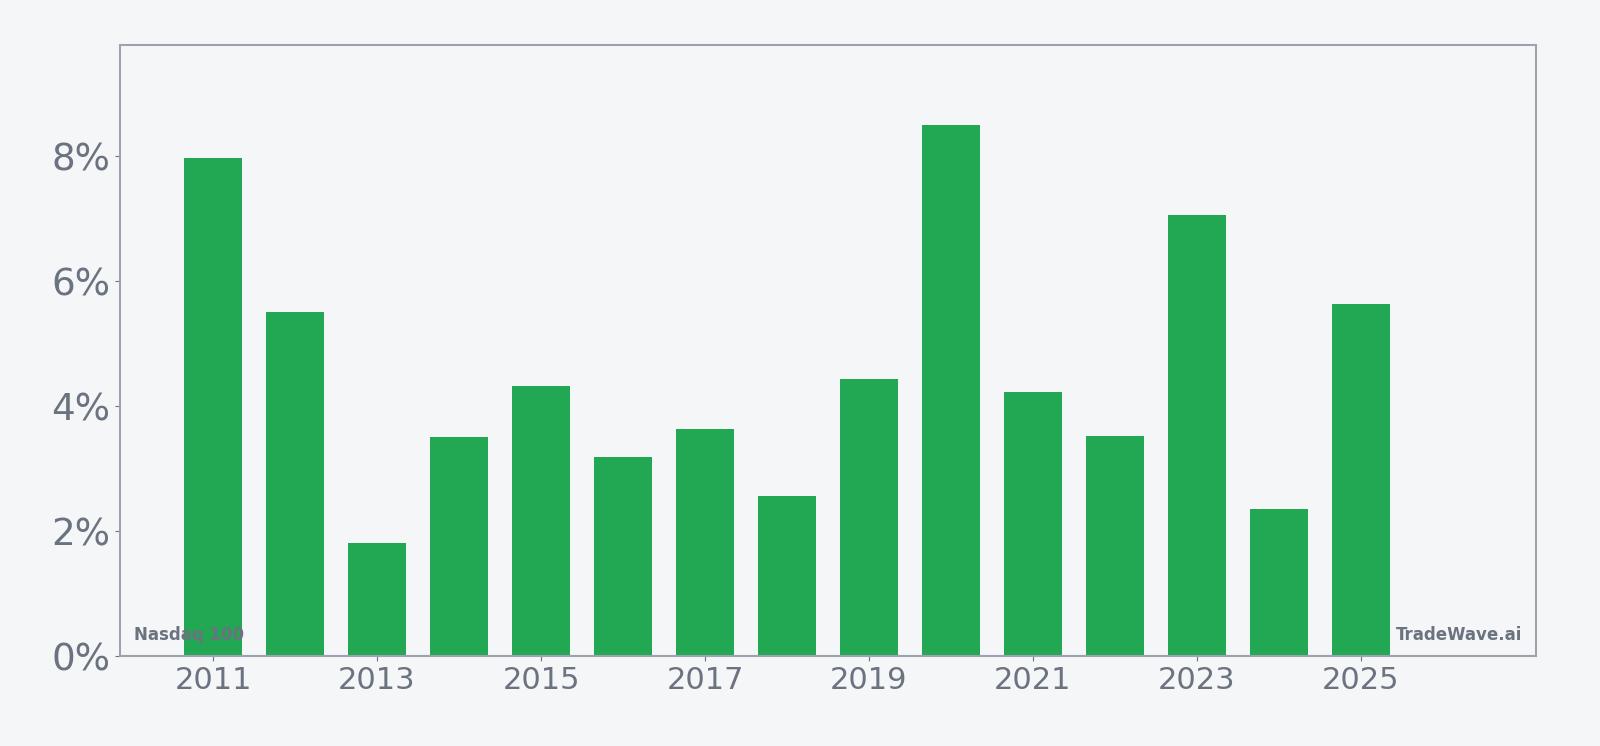
Across the last decade, the pattern has been remarkably consistent. From 2016 through 2025, every single year in this Nasdaq 100 trading window finished positive, with net gains ranging from 2.35% in 2024 to 8.5% in 2020. The strongest year in the sample, 2020, saw the index rally 8.5% between entry and exit, while the weakest still delivered a 2.35% climb.
Those end-of-window results sit on top of meaningful intraperiod swings. In 2016, for example, the index ultimately gained 3.19% but endured a worst drawdown of 6.31% from the entry level before recovering. In 2020, the best point-to-peak move reached 9.66% while the worst pullback inside the window was 5.99%, underscoring that even “all green” years have not been straight lines.
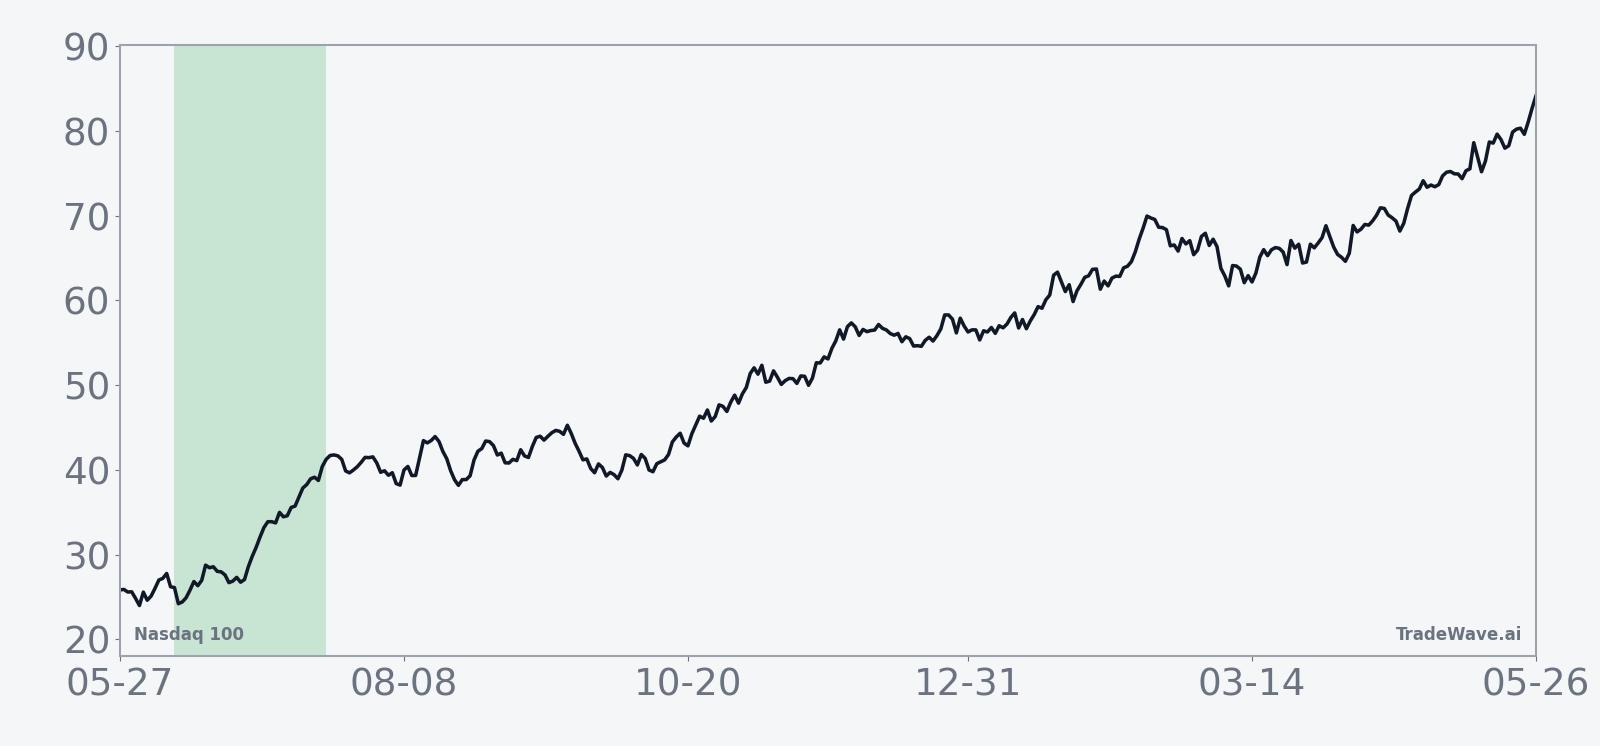
The typical shape of the NDX seasonal trend in this early-summer slice is a steady grind higher rather than a single burst. Many years show gains building through the middle of the window, with some choppiness near the end as quarter-end positioning and macro headlines hit. That profile fits a long trade direction bias, where upside has tended to outweigh downside over the full 40 days.
A combined view of net returns and intraperiod swings shows how often rallies have come with sizable drawdowns.
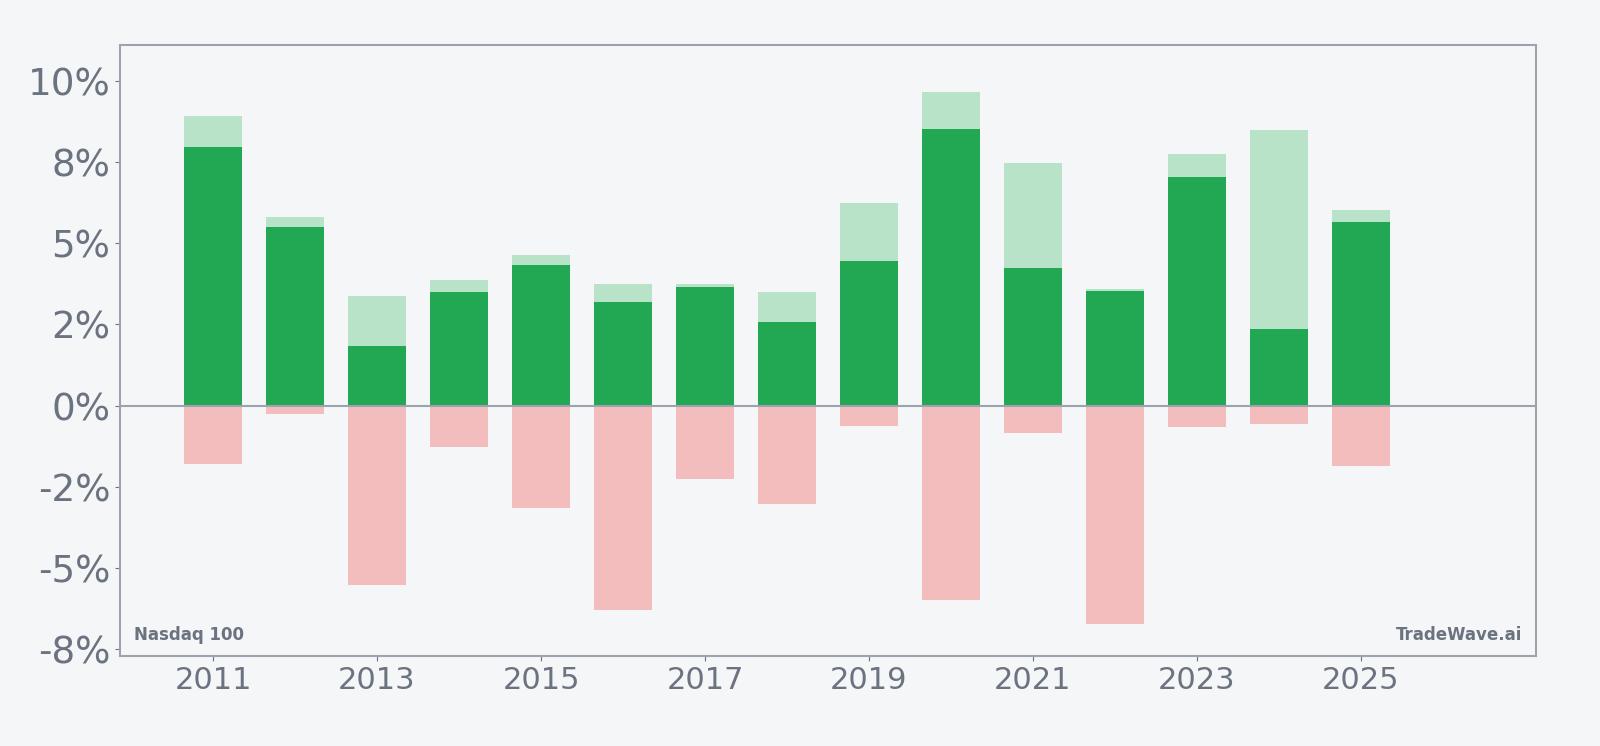
Put together, the record is striking: 15 winners, 0 losers, and a mid-single-digit average gain in a concentrated 40-day span. The pattern has favored long exposure in every year of the lookback, even though several cycles included sharp mid-window setbacks.
Why does Nasdaq 100 (NDX) follow this seasonal pattern?
One likely driver is the way the tech earnings calendar and guidance updates cluster around late spring and early summer, often resetting growth expectations for the rest of the year. Analysts have also pointed to institutional portfolio rebalancing and index-related flows ahead of midyear as reasons why large-cap growth and mega-cap tech can see renewed demand in this stretch. The pattern may also reflect options expiration dynamics, with dealers and systematic strategies adjusting exposure as volatility expectations shift into the quieter summer months.
History does not guarantee future results; adverse excursions can be large even in winning windows, and traders should be prepared for drawdowns inside the pattern.
What is driving Nasdaq 100 (NDX) today?
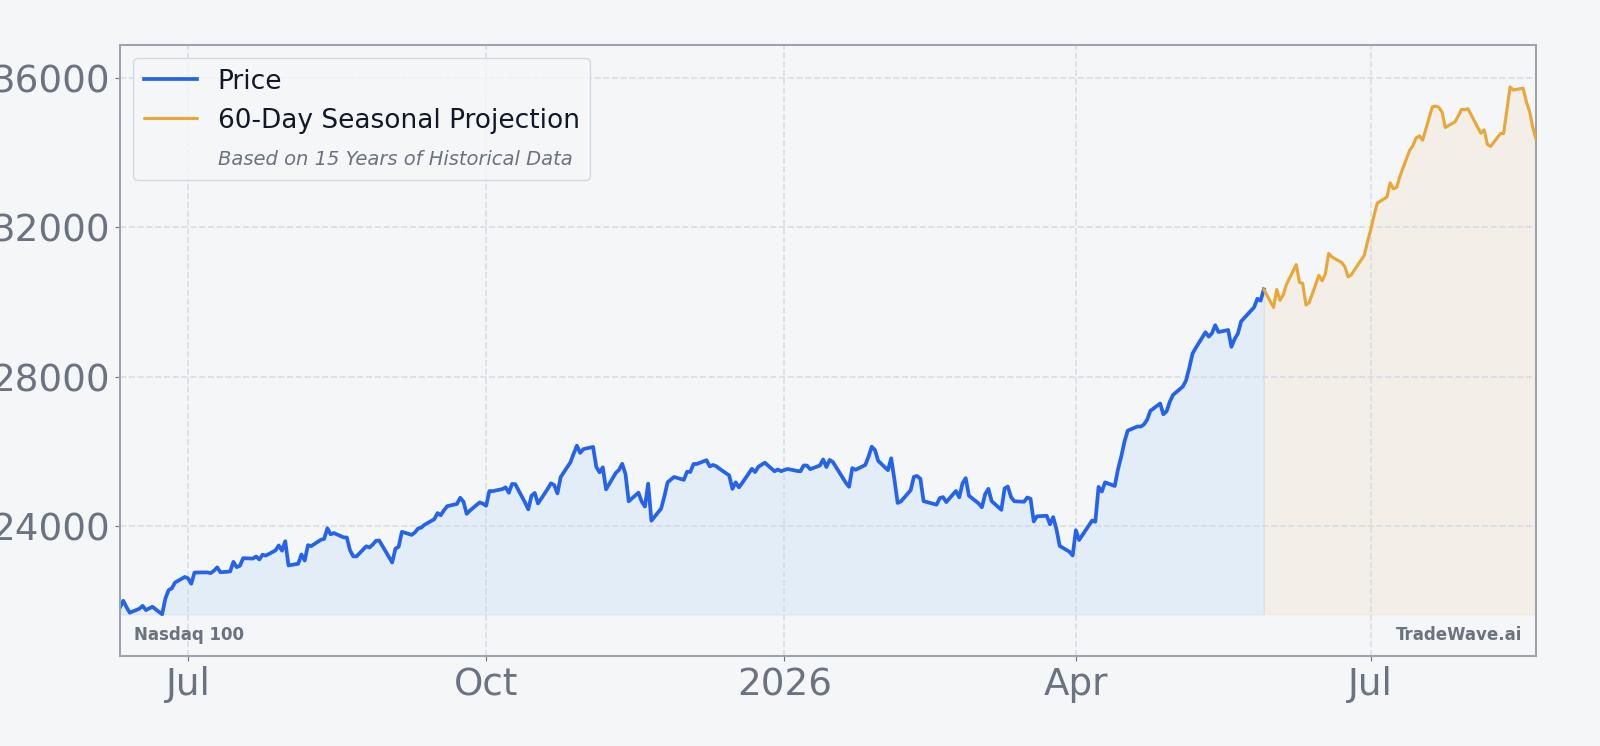
Nasdaq 100 finished Tuesday at 29,481.64, up 124.37 points or 0.42%, after trading between 29,423.63 and 29,663.89 on the day.[1] The index is effectively at record territory, sitting about 1.9% below its 52-week high of 30,044.49, with a one-month gain of 9.87% that reflects a powerful run in large-cap growth and AI-linked names.[1] Turnover remains heavy, with 20-day average volume near 9.13 billion shares across the Nasdaq 100 complex, suggesting broad participation in the move rather than a narrow squeeze.[1]
Under the surface, leadership has stayed concentrated in the mega-cap technology and communication services names that dominate the index, while more cyclical and value-oriented segments have lagged. That concentration cuts both ways. It has powered the index to fresh highs but also leaves NDX more sensitive to any wobble in a handful of giants, especially as regulators and index providers continue to refine rules around how quickly new large listings can enter the benchmark.
In February 2026, Nasdaq proposed a “fast entry” rule to speed up inclusion of large new listings into the Nasdaq 100, a move aimed at keeping the index aligned with the market’s most important growth stories.[2] For traders, that backdrop means the composition of NDX could evolve more quickly around the edges, even as the core mega-cap complex continues to dominate index-level performance.
The chart below situates the latest push toward record highs in the context of the past year and overlays the upcoming seasonal projection.
What should traders watch as this Nasdaq 100 window opens?
The first checkpoint is simple: how NDX behaves as the Jun 10 window begins relative to its current near-record level. A continuation of strong breadth within the index, with more constituents participating in the upside and holding above key moving averages, would be consistent with the historical seasonal trend. A sharp reversal or a failure to hold recent gains into late June would mark a clear departure from the 15-year pattern.
Second, watch how leadership rotates inside the index. If the rally broadens beyond the usual mega-cap names and into second-tier growth and software, that would signal a healthier risk-on tone that has often accompanied strong early-summer windows. If instead the move narrows further into a handful of AI and chip leaders while the rest of the index stalls, the seasonal tailwind could be offset by concentration risk.
Finally, monitor macro and policy headlines that intersect with tech, from regulation to index methodology changes. Any acceleration of the “fast entry” approach for large new listings could alter flows into and out of NDX-linked products over time, even if the immediate impact is modest.[2] The historical pattern says this 40-day stretch has been friendly to longs, but the way breadth, leadership and policy interact in June and July will determine whether 2026 keeps the streak alive or breaks it.
Sources
About this seasonal analysis
Seasonal pattern data is sourced from TradeWave.ai, which analyzes historical price behavior across annual calendar windows going back up to 30 years. Read the full data methodology or the book The 100-Year Pattern by Afshin Moshrefi (2026 edition). Past performance of seasonal patterns does not guarantee future results. This article is for informational purposes only and does not constitute investment advice.