CBOE Volatility Index (VIX) Faces 100% Midterm June Losing Record as Short Window Nears
CBOE Volatility Index is sitting near the middle of its 52-week range as it heads toward a mid-June window that has consistently seen volatility compress in past midterm election years.

What is the seasonal pattern for CBOE Volatility Index (VIX)?
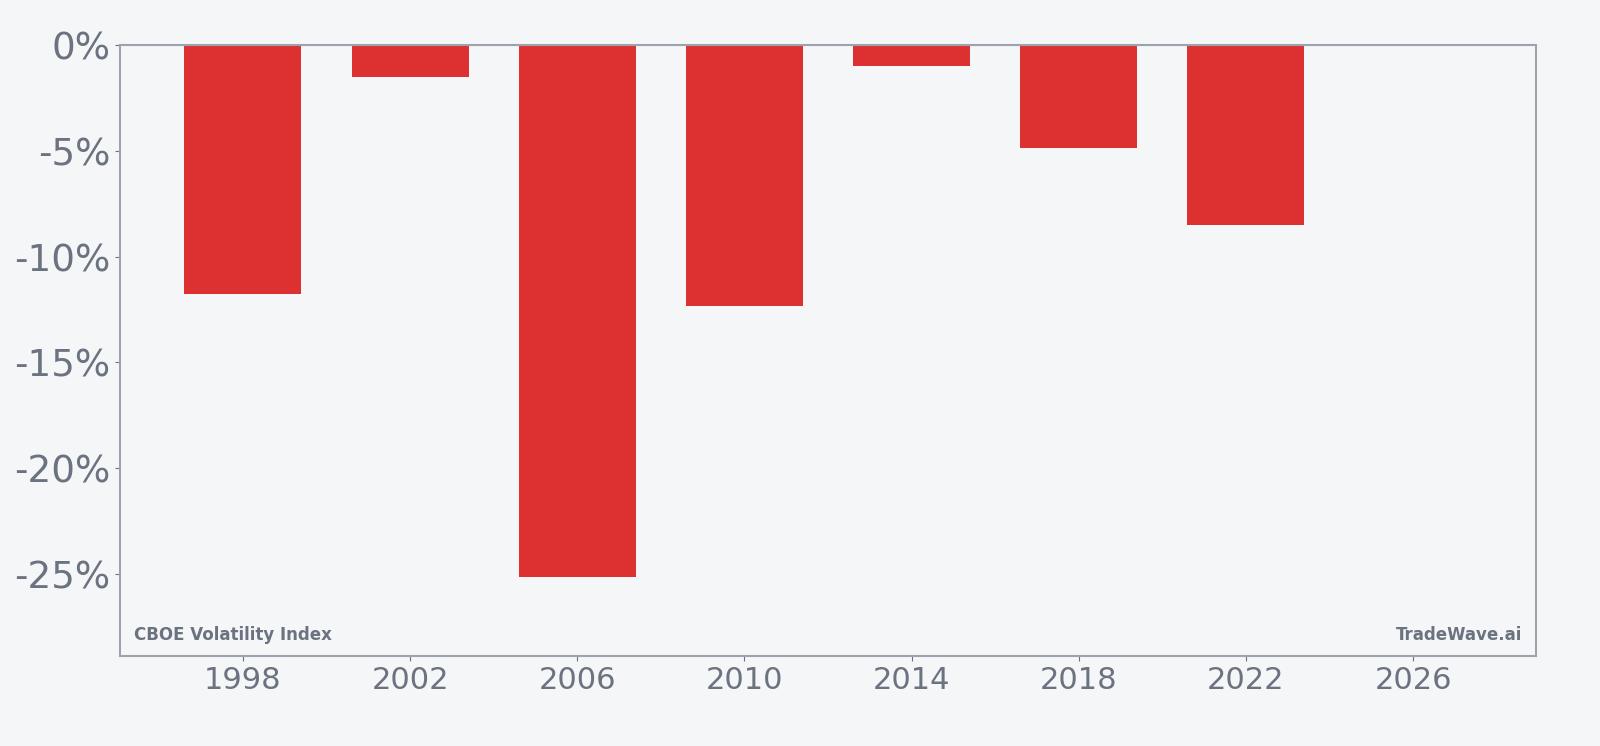
CBOE Volatility Index has fallen in 7 of 7 midterm-year June windows during this five-day stretch, with an average 9.3% decline in winning years.
- 7 for 7 in this window, with VIX dropping an average 9.3% in those winning midterm-year episodes.
- Seasonal direction is bearish for volatility: the pattern favors short VIX exposure over the five trading days starting Jun 13.
- Percent Profitable is 100%, with 7 winners and 0 losers across the last seven midterm election years in this window.
- Annualized return for the pattern is 9.04%, with a Sharpe ratio of 1.11 based on end-of-window outcomes.
- The TradeWave Ratio of 1.13 suggests VIX typically travels meaningfully in the trade direction within the window, not just at the close.
- Individual years have seen sizable intraperiod swings, including adverse moves of up to 34.27% before the eventual decline.
According to historical data from TradeWave.ai, this specific mid-June stretch in midterm election years has behaved very differently from an average week for volatility, and the next iteration is less than a month away.
How has CBOE Volatility Index (VIX) behaved in this mid-June window?
CBOE Volatility Index has fallen in every single midterm-year mid-June window in the TradeWave sample, with seven straight declines averaging 9.3% over just five trading days. Today VIX closed at 17.82, down 3.3% on the session and sitting about 49.5% below its 52-week high of 35.3 and 33.2% above its 52-week low of 13.38. That combination of a clean historical pattern and a mid-range starting point gives this year’s window room to matter if volatility again compresses into the early summer.
Because this study groups only midterm election years, it is effectively isolating a single phase of the presidential cycle. Midterm years often feature policy noise and rate uncertainty early in the year, followed by calmer stretches as the policy calendar clears, which can translate into distinct volatility regimes around the summer.
The trade direction for this pattern is short, which means the historical “wins” are years when implied volatility drifted lower over the five-day span. Across the seven midterm-year samples, VIX posted net declines ranging from modest single digits to a drop of 25.12% in 2006, when the index fell from 23.81 to 17.83 over the window. Even the smallest decline, a 0.99% slip in 2014, still counted as a profitable outcome for a short-volatility stance in this specific CBOE Volatility Index trading window.
Average profit of 9.3% reflects only those winning years, but because there were no losing years in the sample, the all-years average is effectively the same. The median outcome of 8.5% shows that the typical midterm-year result has been a high single-digit drop in VIX over just one trading week. Add it up: 83% cumulative return across the seven windows for a strategy that simply repeated the same short setup each midterm year.
The intraperiod path has not been smooth. Maximum favorable excursions, the best point-to-peak moves in the trade direction, ranged from 2.12% in 1998 to 15.03% in 2002, showing that some years delivered most of their edge in a quick burst. On the flip side, maximum adverse excursions, the worst drawdowns from entry, have been as deep as 34.27% in 2006 and 18.4% in 2022, meaning short positions had to sit through sharp volatility spikes before the eventual fade.
That MAE and MFE profile paints this as a high-variance but directionally consistent window. In several years, such as 2002 and 2018, VIX first popped higher by mid-single to low-double digits before rolling over, while in others, like 2010, the index simply bled lower with limited upside noise. For traders, the message is that the historical edge has come with real intraday and intraperiod stress, not a gentle glide path.
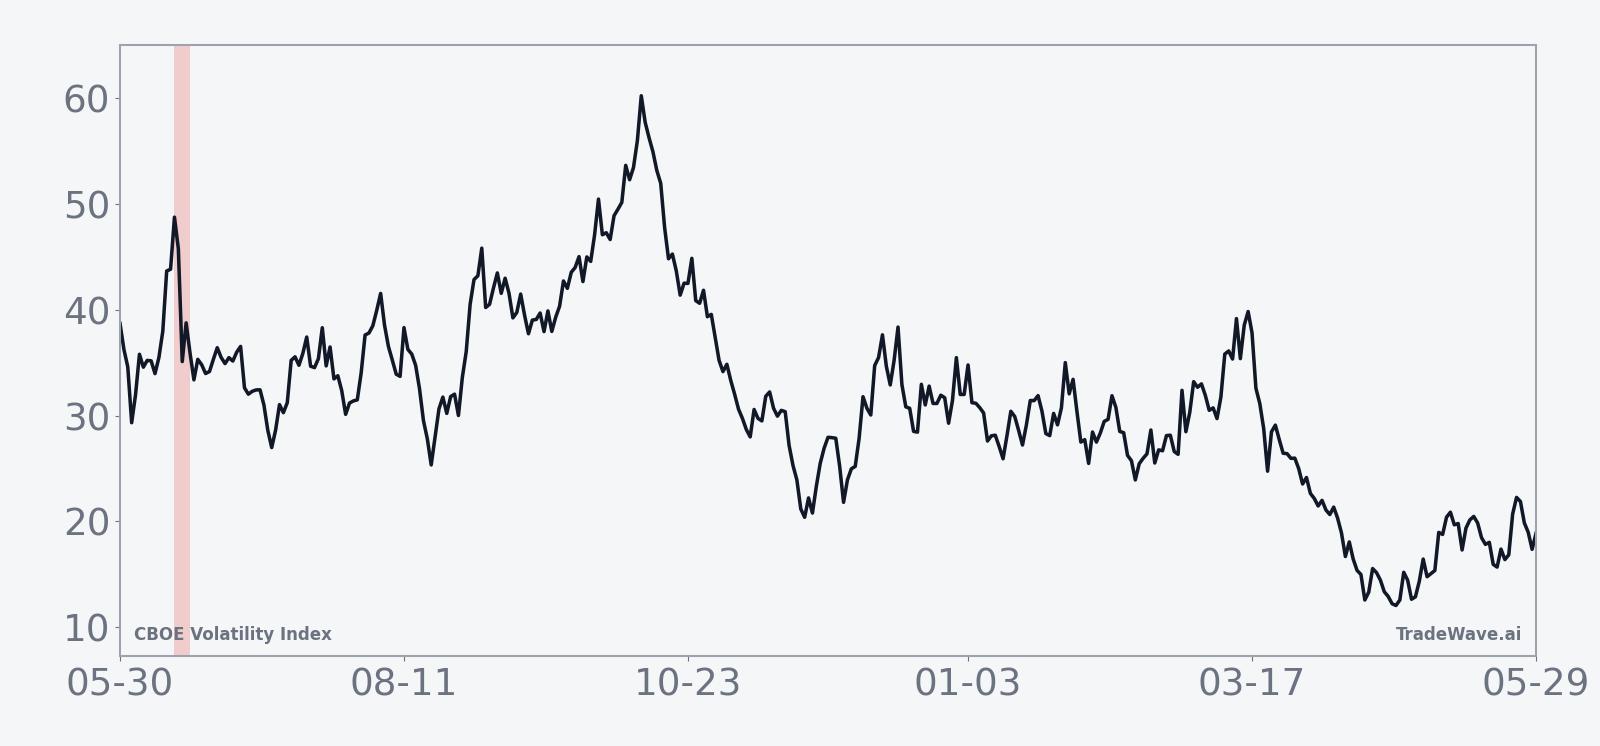
The historical seasonal average in the trend chart suggests that most of the decline tends to accrue steadily across the window rather than in a single day. The curve slopes lower from day one through day five, with only modest mid-window bumps, which fits a pattern of volatility gradually leaking out as equity markets stabilize into mid-June during midterm years.
The combined net, best-case, and worst-case bars highlight how far VIX has tended to swing inside this short window.
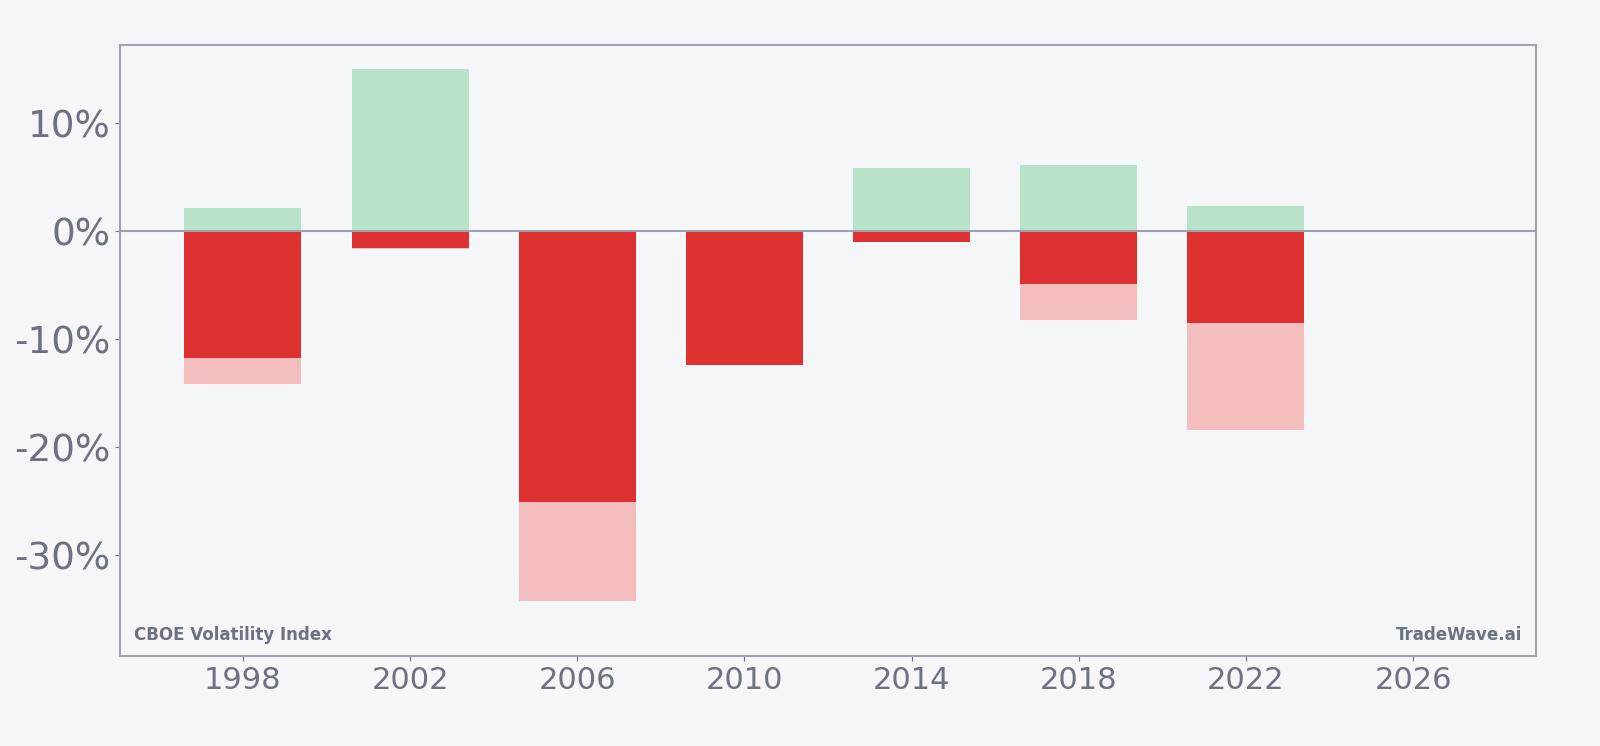
The stacked net/MFE/MAE bars make the trade-off clear: every year finished with VIX lower, yet several saw double-digit spikes against the short before the decline took hold. Large favorable moves combined with large adverse swings point to a window where volatility has often whipped around before settling lower, rather than drifting quietly in one direction.
History does not guarantee future results; adverse excursions (MAE) can be large even in winning windows.
Why does CBOE Volatility Index (VIX) follow this seasonal pattern?
This mid-June pattern may reflect how the policy and earnings calendar line up in midterm election years. One likely driver is that major macro and central bank decisions often cluster earlier in the quarter, leaving a quieter patch by mid-June when realized equity volatility tends to cool. Analysts also point to options expiration and institutional portfolio rebalancing around this time, which can encourage volatility selling and help pull implied volatility lower when headline risk is not escalating.
What is driving CBOE Volatility Index (VIX) today?
CBOE Volatility Index slipped 3.3% on May 18 to close at 17.82, extending a one-month decline of 5.56% and leaving the gauge roughly in the middle of its 52-week band between 13.38 and 35.3. That mid-range level follows a stretch earlier this year when geopolitical headlines briefly pushed VIX into the low 20s, including a move to 23.42 in March 2026 as conflict in the Middle East rattled risk assets and lifted demand for equity protection.[1] In broad terms, implied volatility has been fading as those shocks recede, even as traders remain alert to how quickly VIX can reprice when macro risk flares.
The chart below situates the latest pullback in VIX within its past year of trading and a 60-day seasonal projection.
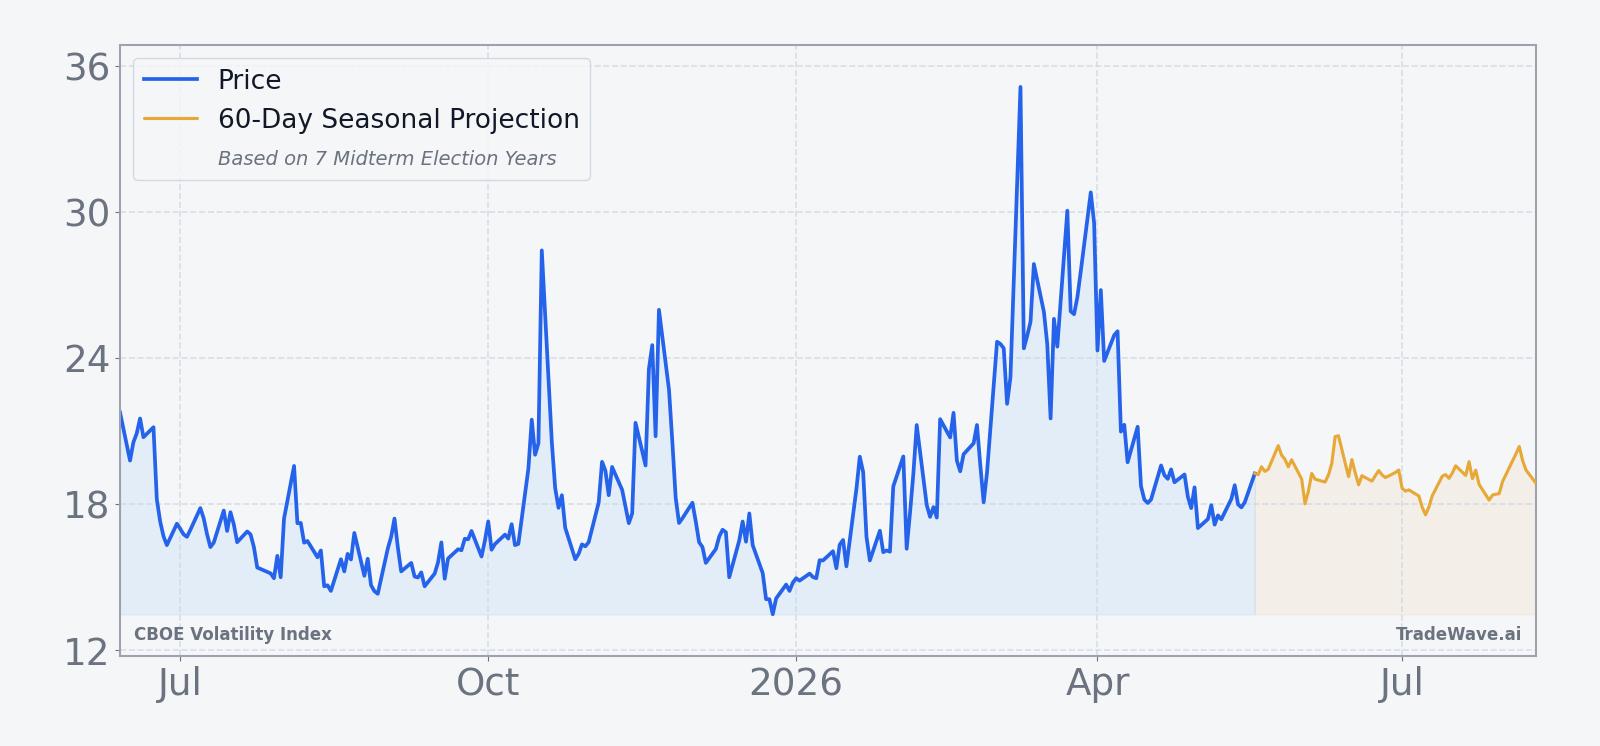
Because VIX typically moves opposite to equity prices, the current drift lower lines up with a market that has been willing to look through individual macro shocks and lean back into risk. The upcoming mid-June seasonal window sits inside that backdrop: if equities stay supported and realized volatility remains contained, the historical pattern of VIX compression has room to reassert itself. If instead a fresh macro or policy surprise hits, this is the kind of short, historically directional window where the MAE history reminds traders how quickly volatility can move against complacent positioning.
What should traders watch as the mid-June VIX window approaches?
First, the calendar: the five-day window begins on Jun 13 and runs through Jun 19, squarely in the mid part of the midterm election year. Any major policy headlines or geopolitical surprises landing in that span could disrupt the usual pattern of volatility bleed. Second, levels: on the downside, traders will watch whether VIX can revisit the low-teens area near 13.5 that has marked the 52-week floor, while on the upside, a quick jump back into the mid-20s would look more like the adverse excursions seen in 2006 and 2022 than the average path.
Third, behavior inside the window will matter as much as the final print. A steady grind lower in VIX with only shallow intraday pops would echo the smoother years in the sample and fit the historical seasonal trend. A sharp spike early in the window followed by a fade would rhyme with the high-MAE years, where shorts were ultimately rewarded but only after absorbing significant heat. Finally, if VIX instead holds firm or pushes higher into and through the window, that would mark a clear break from the seven-for-seven record and signal that this midterm election year is trading on a different macro script than its predecessors.
Sources
About this seasonal analysis
Seasonal pattern data is sourced from TradeWave.ai, which analyzes historical price behavior across annual calendar windows going back up to 30 years. Read the full data methodology or the book The 100-Year Pattern by Afshin Moshrefi (2026 edition). Past performance of seasonal patterns does not guarantee future results. This article is for informational purposes only and does not constitute investment advice.