VIX Spike on Trade and Bank Fears Meets a Historically Weak June Stretch for CBOE Volatility Index (VIX)
CBOE Volatility Index is trading near the lower end of its past-year range as it approaches a June 19 seasonal window that has often seen volatility grind lower rather than spike.
What is the seasonal pattern for CBOE Volatility Index (VIX)?
CBOE Volatility Index has fallen in 6 of 10 years during this late-June 23-day window, with an average 15.95% gain for winning short-volatility years.
- 6 wins and 4 losses for short VIX exposure in this window over the past decade, with winning years averaging 15.95% moves in the trade direction.
- The 23-day window beginning Jun 19 has been modestly favorable for short VIX trades, with 60% Percent Profitable across 10 years.
- Including both winners and losers, Avg Profit - All clocks in at 8%, showing that losing years have meaningfully reduced the headline average.
- Individual losing years have been large, with several double-digit spikes against the short-volatility stance before the index ultimately settled.
- The TradeWave Ratio of 1.86 suggests VIX often travels significantly in the trade direction inside the window, even when the final close is less dramatic.
- Sharpe ratio of 0.65 points to a positive but choppy historical profile, consistent with a volatility index that can swing sharply around macro shocks.
According to historical data from TradeWave.ai, this early-summer stretch has behaved differently from a typical month for volatility, with a distinct bias that short-volatility traders will recognize.
Seasonal window
This seasonal window begins on Jun 19 and spans 23 trading days, and over the past decade it has slightly favored lower VIX readings that benefit short volatility positions. Today the CBOE Volatility Index sits at 16.06, about 54.5% below its 52-week high of 35.30 and roughly 20.0% above its 52-week low of 13.38, leaving it in the lower third of its one-year range.
Trade direction for this pattern is explicitly short, which means years where VIX drifted lower or stayed contained were favorable, while sudden volatility spikes produced losing outcomes. Across the 10-year sample, 6 years finished as winners for short exposure and 4 as losers, giving a 60% Percent Profitable record. Winning years were not small: the average gain in those favorable windows was 15.95%, while including all years, winners and losers together, trims the average to 8%.
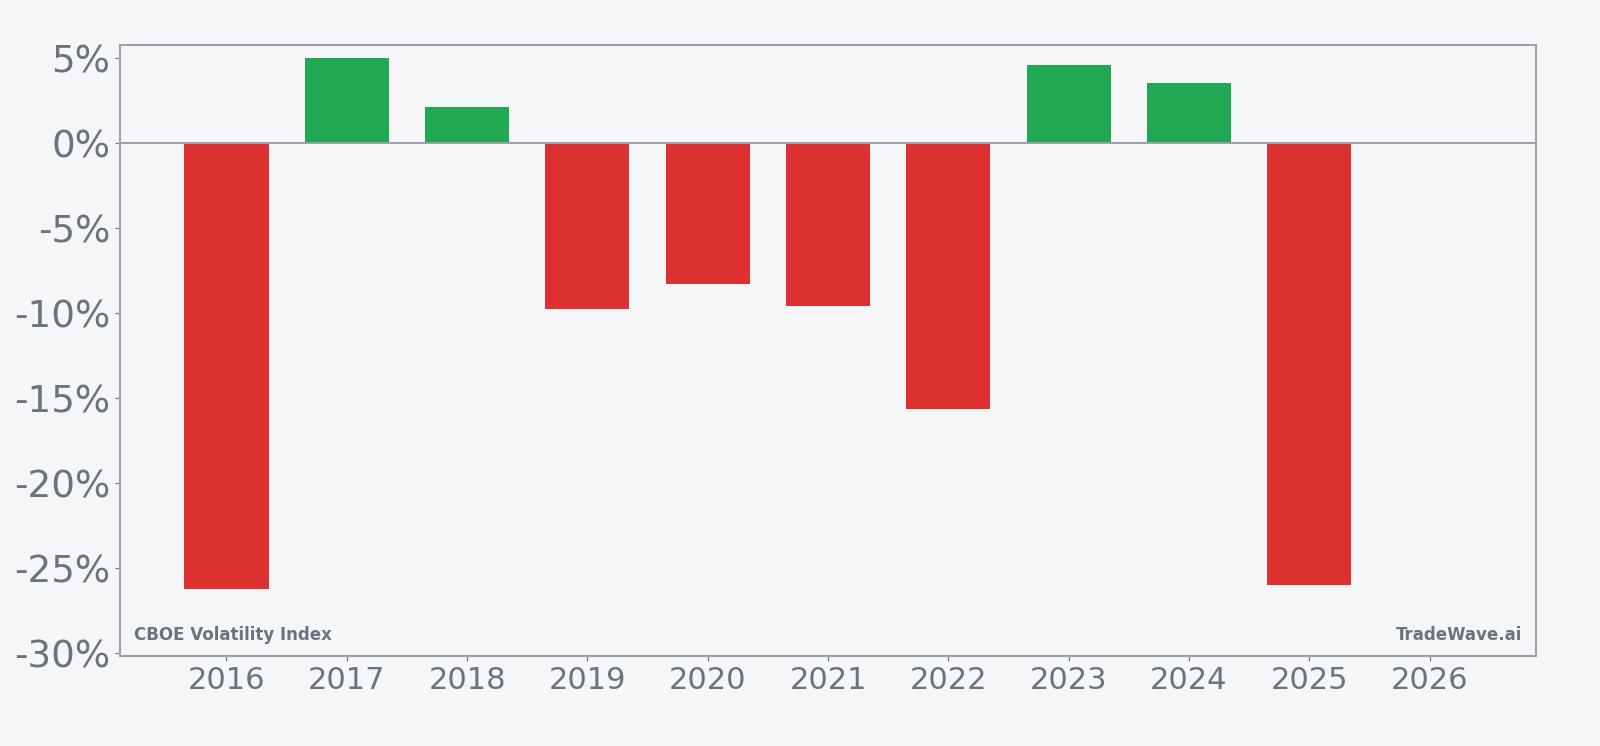
The per-year breakdown shows how uneven those outcomes have been. In 2016 and 2025, for example, short VIX trades were hit hard, with net returns of -26.29% and -26.03% respectively as volatility stayed elevated or rebounded into the close of the window. By contrast, calmer stretches such as 2017, 2018, 2023 and 2024 delivered modest single-digit gains for shorts, enough to keep the overall profile positive but not overwhelmingly one-sided.
The historical seasonal trend chart suggests VIX often starts this window with a brief wobble higher before grinding lower into the back half of the period. That pattern fits a typical early-summer environment where equity markets are calm and implied volatility bleeds off after spring macro events. The cumulative return profile across the decade adds up to a 105% gain for the short-volatility stance, which is sizable for a relatively short window.
Yearly net and peak moves highlight how far VIX has swung inside the window before settling.
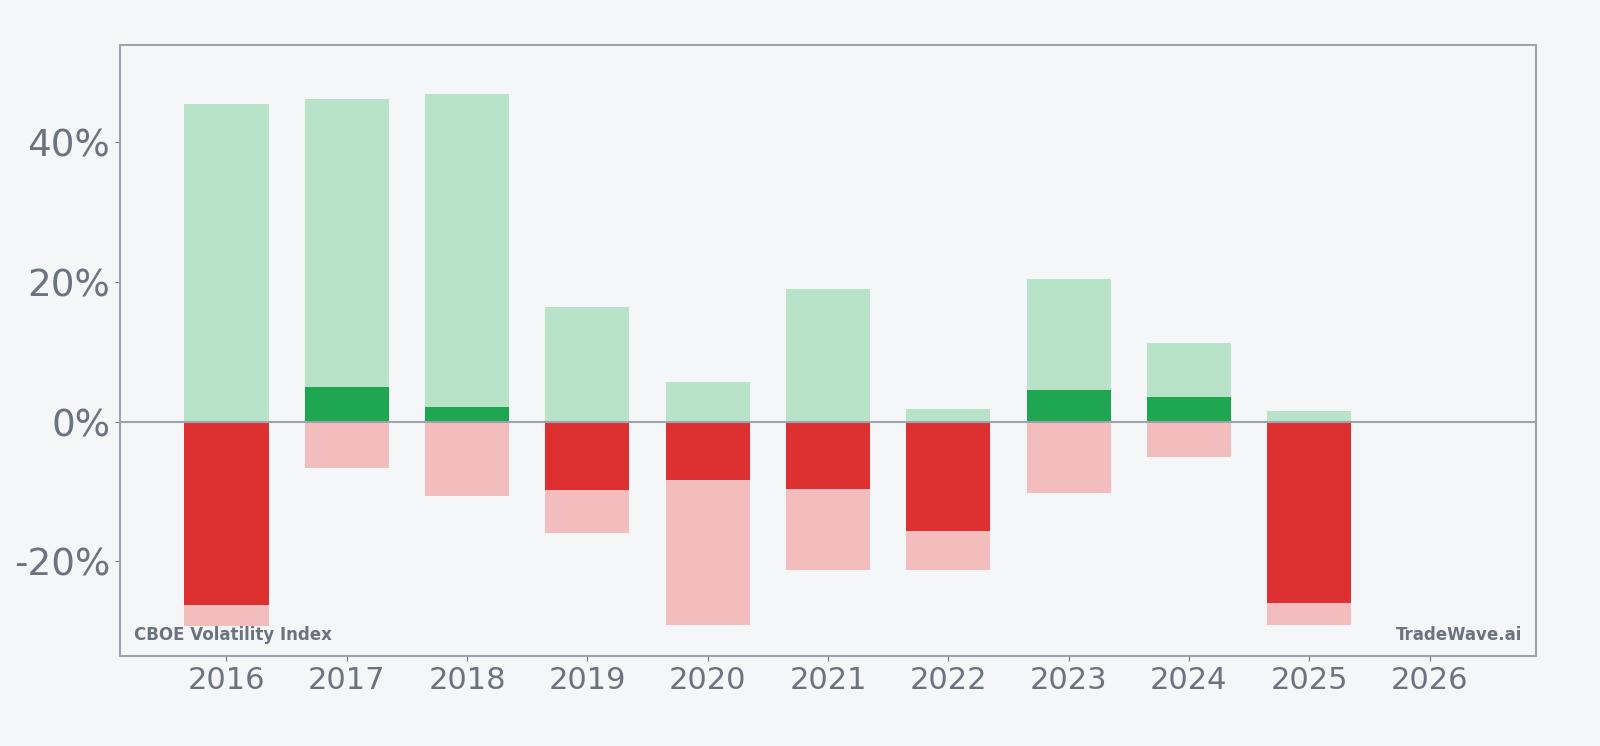
The bar chart that combines net results with maximum favorable and adverse excursions shows why this window feels more volatile than the final numbers suggest. In several years, VIX’s best intraperiod move in the trade direction was north of 40%, while the worst drawdowns against the short position also ran into the 20% to 30% range. That mix of large maximum favorable excursion and large maximum adverse excursion means the window has historically offered meaningful opportunity for short-volatility trades, but only for investors who can tolerate sharp swings along the way.
Put together, the pattern is clear but not ironclad: this early-summer window has leaned in favor of lower VIX readings and short-volatility exposure in 6 of the past 10 years, with big winners offset by a handful of painful spikes.
Why does CBOE Volatility Index (VIX) follow this seasonal pattern?
This early-summer VIX seasonal trend may reflect a lull in macro catalysts after the first-half run of central bank meetings, earnings seasons and major data releases. Analysts often point to lighter trading volumes, reduced corporate news flow and a pause in portfolio repositioning as reasons implied volatility tends to compress into late June and early July. Options expiration patterns and systematic volatility selling strategies can reinforce that drift lower, until an unexpected macro shock interrupts the calm.
History does not guarantee future results; adverse excursions (MAE) can be large even in winning windows.
What is driving CBOE Volatility Index (VIX) today?
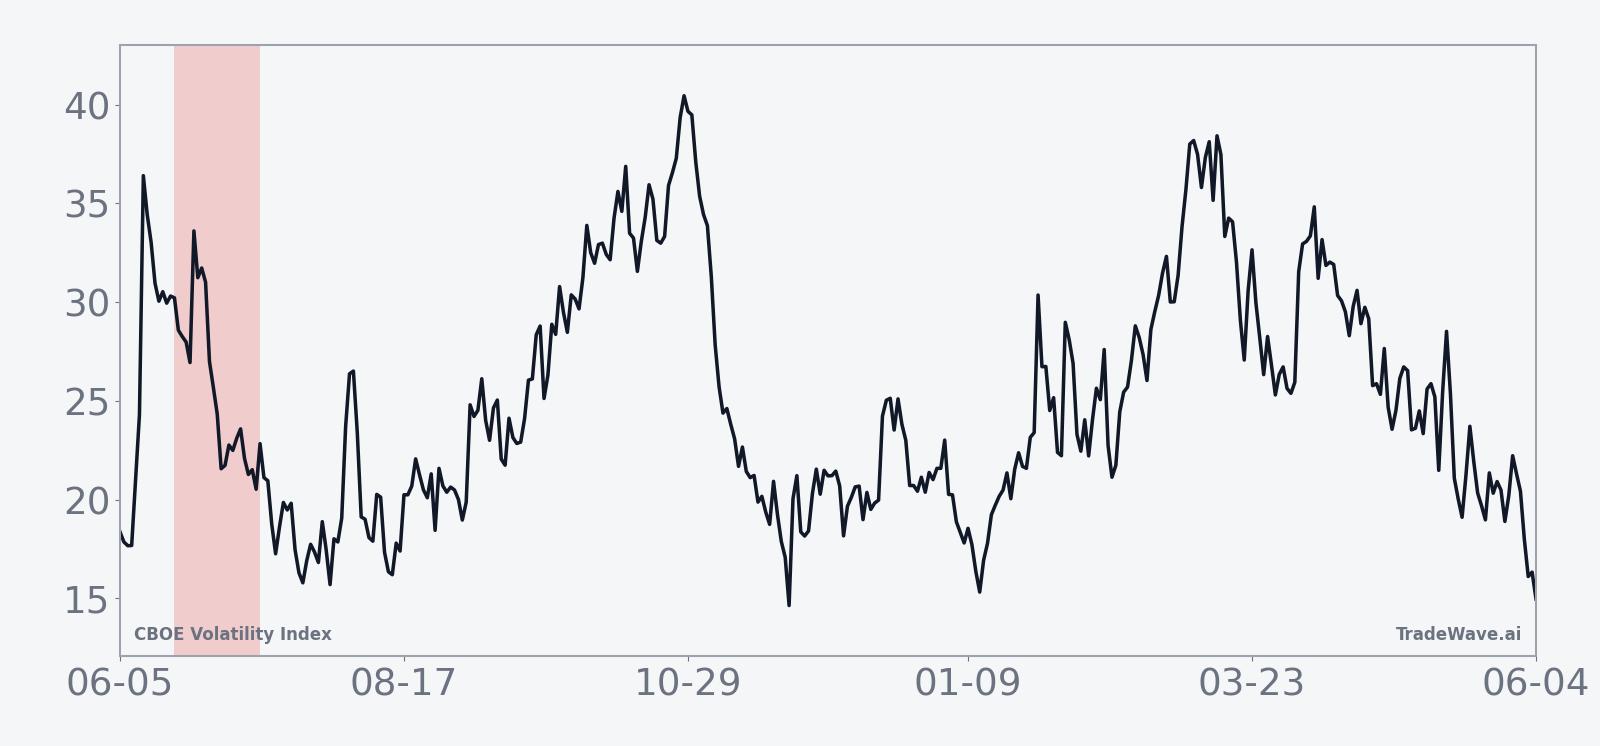
CBOE Volatility Index closed at 16.06 on Jun 3, up 1.8% on the day, and sits well below its 52-week high of 35.30 but still above the 13.38 low, underscoring a market that is calmer than last year’s stress episodes but not fully complacent. The index has retreated sharply from the low-20s level reached on Mar 18, 2026, when Middle East conflict and hotter producer inflation data briefly pushed implied volatility higher as investors scrambled for protection.[1] That spike faded as geopolitical headlines stabilized and inflation fears cooled, leaving VIX back in a mid-teens band that has often coincided with steady equity markets and selective sector volatility.
The chart below situates the latest move in its recent multi-month context and overlays the upcoming seasonal projection.
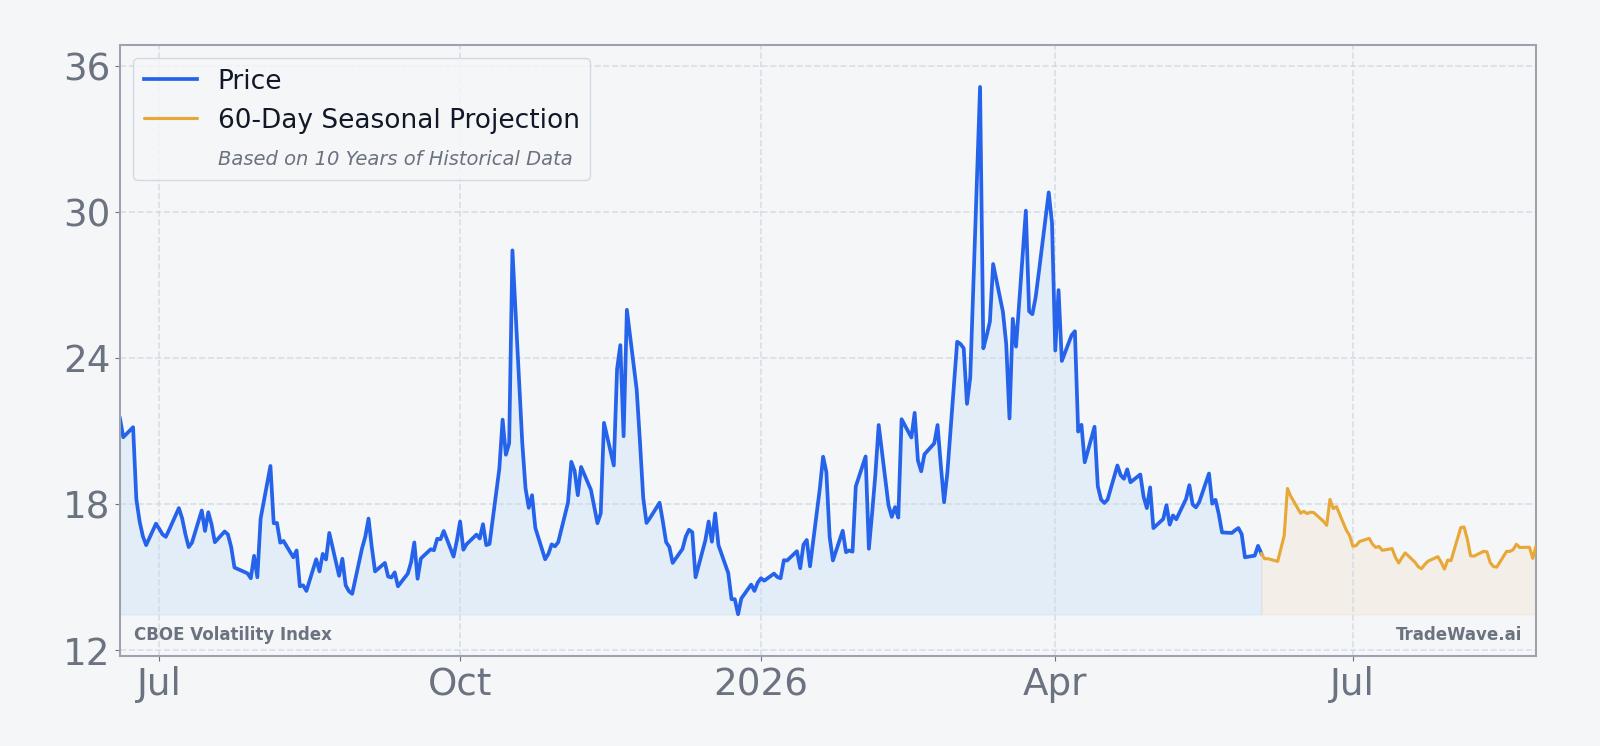
At current levels, VIX is roughly in line with its behavior during prior calm stretches, even as pockets of the market, such as semiconductor options, have shown much higher implied volatility than the headline index.[2] That divergence matters because VIX is built on S&P 500 options, so sector-specific stress can be masked when the broader benchmark is grinding sideways. For traders watching the upcoming seasonal window, the key question is whether this calm persists into late June or whether another macro shock, such as renewed geopolitical tension or a surprise inflation print, jolts implied volatility higher again.
What should traders watch as this VIX seasonal window approaches?
With VIX sitting in the mid-teens and the June 19 window approaching, the first thing to watch is whether the index can stay below the 20 level that has repeatedly marked the line between routine equity chop and more serious risk-off episodes. A sustained move back into the low-20s ahead of the window would signal that macro anxiety is building again, which historically has turned some of these short-volatility years into losers. Conversely, if VIX drifts toward the 14 to 15 area and realized equity volatility remains muted, the backdrop would look more like the calmer years in the seasonal sample.
Second, monitor cross-asset and sector volatility, especially in areas that have recently shown stress such as technology and semiconductors.[2] If single-stock and sector options stay bid while index volatility remains subdued, the seasonal pattern could still play out as a grind lower in VIX even as traders hedge specific pockets of risk. A broad-based pickup in both sector and index volatility, by contrast, would argue that the market is transitioning into a different regime than the one captured by the past decade’s early-summer windows.
Finally, keep an eye on the macro calendar around the window: central bank meetings, key inflation releases and any escalation in geopolitical flashpoints have historically been the catalysts that break otherwise quiet seasonal patterns.[1] If those events pass without major surprises and equity indices hold their ground, the historical tendency for VIX to soften into late June and early July will remain the baseline backdrop, even if the path includes sharp intraday swings along the way.
Sources
About this seasonal analysis
Seasonal pattern data is sourced from TradeWave.ai, which analyzes historical price behavior across annual calendar windows going back up to 30 years. Read the full data methodology or the book The 100-Year Pattern by Afshin Moshrefi (2026 edition). Past performance of seasonal patterns does not guarantee future results. This article is for informational purposes only and does not constitute investment advice.