Nasdaq 100 (NDX) Hits Record Close as Israel-Iran Truce Meets Bullish Late-June Window
Nasdaq 100 is sitting just below record highs as it approaches a late-June trading window that has historically delivered steady upside with limited average pullbacks.

What is the seasonal pattern for Nasdaq 100 (NDX)?
Nasdaq 100 has risen in 18 of 19 years during this late-June 25-day window, with an average gain of 4.35% in winning years.
- 18-for-19 record in this window, with winning years averaging 4.35% gains and only one losing year across the sample.
- The 25-day pattern starts on Jun 28 and has been profitable 95% of the time, with 18 winners and 1 loser.
- Including the lone down year, the all-years average return still comes in at 4%, pointing to a consistently bullish NDX seasonal trend.
- Average loss in the single negative year was just 0.84%, while the TradeWave Ratio of 2.07 signals meaningful travel in the trade direction inside the window.
- A Sharpe ratio of 1.46 for this slice of the calendar suggests historically strong risk-adjusted performance compared with typical index behavior.
- Intraperiod swings have featured solid upside bursts alongside manageable drawdowns, making this one of the cleaner Nasdaq 100 trading windows on the calendar.
According to historical data from TradeWave.ai, this late-June stretch has behaved very differently from an average month for the Nasdaq 100, and the next iteration is about to open again.
How has Nasdaq 100 (NDX) traded in this late-June seasonal window?
Nasdaq 100 has posted gains in 18 of the past 19 years during the 25 trading days starting Jun 28, with winning years averaging 4.35% and only one modest loss on record. The index last closed at 30,347.08, down 0.19% on the day and about 1.4% below its 52-week high of 30,762.20.[1] For traders, that combination of near-record levels and a historically strong seasonal window turns the coming month into a key test of whether the tech-led rally can keep grinding higher.
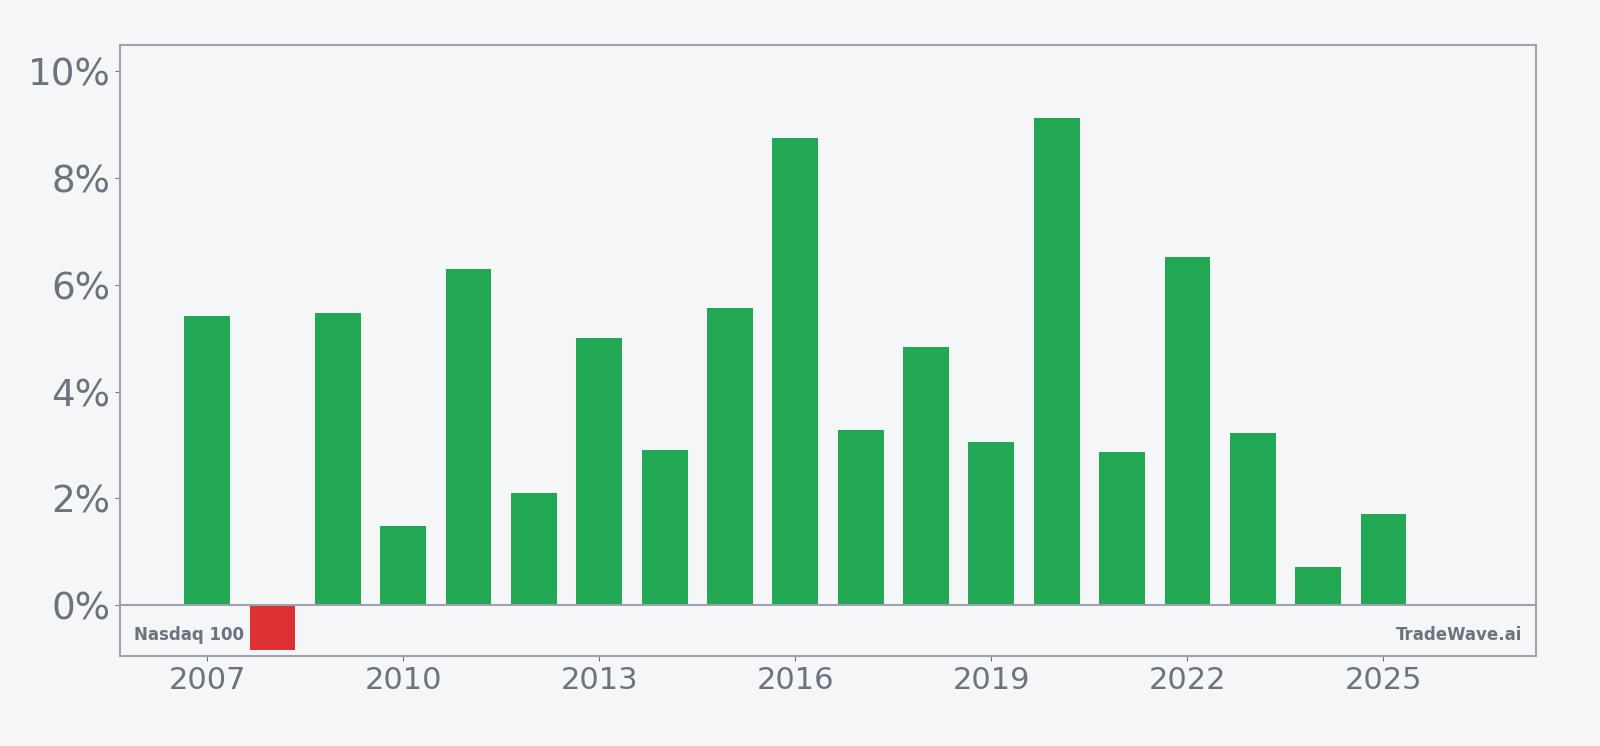
Historically, this has been a long-biased window for NDX. The pattern’s trade direction is long, with 95% of years finishing higher over the 25-day span and only one down year, which lost 0.84%. Average gains across all years, including that loser, still sit at 4%, which is unusually strong for a one-month index move.
The per-year breakdown shows how consistent the upside has been. In 2020, the index rallied 9.13% during this stretch, with a best intraperiod run-up of 11.12% and almost no drawdown from entry. In 2016, NDX gained 8.75% with a peak move of 8.86% and only a 0.74% adverse excursion, while 2018 delivered a 4.84% net gain with a 5.5% best run-up and less than 1% downside from the starting point.
Even the softer years have tended to respect the bullish seasonal bias. In 2024, the index finished the window up just 0.71%, but at one point it was ahead by 5.12% before giving back most of the move. The lone losing year in the sample saw a small 0.84% decline, underscoring that the downside outcomes in this slice of the calendar have historically been contained compared with the upside bursts.
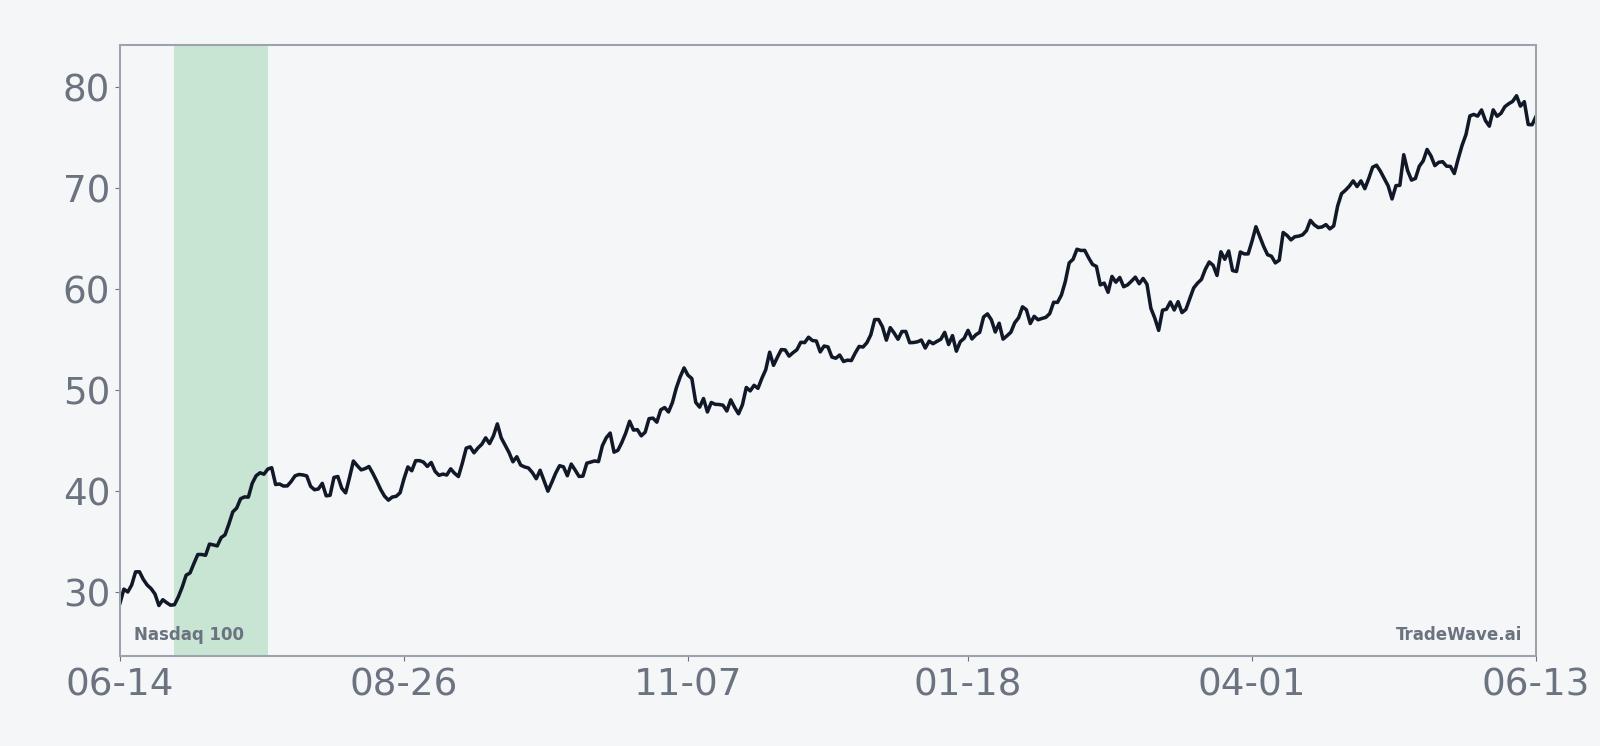
The 19-year seasonal trend line slopes higher through most of the window, with gains tending to build steadily rather than in a single spike. The typical pattern shows early strength in the first half of the window, a brief mid-period pause, then another push higher into the final days, which aligns with the strong average returns and high win rate.
A closer look at yearly net returns and intraperiod swings shows how upside and downside have stacked up.
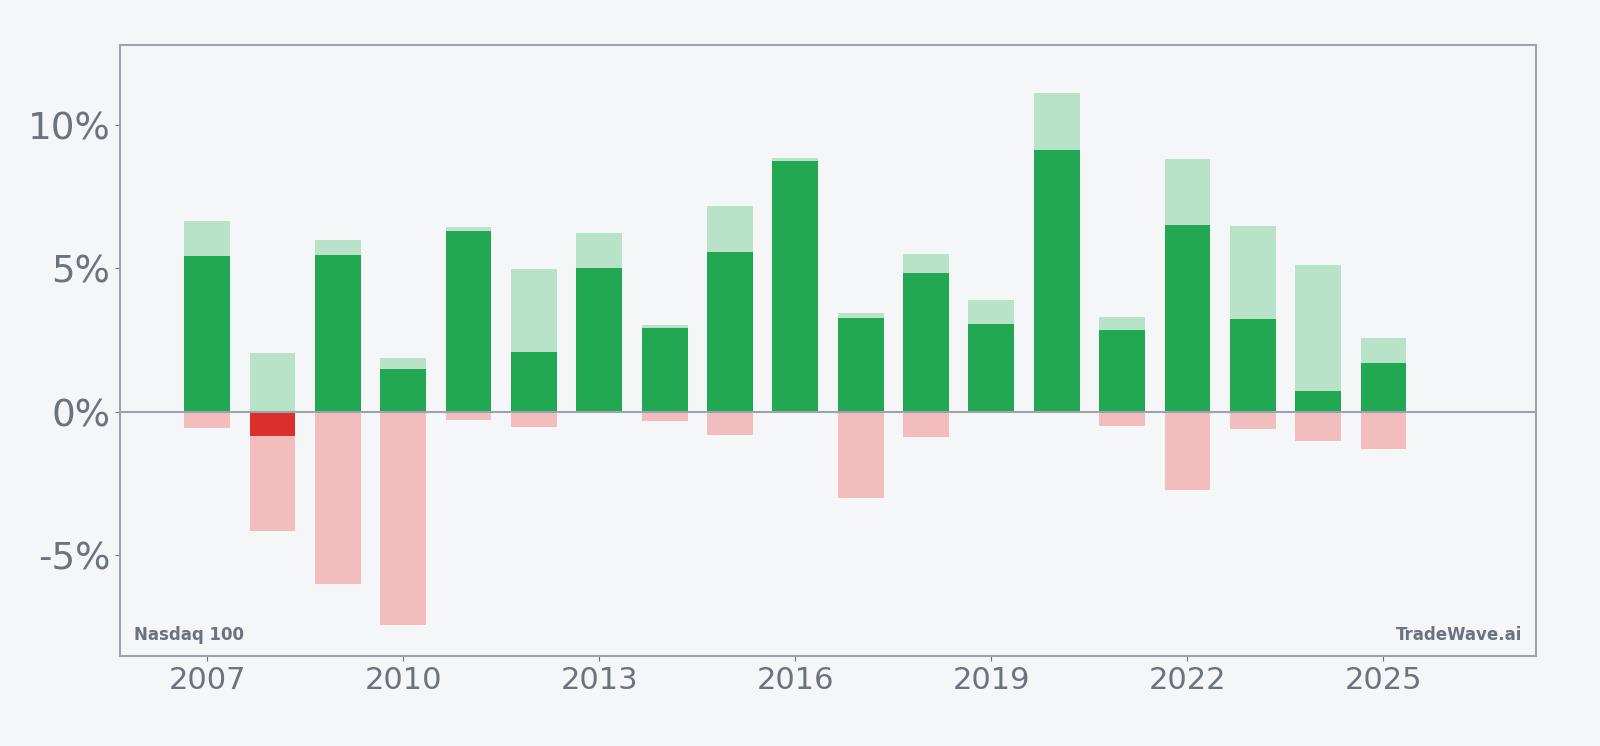
The combined net, peak-upside and worst-drawdown bars show a clear pattern: in most years, the maximum favorable move inside the window has been meaningfully larger than the maximum adverse move, and the final net result has usually landed closer to the upside extreme than the downside. That profile, together with the 2.07 TradeWave Ratio and 1.46 Sharpe ratio, marks this as one of the cleaner bullish seasonal windows for a major index.
History does not guarantee future results, and even in strong windows the worst intraperiod drawdowns can be uncomfortable before the pattern plays out.
Why does Nasdaq 100 (NDX) follow this seasonal pattern?
One likely driver is the way the tech-heavy index lines up with the late-June and early-July earnings pre-announcement season, when guidance updates and positioning ahead of big reports can favor growth stocks. Analysts have also pointed to quarter-end portfolio rebalancing and window-dressing, which can pull more flows into recent winners and large-cap tech. Options expiration and index reconstitution activity around this time may further amplify moves, helping to produce the steady upside bias seen in the historical seasonality.
What is driving Nasdaq 100 (NDX) today?
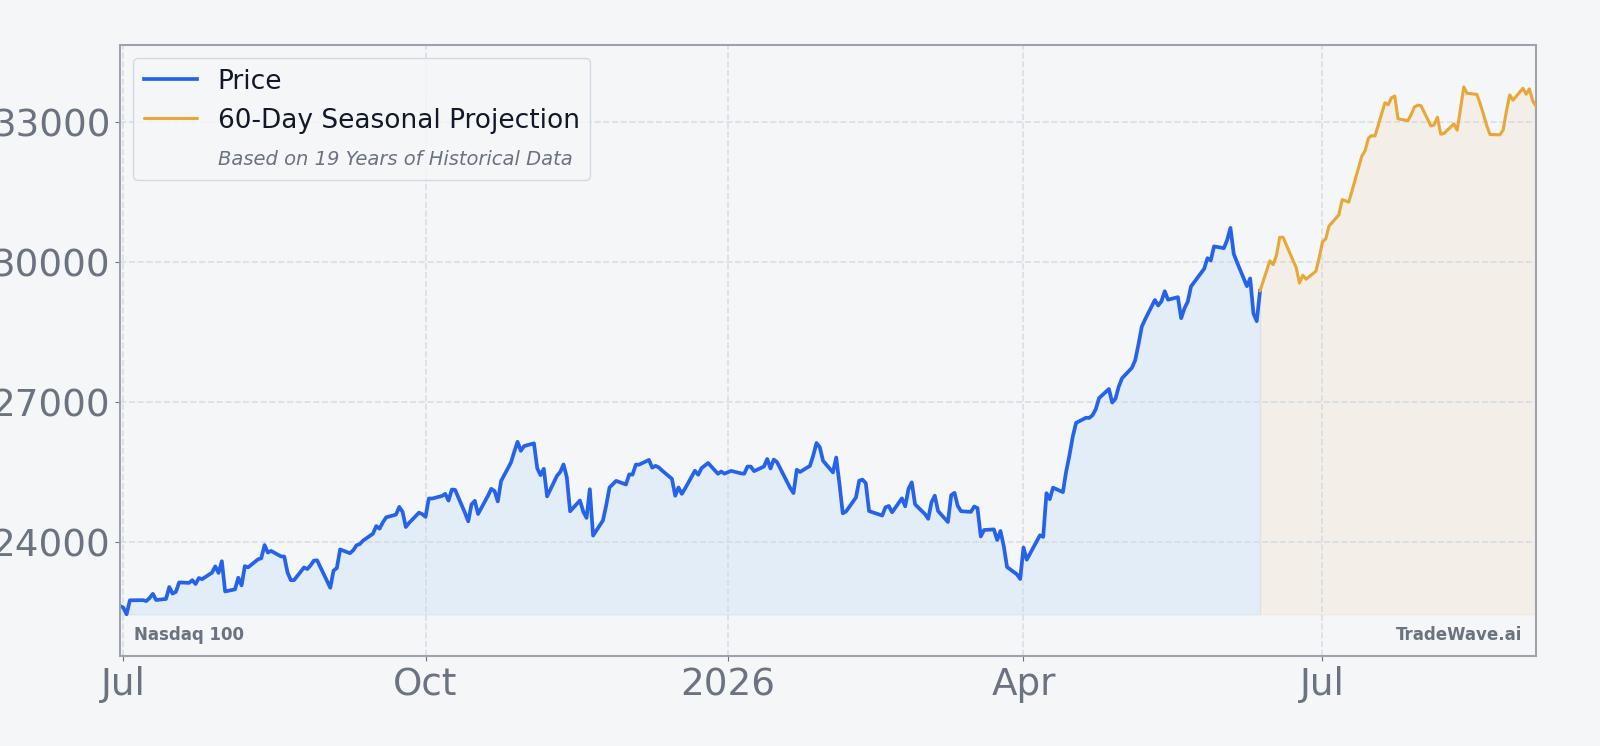
Nasdaq 100 last traded at 29,347.27 intraday, with a prior close of 30,347.08 that left the index about 1.4% below its 52-week high of 30,762.20 and roughly 41% above its 52-week low of 21,532.32.[1] The one-month return sits at a mild loss of 0.46%, suggesting consolidation rather than a sharp reversal, while the index still trades above its 50-day moving average of 28,674.03 on 20-day average volume of roughly 10.4 billion shares, a setup that keeps the broader uptrend intact even as short-term momentum cools.[1]
The chart below situates the latest move in its recent multi-month context alongside a 60-day seasonal projection.
In Jun 2025, Nasdaq 100 closed at a record high of 22,190.52 as a fragile truce between Israel and Iran helped ease geopolitical risk and support risk appetite.[2] That episode underscored how quickly macro headlines can push the tech benchmark to new highs when positioning is already bullish, a backdrop that remains relevant as the index again trades near records heading into this year’s late-June seasonal window.
What should traders watch as this NDX seasonal window opens?
First, the level to watch is the 52-week high near 30,762. A decisive break above that area early in the window would be consistent with the historical pattern of early strength and could keep the focus on whether NDX can log another 4% to 5% type move over the span. Failure to hold the 50-day moving average around 28,674 on any pullback would be the first sign that this year may diverge from the usual script.
Second, breadth inside the index will matter as much as the headline level. The historical pattern has often coincided with leadership from mega-cap growth, but the strongest years in the per-year table also show relatively shallow drawdowns, which typically require more than just a handful of stocks carrying the load. Traders will be watching whether gains broaden beyond the largest names or whether narrow leadership leaves the index more vulnerable to air pockets.
Third, macro and event risk can still override seasonality. The 2025 record close tied to Middle East headlines is a reminder that geopolitical developments can quickly change the tone for high-beta tech.[2] Any fresh flare-up in global risk, or a sharp repricing of interest-rate expectations, could produce a year that looks more like the lone small loser in the sample than the many strong winners.
Finally, behavior inside the window will offer a real-time check on the historical playbook. A pattern of early buying, shallow intraday dips and closes near session highs would line up with the 19-year seasonal trend. By contrast, repeated failures near resistance, heavier intraday selling and a break of the 50-day average would signal that this iteration is diverging from the usual Nasdaq 100 seasonal trend, even if the index ultimately finishes the window close to flat.
Sources
About this seasonal analysis
Seasonal pattern data is sourced from TradeWave.ai, which analyzes historical price behavior across annual calendar windows going back up to 30 years. Read the full data methodology or the book The 100-Year Pattern by Afshin Moshrefi (2026 edition). Past performance of seasonal patterns does not guarantee future results. This article is for informational purposes only and does not constitute investment advice.