Nasdaq 100 (NDX) Has Risen in 9 of 9 Midterm Jul 31-May 26 Runs, Averaging 22.28% Gains
Nasdaq 100 is entering a historically powerful 300-day midterm-year window just as the index snaps higher after the Fed, with tech volatility and options activity hinting at an active stretch ahead.
Price as of Jul 30, 2026: $28,106.35 (last close).

What is the seasonal pattern for Nasdaq 100 (NDX)?
Nasdaq 100 has risen in 9 of 9 midterm-year Jul 31–May 26 windows, with an average gain of 22.28% in winning years.
- 9 for 9 in this window, averaging 22.28% gains in winning years across the last 9 midterm election cycles.
- Seasonal window runs from Jul 31 through roughly May 26, spanning 300 calendar days in the midterm election year into the year before the presidential election.
- Percent Profitable is 100%, with 9 winners and 0 losers for long exposure in this Nasdaq 100 trading window.
- Median gain of 22.38% and cumulative return of 481% show how strongly this NDX seasonal trend has stacked over time.
- TradeWave Ratio of 1.4 and a Sharpe ratio of 1.39 point to historically strong upside moves relative to volatility.
- Individual years have still seen double-digit drawdowns inside the window, so intraperiod downside has been meaningful even when the final result was positive.
According to historical data from TradeWave.ai, this midterm-year stretch in Nasdaq 100 has behaved very differently from an average calendar year. The next section walks through how that pattern has played out across prior cycles and what it means for the current setup.
How has Nasdaq 100 (NDX) traded in this midterm-year seasonal window?
Nasdaq 100 has closed higher in every single Jul 31–May 26 window across the last 9 midterm election years, with average gains of 22.28% for long positions. The index enters this year’s iteration around 28,106, about 8.6% below its 52-week high of 30,762.20 after a sharp late-July rebound. Elevated intraday swings and heavy activity around the recent 3.3% surge suggest traders are already leaning into this part of the calendar with bigger positions and higher volume.[2]
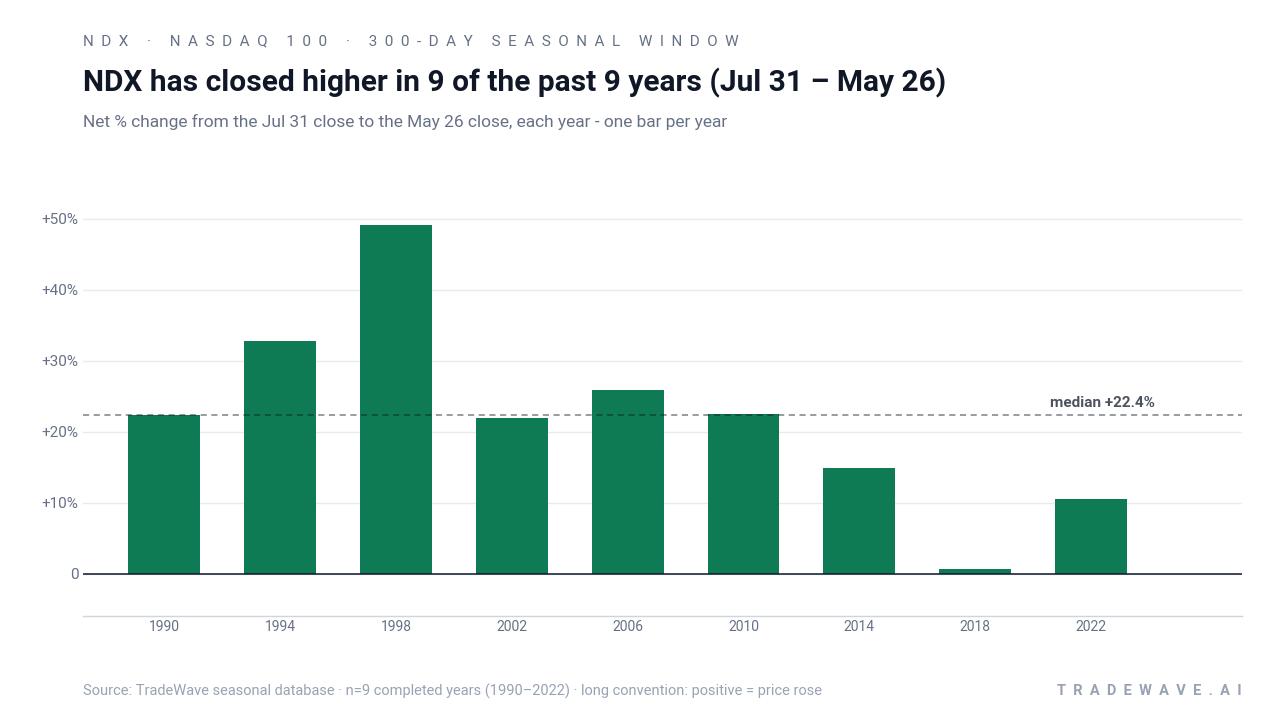
Because this pattern is grouped by the presidential election cycle, it reflects how NDX has behaved specifically in the midterm election year as policy uncertainty peaks and then into the year before the presidential election when risk appetite often improves. Pattern phase is midterm election year, and the calendar is also in the midterm election year, so this window lines up cleanly with the historical template.
Across the 9 completed cycles since 1990, the long trade direction has been rewarded every time. Percent Profitable is 100%, with 9 winners and 0 losers, and the median gain of 22.38% sits close to the average, which suggests the wins have not been driven by a single outlier year. The strongest year in this sample was 1998, when the window delivered a 49.07% net return, while the softest was 2018, which still finished up 0.64% despite a deep drawdown mid-window.
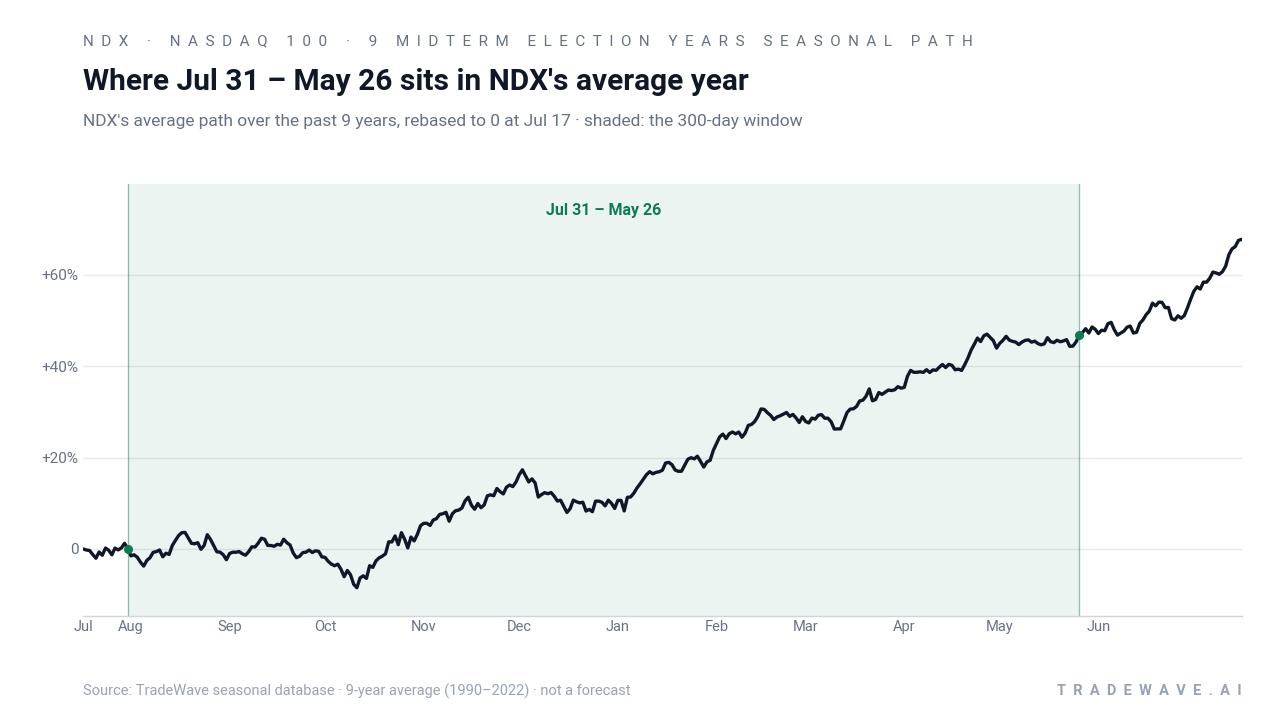
The historical seasonal average suggests gains tend to build gradually rather than in a single burst. In several years, NDX has seen early volatility and even sharp pullbacks before the uptrend reasserted itself later in the window, especially as the calendar transitions from the midterm election year into the year before the presidential election.
Year-by-year ranges show how far NDX has typically swung in both directions inside this window.
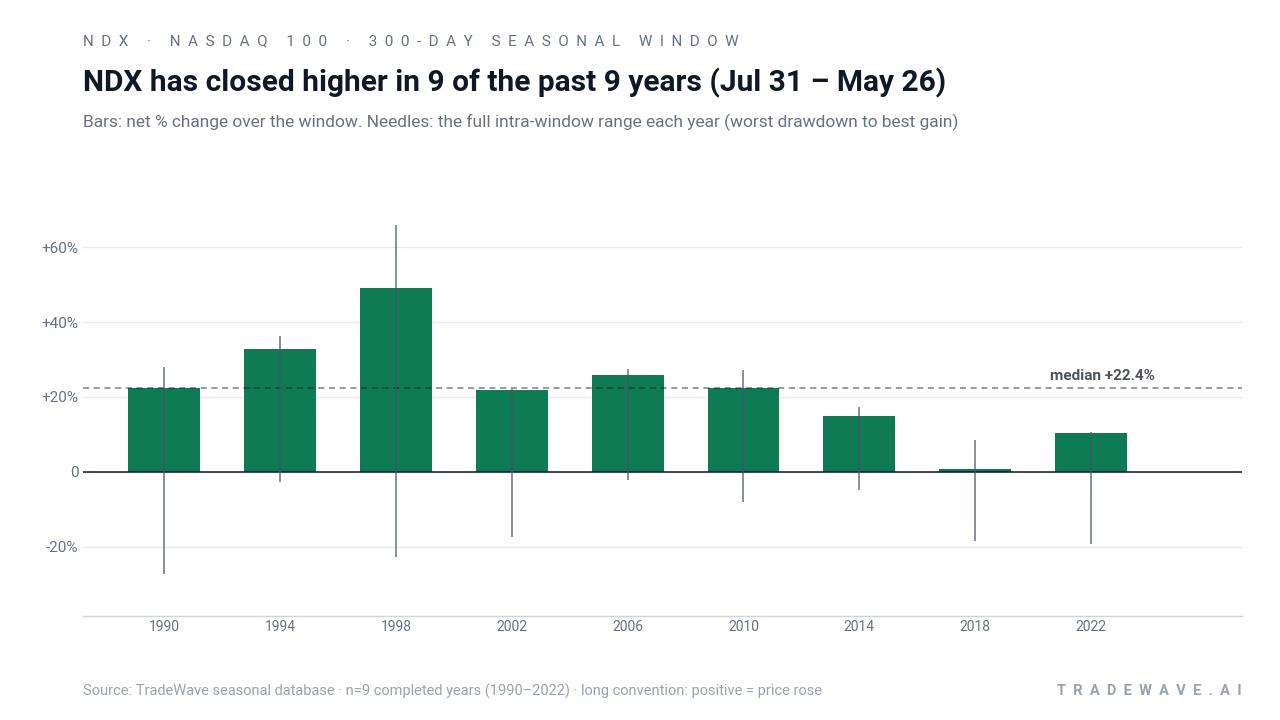
The maximum favorable move in strong years has been large, with examples like 1998 where the best intraperiod rally reached 65.8% before settling at a 49.07% gain by the end of the window. On the downside, maximum adverse moves have also been meaningful, with several cycles showing drawdowns of roughly 17% to 27% from the entry level before recovering. Add it up: 481% cumulative gains across nine midterm-year windows, but with enough volatility inside each one that timing and risk management have mattered.
History does not guarantee future results; adverse excursions can be large even in winning windows, and past NDX seasonal behavior may not repeat.
Why does Nasdaq 100 (NDX) follow this seasonal pattern?
One likely driver is the way the tech-heavy Nasdaq 100 sits at the center of the policy and liquidity story in the midterm election year. Analysts have pointed to a mix of Fed policy clarity, fiscal negotiations and regulatory noise that often peaks around the midterm vote, followed by a friendlier backdrop as the year before the presidential election begins and risk appetite improves.[3] This pattern may also reflect how large-cap tech earnings, buybacks and index rebalancing cluster in the back half of the midterm year and into the following spring, reinforcing a historical seasonality that has favored long exposure in this specific window.
What is driving Nasdaq 100 (NDX) today?
Nasdaq 100 closed around 28,106 on Jul 31, up 3.36% on the day and sitting about 8.6% below its 52-week high of 30,762.20, after a powerful tech-led surge that followed the Federal Reserve’s decision to hold interest rates steady.[2] The move snapped a stretch in which NDX had slipped into correction territory, with semiconductor weakness dragging on the index even as mega-cap software and cloud names tried to stabilize.[3][5] Intraday charts and commentary around the late-July sessions highlighted unusually large swings and heavier trading activity, consistent with elevated volume as investors used index options and ETFs to quickly adjust exposure.[2]
The chart below situates the latest rebound against the past year of trading and a 60-day seasonal projection path.
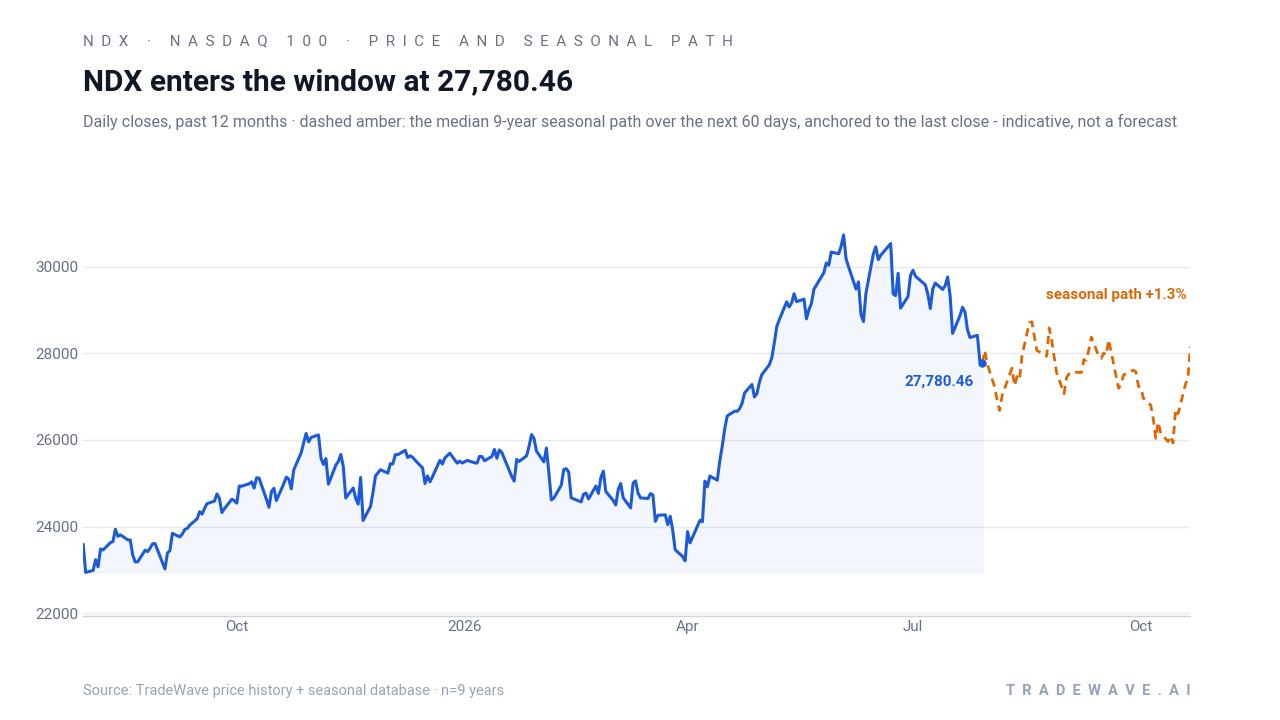
The macro backdrop around this move has been dominated by the Fed’s steady-rate stance and ongoing debate over how sticky inflation will be into year-end.[2][6] Late-July GDP and price data fed into that discussion, with traders toggling between “soft landing” and “higher for longer” narratives that tend to hit rate-sensitive growth stocks hardest.[6] Within NDX, large-cap technology names such as Microsoft helped drive the rebound, while semiconductors remained a swing factor after several sessions of heavy selling that pushed the group toward correction territory.[2][5]
Options structure is another piece of the story. NDX’s high index level around 28,000 gives traders fine strike granularity, which has encouraged more targeted hedging and speculative positioning in index options.[8] Combined with the recent spike in realized volatility, that setup can amplify intraday moves as dealers hedge flows, especially around macro events and earnings clusters that fall inside this historically strong seasonal window.
What should traders watch in this NDX seasonal window?
First, watch how NDX behaves around pullbacks inside the window. History shows that even in years that finished higher, the index often absorbed double-digit drawdowns before resuming its climb, so whether buyers step in on 10% to 15% dips will be a key tell for whether the historical pattern is tracking.
Second, keep an eye on the policy calendar. The midterm election year often brings noisy headlines around fiscal negotiations, regulation and Fed communication, followed by a more supportive tone as the year before the presidential election begins.[3][6] If the index can hold above recent lows through that transition while macro data stays “good enough,” it would rhyme with prior cycles where the bulk of the gains accrued from late in the midterm year into the following spring.
Third, monitor options and volume behavior. The late-July rally came with outsized intraday moves and signs of heavier trading activity, suggesting that institutional players are already using NDX and related ETFs to express macro views.[2][8] If that elevated options flow and volume persist into the heart of the window, it would signal that the market is leaning into the same high-conviction stretch that has historically delivered strong long-side returns.
Finally, track sector leadership inside the index. Prior midterm-year windows that posted the biggest gains tended to feature strong contributions from large-cap technology and semiconductors, while weaker years saw those groups wobble even as the index eked out a positive finish.[2][5] How those sectors trade around upcoming earnings, Fed meetings and key data releases will help confirm or challenge the powerful historical seasonality that starts on Jul 31.
Sources
- Seeking Alpha (news) – “Nasdaq-100 surges 3% as Microsoft and semis drive broad tech rally” (Jul 30, 2026)
- Yahoo Finance (Stocktwits) – “Dow Sees Worst Day In Over A Year, Nasdaq Enters Correction Territory As Fed Decision Piques Inflation Concerns” (Jul 30, 2026)
- MarketWatch – “Nasdaq-100 is on the edge of correction territory as semiconductor stocks take another beating” (Jul 28, 2026)
- Nasdaq.com – “Preferences Revealed: How Investors Are Choosing Nasdaq-100 Index® Options (NDX®) for Exposure and Risk Management” (Jul 31, 2026)
About this seasonal analysis
Seasonal pattern data is sourced from TradeWave.ai, which analyzes historical price behavior across annual calendar windows going back up to 30 years. Read the full data methodology or the book The 100-Year Pattern by Afshin Moshrefi (2026 edition). Past performance of seasonal patterns does not guarantee future results. This article is for informational purposes only and does not constitute investment advice.